Reaching Indonesia’s Poor and
Vulnerable and Reducing Inequality:
and Vulnerable and Reducing
Inequality:
REACHING INDONESIA’S POOR AND
VULNERABLE AND REDUCING INEQUALITY:
Improving programme Targeting, Design, and processes
Copyright Reserved
© 2014 National Team for the Acceleration of Poverty Reduction
Cover Photo: TNP2K Secretariat
You are free to copy, distribute and transmit this report for non-commercial purposes.
To request a copy of this report or further information, please contact the TNP2K-Knowledge Management Unit ([email protected]).
This report is also available at the TNP2K website (www.tnp2k.go.id).
NATIONAL TEAM FOR THE ACCELERATION OF POVERTY REDUCTION
Secretariat of the Vice President of the Republic of Indonesia Jl. Kebon Sirih No. 14 Central Jakarta 10110
Telephone: (021) 3912812 | Facsimile: (021) 3912511 E-mail: [email protected]
Poverty reduction is a key priority of the Susilo Bambang Yudhoyono–Boediono government. As a sign of this commitment, the National Team for the Acceleration of Poverty Reduction (Tim Nasional Percepatan Penanggulangan Kemiskinan or TNP2K) was created to promote coordination across ministries/agencies to improve the implementation of poverty reduction programmes, improve the living standards of the poor and vulnerable, as well as reduce inequality among income groups. Presidential Regulation Number 15 of 2010 legitimises and legalises the creation and role of TNP2K.
TNP2K has two specific mandates: (1) establish a national targeting system that contains a list of the names and addresses of social assistance beneficiaries, hereinafter referred to as the Unified Database), and (2) improve the efficiency and effectiveness of various poverty alleviation programmes to reach beneficiaries. Both mandates are implemented through coordination with ministries/agencies. Coordination is more efficient if there is a common basis, that is, evidence from research results and actual data from the field.
This report outlines the achievements and coordination processes of evidence-based policy making. It is hoped that this report will not only document what TNP2K has done in the past five years but also serve as a reference for policy coordination in the future. The report itself cannot possibly detail all the processes, evidence, or achievements of TNP2K. Therefore, I invite all of our readers to also access our other reports, if more detailed information is required1.
Having carried out our duties during the past five years, I would like to express deep gratitude to the Vice President, Professor Dr Boediono, for his leadership, direction, and support of TNP2K. I would also like to thank the ministries/agencies that have worked with us to reduce poverty in Indonesia. Our highest appreciation goes to the support given to the TNP2K, especially by the Department of Foreign Affairs and Trade (Government of Australia) through the Poverty Reduction Support Facility; World Bank Jakarta; U.S. Agency for International Development; and Deutsche Gesellschaft Für Internationale Zusammenarbeit. Last, but not least, my heartfelt gratitude and appreciation goes to all of our secretariat staff and policy working groups. This report is just one example of all the hard work they do every day for TNP2K.
Dr. Bambang Widianto
Contents
Development of a Unified Database
Management and Use of the Unified Database Using the Unified Database to Target
Social Protection Card and Data Updating Next Steps for Targeting
Temporary Unconditional Cash Transfer (BLSM) BLSM Challenges
Policies to Improve Implementation of the 2013 BLSM Programme Next Steps for the BLSM Programme
Cash Transfers for Poor Students (BSM)
2008–12 Implementation Challenges
Policies to Improve 2013 BLSM Programme Implementation Next Steps for the BSM Programme
National Health Insurance
Health Working Group Issues Faced
Reforms Undertaken
Next Steps for National Health Insurance
Rice for the Poor (Raskin)
Raskin’s Implementation Challenges 1998–2012 Policy for Implementing Improvements in Raskin Next Steps for the Raskin Programme
Conditional Cash Transfers for Poor Families (PKH) Challenges in Implementing PKH
PKH’s Effectiveness and Achievements Verification of PKH
Encouraging and Ensuring Complementarity between PKH and BSM Developing a Monitoring System by Strengthening and Improving MIS-PKH Developing a Trial for Applying Financial Inclusion through PKH
Designing an Organisational Framework to Increase Beneficiaries Promoting Improved Coordination in PKH’s Implementation Next Steps for the PKH Programme
National Programme for Community Empowerment (PNPM)
Problems Faced in PNPM-Mandiri
Challenges in Implementing the Programme Implementing Policy Improvements
Next Steps for the PNPM-Mandiri Programme
Inclusive Finance: Improving Access to Financial Services
Opportunities to Increase Access Activities and Achievements Next Steps for Inclusive Finance
Employment Initiative Programme Employment Programme: Challenges Opportunities
Activities and Achievements
Next Steps for Employment Initiative Programme
Advocacy
TKPK Coordination Meeting
Tables
Table 1. BLSM Implementation Budget, 2013
Table 2. Reduction Experienced by BLT Beneficiaries, 2005/2006 and 2008/2009
Table 16. Highest Educational Achievement (Urban and Rural)
Figure 1.
Decline of Poverty in Indonesia, 1976–2009
Distribution of Indonesian Household Expenditure by Month, 2009
Indonesian Gini Coefficient, 1999–2009 Public Consumption Growth, 2008–12
Targeting Accuracy of Poverty Reduction Programmes, 2008
Targeting Accuracy of Major Social Assistance Programmes
Estimated Errors by Targeting Method PPLS 2011 Process
Social Protection Card
Process for Updating KPS Beneficiaries Proposed UDB Updating Steps
Under- and Overcoverage of BLT Targeting, 2008 BLT Reductions, 2005/2006
Social Protection Card (KPS) Beneficiary Updating Process LAPOR! Public Awareness Materials
The Handbook of Dissemination, Implementation and Resolving Beneficiary Issues with the Social Protection Card
TKSK Handbook
Evaluation of BSM Programme Targeting Accuracy Process Followed for BSM Targeting, 2008–12 Evaluation of Likelihood of Continued Education, by Expenditure Quintile
Changes Recommended to Improve BSM Beneficiary Targeting Mechanism
KPS and BSM Beneficiary Candidate Cards KPS Use to Improve BSM Targeting BSM Beneficiary Bank Account
Socialisation Material on How to Use KPS to Receive Programme Benefits
Socialisation Material on How to Use KPS to Receive Programme Benefits
Figure 28.
Roles of MoH, TNP2K, and PT Askes in 2013 Jamkesmas Beneficiaries Programme Targeting
Calculating JKN Premium Assistance for PBI beneficiaries (PBI JKN)
Visualisation of Jamkesmas Individual Claims
Map Illustrating Need for Doctors (5,000 Beneficiaries for Every 2 Doctors)
Proportion of Diagnosed cases and Unmet Needs for Hypertension care per Province
Queues at Various Hospitals in Jabodetabek Area Composition of Expenditures by Poor Households Annual Food and Nonfood Goods Inflation Raskin Targeting Effectiveness
Time between Issuance of Raskin SPA and Signing of BAST, 2013
Raskin TB Locations
Proportion of Villages/Urban Wards Charging Fee for Raskin Rice and Average Value of Fee
Raskin Pilot Card, 2012
Poster of List of Beneficiaries, 2012
Average Kilograms of Rice Received by Beneficiary Households in Areas with and without Cards
Amount Paid by Target Household per Kilogram
Kilograms of Rice Received by Target Households (J-PAL RCT) Replacements Summary Form, June–December 2012 Public Awareness Materials on Using KPS for Raskin Total Household Members Receiving PKH Benefits, 2013 Percentage of Total Household Members Successfully Verified in Three Months
Complementarity of PKH with Other Social Assistance Programmes
PKH Implementation Workbook
Recertification and Implications for Beneficiary Status Recertification Questionnaires for 2007 and 2008 Cohorts PKH Recertification Complaints Mechanism
Meeting on Recertification Outcomes and Complaints General Guidelines for PKH Beneficiary Transformation SMART-PKH Application Dashboard
128
Proportion of Households Receiving Business Credit by Source and Expenditure
Proportion of Households Receiving KUR by Expenditure Decile
Inclusive Finance Agenda and Target Groups
General Framework Based on Five Pillars of Framework for Action for Creation of Employment and Workforce Skills Improvement
Integrated Employment Creation Programme for Youth Work Force
TKPK at District/City Level by Province TKPK Created as of March 2014
TKPK Coordination Meetings at Province and District/ City Levels
TKPK Coordination Meetings by Frequency, Leadership, and Participants, 2013
TKPK Handbook Issued by TNP2K
Samples of Regional Regulations on SPKD Regions by Status of SPKD Document
TKPK Participating in Apprenticeships and Training by TNP2K as of March 2014
Samples of Regional Poverty Reduction Reports Samples of Analysis Conducted by District
Correlation between Arrival of Teaching Supervisors and Teacher Absenteeism
Teacher Absenteeism by Teacher Receipt of Special Allowance Language Lesson for Grade 4 (left) and Mathematics for Grade 5 (right): Primary Schools in Papua
Trial Locations
Abbreviations
APBN Anggaran Pendapatan dan Belanja Negara (annual national Budget)
Bappenas Badan Perencanaan dan Pembangunan Nasional (national
Development planning agency)
BLSM Bantuan Langsung Sementara Masyarakat (Temporary
Unconditional cash Transfers)
BLT Bantuan Langsung Tunai (Unconditional cash Transfer)
BPJS Badan Penyelenggara Jaminan Sosial (social security
administrative Body)
BSM Bantuan Siswa Miskin (cash Transfers for poor students)
Bulog Badan Urusan Logistik (national Logistics agency)
DPM Daftar Penerima Manfaat (target beneficiaries)
DPR Dewan Perwakilan Rakyat (people’s representative council)
FKTP Fasilitas Kesehatan Tingkat Pertama (First-Level Health Facility)
Jamkesda Jaminan Kesehatan Daerah (regional Health Insurance)
Jamkesmas Jaminan Kesehatan Masyarakat (public Health Insurance)
JKN Jaminan Kesehatan Nasional (national Health Insurance)
KIAT Kinerja dan Akuntabilitas Guru (Teacher performance and accountability)
KPS Kartu Perlindungan Sosial (social protection card)
KUR Kredit Usaha Rakyat (credit for Businesses)
LAPOR! Layanan Aspirasi dan Pengaduan Online Rakyat (registering people’s aspirations and service complaints online or reporT!)
LP2KD Laporan Pencapaian Penanggulangan Kemiskinan Daerah (regional poverty reduction achievement report)
MI Madrasah Ibtidaiyah (Islamic primary school)
MIS management Information system (Sistem Manajemen
Informasi)
MoEC ministry of education and culture (Kementerian Pendidikan
dan Kebudayaan)
MoF ministry of Finance (Kementerian Keuangan)
MoRA ministry of religious affairs (Kementerian Agama)
MoSA ministry of social affairs (Kementerian Sosial)
MT Madrasah Tsanawiyah (Islamic Junior secondary school)
Musdes Musyawarah Desa (village meeting)
Muskel Musyawarah Kelurahan (Urban Ward meeting)
OPK Operasi Pasar Khusus (market operation for sale of
subsidised rice)
P4S Program Perluasan dan Percepatan Perlindungan Sosial (programme for expanding and accelerating social protection)
PBI Penerima Bantuan Iuran (premium assistance Beneficiaries)
PKH Program Keluarga Harapan (conditional cash Transfers for
Raskin Subsidi Beras Bagi Masyarakat Berpendapatan Rendah (subsidised rice for the poor programme)
Rp Indonesian rupiah
RTS Rumah Tangga Sasaran (Target Households)
RTS-PM Rumah Tangga Sasaran–Penerima Manfaat (Beneficiaries in
Target Households)
SD Sekolah Dasar (primary school)
SKPD Satuan Kerja Pemerintah Daerah (Local government
Working Unit)
SMA Sekolah Menengah Atas (senior secondary school)
SME small and medium-sized enterprises
SMP Sekolah Menengah Pertama (junior secondary school)
SMS short message service
SNKI Strategi Nasional Keuangan Inklusif (national strategy for
Inclusive Finance)
SPA Surat Permintaan Alokasi (allocation request Letter)
SPKD Strategi Penanggulangan Kemiskinan Daerah (regional
poverty reduction strategy)
Susenas Survei Sosial dan Ekonomi Nasional (national socio-economic survey)
TB Titik bagi (share points)
TD Titik distribusi (distribution point)
TKPK Tim Koordinasi Penangulangan Kemiskinan (coordination Team for poverty reduction)
TKSK Tenaga Kesejahteraan Sosial Kecamatan (subdistrict social
Welfare personnel)
TNP2K Tim Nasional Percepatan Penanggulangan Kemiskinan (national Team for the acceleration of poverty reduction)
UDB Unified Database for social assitance programmes (Basis
Data Terpadu Untuk Program Perlindungan Sosial)
UKM Upaya Kesehatan Masyarakat (community Health Initiative)
UKP4 Unit Kerja Pengawasan dan Pengendalian Pembangunan (presidential Working Unit for Development supervision and control)
UPPKH Unit Pelaksana Program Keluarga Harapan (central pKH
Pictures
Temporary Unconditional Cash Transfers (BLSM) Temporary Unconditional Cash Transfers (BLSM) Temporary Unconditional Cash Transfers (BLSM) Temporary Unconditional Cash Transfers (BLSM) Cash Transfers for Poor Students (BSM)
Cash Transfers for Poor Students (BSM) Cash Transfers for Poor Students (BSM) Cash Transfers for Poor Students (BSM) National Health Insurance
National Health Insurance National Health Insurance National Health Insurance National Health Insurance
Subsidised Rice for the Poor (Raskin) Subsidised Rice for the Poor (Raskin) Subsidised Rice for the Poor (Raskin) Subsidised Rice for the Poor (Raskin)
Conditional Cash Transfers for Poor Families (PKH) Conditional Cash Transfers for Poor Families (PKH) Conditional Cash Transfers for Poor Families (PKH) Conditional Cash Transfers for Poor Families (PKH)
InTroDUcTIon
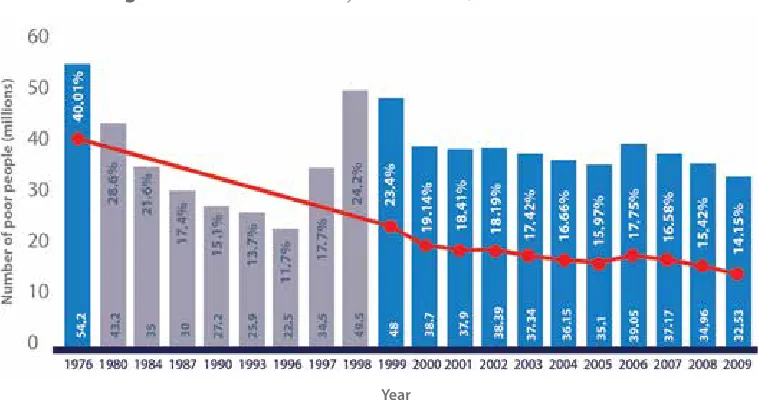
The two decades from 1976 to 1996 were among the most impressive periods of development in Indonesia and became known for rapid poverty reduction. During this period, the poverty rate in Indonesia fell from about 40 to 11.7 percent. This downward trend ended when Indonesia was hit by the 1997–98 Asian financial crisis. From the beginning of the year 2000, however, the downward trend in poverty rates resumed but at a slower pace compared with the pre-1997–98 crisis period. This slowdown in poverty reduction continued until the beginning of the SBY-Boediono administration in 2009, as shown in figure 1.
Figure 1. Decline of Poverty in Indonesia, 1976–2009
The deceleration in the rate of poverty reduction is explained by at least two facts. First, when the poverty level is relatively low, the rate of poverty reduction will naturally decelerate more slowly than when the poverty level is high, for example, in the range of 30–40 percent. Second, when the rate of poverty reduction slows at a relatively low poverty level, it likely indicates chronic poverty, which requires a more complex and time-consuming response.
In 2009, the poverty rate was 14.15 percent, and the number of people who fell below the poverty line amounted to 32.53 million individuals. This figure is high, especially compared with the percentage of poor people in neighbouring countries. The
SBY-Introduction
Source: Various publications by Statistics Indonesia.
Boediono government has focused on this challenge from the beginning. In addition to the slowing decline in the poverty rate and numbers of poor, vulnerability to becoming poor was also a problem. As shown in figure 2, the distribution of expenditure per capita per month in 2009 was concentrated on the left side of the chart. This means that, in addition to the poor population, the number of people who were not categorised as poor but fell just to the right of the poverty line, indicated by the blue bar, was still quite high. This population group is referred to as the vulnerable group. Relatively small economic shocks can push those in the vulnerable group back into poverty. National Socio-Economic Survey (Survei Sosial Ekonomi Nasional or Susenas) data reveals that, in 2009, the poor and vulnerable accounted for at least 40 percent of Indonesia’s total population at the time. This means that 4 out of 10 Indonesians were classified as poor or vulnerable to poverty.
Figure 2. Distribution of Indonesian Household Expenditure by Month, 2009
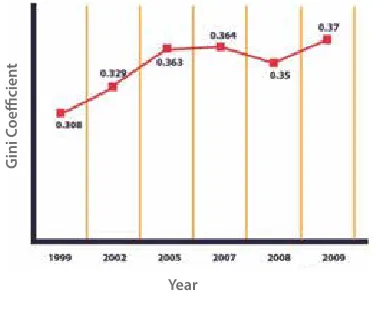
The related issue of worsening income inequality was also examined at the beginning of SBY-Boediono’s administration. As shown in figure 3, the Gini coefficient—an indicator of household expenditure gap—in Indonesia has tended to increase since the beginning of the year 2000. At the beginning of SBY-Boediono’s government in 2009, the Gini coefficient had reached 0.37. This figure, although not very different from the previous year, crossed Indonesia’s Gini coefficient ‘psychological barrier’, which for years had tended to remain between 0.35 and 0.36. The worsening income gap has shown that upper income groups have been enjoying a higher rate of growth than lower income groups. If unchecked, this situation could, in the long run, lead to economic and social issues.
P
opula
tion 14.15% below poverty line
Monthly consumption per capita (Rp)
InTroDUcTIon
What illustrates inequality among income groups? Analysis of 2008 and 2012 Susenas data showed that spending growth for the poorest 40 percent of the population, although positive, was well below spending growth for the richest 20 percent. As shown in figure 4, spending by the poorest 40 percent grew by about 1.8 to 2.1 percent, whereas spending by the richest 20 percent grew by about 5.1 to 8.5 percent.
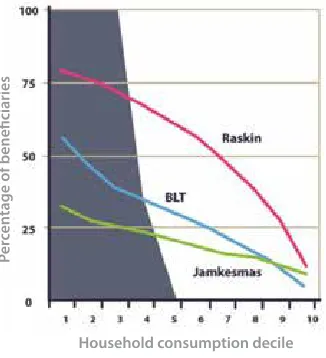
In addition to issues related to poverty and inequality, the targeting accuracy of Indonesia’s poverty reduction programmes presented another challenge. As shown in figure, only a
Gini Coefficient
Figure 3. Indonesian Gini Coefficient, 1999–2009
Source: Statistics Indonesia
Figure 4. Public Consumption Growth, 2008–2012
Source: TNP2K
G
ini C
oefficien
t
portion of target households (area shaded in grey) benefited from the Subsidised Rice for the Poor (Subsidi Beras bagi Masyarakat Berpendapatan Rendah or Raskin), Unconditional Cash Transfer (Bantuan Langsung Tunai or BLT), and Public Health Insurance (Jaminan
Kesehatan Masyarakat or Jamkesmas) programmes. However, figure 5 also illustrates that
some nontarget households—those who are neither poor nor vulnerable—benefit from these programmes. Errors in which target beneficiaries do not receive the benefits of a programme are referred to as exclusion errors, whereas errors in which nontarget groups benefit from a programme are referred to as inclusion errors. A high rate of exclusion and inclusion errors affects the effectiveness of a programme and indicates that the database needs better programme targeting, design, and processes. In 2008, programme targeting performance was far from good. An analysis of Susenas data indicated that, in 2008, only 30 percent of the poor were beneficiaries of all three programmes: Raskin, BLT, and Jamkesmas.
Figure 5. Targeting Accuracy of Poverty Reduction Programmes, 2008
TNP2K was established in early 2010 through Presidential Regulation (Peraturan Presiden or Perpres) Number 15 in response to the slowing decline of the poverty rate and increasing inequality. This Perpres was followed by the issuance of Ministerial Regulation (Peraturan
Menteri or Permen) Number 42 of 2010 on the Institutional Structure and Process of the
Local Poverty Reduction Coordination Team (Tim Koordinasi Penanggulangan Kemiskinan
Daerah or TKPKD). The main mandate given to TNP2K was to increase the effectiveness
of poverty reduction programmes, including improving (1) targeting, (2) programme
Source: Adapted from data from 2008 Susenas.
Note: Decile 1 is the poorest tenth of the population; decile 10 is the wealthiest tenth of the population.
Household consumption decile
P
er
cen
InTroDUcTIon
design and delivery processes, (3) coordination among agencies to increase programme effectiveness, and (4) supervision and control of poverty reduction programme implementation. In 2010–14, TNP2K improved policies related to poverty reduction by developing the Unified Database as a way to improve targeting of household- and individual-based programmes. TNP2K also improved the design and delivery processes of each programme from Clusters 1, 2 and 3. TNP2K made these overall improvements based on the needs of beneficiaries and other evidence obtained from the field.
This report documents the steps taken by TNP2K in accordance with its mandate to reduce poverty. The report covers the following topics:
a. Targeting
b. National Health Insurance (Jaminan Kesehatan Nasional or JKN)
c. Temporary Unconditional Cash Transfers (Bantuan Langsung Sementara untuk
Masyarakat or BLSM)
d. Subsidised Rice for the Poor (Raskin)
e. Cash Transfers for Poor Students (Bantuan Siswa Miskin or BSM)
f. Conditional Cash Transfers for Poor Famllies (Program Keluarga Harapan or PKH) g. National Programme for Community Empowerment (Program Nasional
Pemberdayaan Masyarakat or PNPM)
h. Financial inclusion i. Youth employment
j. Advocacy Work with the Coordination Teams for Poverty Reduction (Tim Koodinasi
Penanggulangan Kemiskinan or TKPK)
TargeTIng
Since 2009, Indonesia has implemented a series of social assistance programmes as part of efforts to improve the welfare of the nation, especially for those who are poor and vulnerable to poverty. These social assistance programmes can be divided into several groups based on the beneficiaries targeted. One group includes social assistance programmes that target individuals and/or households, such as Subsidised Rice for the Poor (Raskin), Public Health Insurance (Jamkesmas2), Cash Transfers for Poor Students
(BSM), and the Conditional Cash Transfers for Poor Families (PKH) programme.
A major challenge for social assistance programmes is appropriately and accurately identifying target individuals and/or households. In 2009, each programme used a different process and method to overcome two challenges:
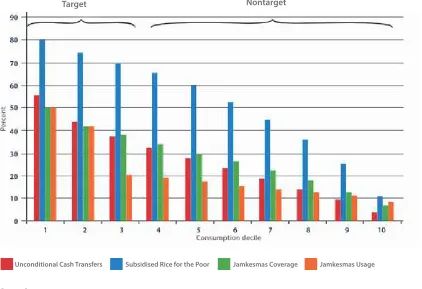
a. Low accuracy of programme targeting, as reflected by the large number of exclusion and inclusion errors in several major programmes (figure 6).
b. Low complementarity among programmes targeting eligible groups. Target groups eligible to benefit from several social assistance programmes actually received less than for what they are eligible. For example, some PKH beneficiary households were not beneficiaries of the Raskin and Jamkesmas programme, even though PKH beneficiary households are among the poorest households
and should also have benefited from other social assistance programmes.
2. as of January 2014, Jamkesmas was renamed national Health Insurance (Jaminan Kesehatan nasional or JKn).
Both of these challenges directly impact the successful achievement of poverty reduction goals; improving the targeting system is a priority for addressing these challenges. Therefore, at the beginning of his administration, President Yudhyono mandated that Vice President Boediono be responsible for the acceleration of poverty reduction through the formation of TNP2K. TNP2K was established pursuant to Presidential Regulation Number 15 of 2010 on the Acceleration of Poverty Reduction and is chaired by the Vice President of the Republic of Indonesia. This agency became an important factor in providing the necessary support and encouragement to improve and accelerate efforts to reduce poverty. One key agenda item was the unification of the targeting system.
DEVELOPMENT OF A UNIFIED DATABASE
The main prerequisite for a unified targeting system is the availability of a national database that contains information on the characteristics of individuals and/or households that are potential target beneficiaries. This data can be used to select beneficiaries for social assistance programmes. To this end, TNP2K established a social assistance database called the Unified Database (UDB) for Social Assistance Programmes. The first important step
Target Nontarget
Unconditional Cash Transfers Subsidised Rice for the Poor Jamkesmas Coverage Jamkesmas Usage
Figure 6. Targeting Accuracy of Major Social Assistance Programmes
TargeTIng
in building this database was household-level data collection activities for information on where individuals and/or households live and their socioeconomic conditions. This was not new for Indonesia. The 2005 Socioeconomic Data Collection (Pendataan
Sosial Ekonomi) was carried out to target beneficiary households for the 2005/2006 and
2008/2009 BLT programmes. A similar data collection exercise was conducted in 2008, entitled 2008 Data Collection for Social Assistance Programmes (Pendataan Program
Perlindungan Sosial or PPLS), which became a basis for targeting in PKH and other
national programmes. However, at that time there was a lack of strong support and encouragement for using the results of the 2005 Socioeconomic Data Collection or 2008 PPLS as a basis for targeting in social assistance programmes.
Recommendations from this series of studies also became important input for Statistics Indonesia for improving the PPLS 2011 data collection process. Figure 8 presents the PPLS process in general.
P
Figure 7. Estimated Errors by Targeting Method
Source: TNP2K
Verification of households by local leaders
Figure 8. PPLS 2011 Process
Several innovations—some inspired by the study—were included by TNP2K in the PPLS 2011. These included:
a. Increasing coverage of the data collection exercise to about 45 percent of the Indonesian population, compared with 29 percent in 2008.
b. Use of the Poverty Map method to process 2010 Population Census data to compile the initial list of households to be included in PPLS 2011.
c. Using a process of consultation with poor communities to identify unrecorded poor households.
TargeTIng
d. Adding characteristic variables of individuals and households to better predict the socioeconomic conditions of households and better accommodate the needs of the programme.
Once household data was collected, analysis was undertaken to obtain estimates of the socioeconomic conditions of each household. An important innovation at this stage were improvements to the Proxy Means Test method, including the addition and selection of socioeconomic condition predictor variables. In addition, the Proxy Means Test model was adjusted to the conditions of each district/municipality or, in other words, creation of a specific model for each district/municipality. The estimation results using the Proxy Means Test allowed for the further ranking of households based on their socioeconomic conditions. This ranking resulted in the selection of the 40 percent of households with the lowest socioeconomic conditions, or about 25 million households consisting of 96 million individuals for inclusion in the Unified Database, which the TNP2K Secretariat would manage.
MANAGEMENT AND USE OF THE UNIFIED DATABASE
The TNP2K Secretariat formed a special unit to manage the Unified Database, named the National Targeting Unit for Poverty Reduction (Unit Penetapan Sasaran untuk
Penanggulangan Kemiskinan). This unit performs three main functions in the management
of the UDB:
a. Services for the programme provider: Collaborate with programme implementers to ensure that the Unified Database can be used to target social assistance programmes, as well as provide technical support to users of the Unified Database.
b. Studies and research: Conduct studies or analyses to improve the quality of programme targeting, and monitor and evaluate the use of the Unified Database. c. Presentation of information: Build an information technology–based system to
provide information on the Unified Database, including the development of a website that allows users to access 16 selected indicators for the provincial, district/municipality, and subdistrict levels. This information can be downloaded in the form of data and maps as a part of the Open Government Initiative coordinated by the Presidential Working Unit for Development Supervision and Control (Unit Kerja Pemerintah bidang Pengawasan dan Pengendalian
Since its launch in January 2012, the Unified Database has become a key reference for targeting national social assistance programmes, such as:
a. Subsidised Rice for the Poor (Raskin)
In July 2012, the Raskin programme began to use UDB data to target 17.5 million beneficiary households. It also used the UDB as the basis for targeting in 2013 and 2014 for about 15.5 million households.
b. Health Insurance for the Poor (Jamkesmas)
Since 2013 the Jamkesmas programme has used the UDB to determine its 84.5 million individual beneficiaries. Based on its coverage, Jamkesmas is the largest social insurance programme in Indonesia. When Jamkesmas evolved into the National Health Insurance (Jaminan Kesehatan Nasional or JKN) in January 2014, the basis for targeting beneficiaries to receive assistance toward premium payments (Penerima
Bantuan Iuran or PBI) continued to be the UDB.
c. Cash Transfers for Poor Students (BSM)
TargeTIng
was switching the targeting processes to the UDB from those used by schools and school committees. The first phase in this adjustment was the issuance and delivery in 2012 of the ‘BSM Beneficiary Candidate’ card (herein referred to as BSM card) to 350,000 seventh grade students and in 2013 to 670,000 first and seventh grade students. Furthermore, since July 2013, each school-going member of a Raskin household automatically becomes a beneficiary of the BSM programme.
d. Conditional Cash Transfer Programme for Poor Families (PKH)
In mid-2012, PKH also used the UDB to target 484,000 new beneficiary households. In 2013, the PKH re-accessed the UDB to identify 800,000 additional households.
e. Child Assistance Programme–PKH (Program Perlindungan Pekerja Anak–PKH) Managed by the Ministry of Manpower and Transmigration, this programme has also used the UDB to identify prospective programme beneficiaries, for example, 10,000 child workers in 2012 and 11,000 child workers in 2013.
f. Local Social Assistance Programmes
In addition to national social assistance programme providers, local governments have also used the UDB to target locally initiated social assistance programmes. As of April 2014, 31 provinces and 303 districts/municipalities had accessed and used the UDB. Aggregate data from the UDB has also been used by universities, non-governmental organisations, and others. All this use demonstrates the high level of interest and need for a reliable database for targeting programme beneficiaries and further affirms the UDB’s strategic role in social assistance programmes.
To continually improve services for social assistance programme providers and UDB users, the TNP2K Secretariat also monitors and evaluates the UDB and its use:
First,
at the beginning of 2012, TNP2K conducted an internal sampling that showed that about 90–95 percent of the names and addresses in the UDB could be found on the ground.a unique identity number (Nomor Induk Kependudukan or NIK) and Family Card (Kartu
Keluarga) number.
Third,
feedback from local governments in their roles as UDB users and local programme providers confirmed the importance of the involvement and active participation of local governments and communities in UDB data collection activities and updates. TNP2K’s internal sampling and its matching of UDB data with demographic data in order to measure UDB quality—the purpose of monitoring and evaluation—indicated a relatively small number of issues associated with the UDB before, during, and after the programme implementation process. Nevertheless, issues with the UDB persist and need resolution. For more information about the UDB, see https://bdt.tnp2k.go.id.USING THE UNIFIED DATABASE FOR SOCIAL PROTECTION CARD
TARGETING AND DATA UPDATING
In mid-2013, the government officially reduced the fuel price subsidies and allocated the savings to assist targeted poor households. As part of this reallocation, the government launched the Programme for the Acceleration and Expansion of Social Assistance (Program
Percepatan dan Perluasan Perlindungan Sosial or P4S). It did so by issuing Social Protection
Cards (Kartu Perlindungan Sosial or KPS) to beneficiaries of social assistance programmes. These cards were issued to be valid until the end of 2014. Target households totalled 15.5 million or the poorest 25 percent of the individuals identified in the UDB. Households with a KPS are entitled to access benefits for the BLSM, BSM (if they have children in school), and PKH (for households/families categorised as very poor households) programmes. Use of the KPS further strengthened social assistance initiatives by improving programme targeting and the complementarity of the social assistance programmes. Figure 9 is an example of the KPS.
Figure 9. Social Protection Card (KPS)
TargeTIng
The KPS was the first card launched by the Indonesian government
that could be used to obtain benefits from various social
assistance programmes.
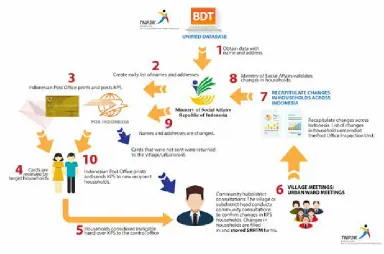
In addition to issuing the KPS to improve targeting performance, TNP2K also proposed and designed a process to update KPS beneficiary data. The prohibitive cost, complexity, and time-consuming nature of such data collection, however, means that it cannot be an annual exercise. Therefore, TNP2K proposed a method for updating data at the grassroots level through a series of village and urban ward meetings (figure 10). Results from 2013 indicate such meetings could be a good option for updating the Unified Database in the future. In 2013, it was agreed that 350,000 households of 15.5 million households (about 2.3 percent) would be updated.
NEXT STEPS FOR TARGETING
An internal TNP2K review and feedback from social assistance programme providers and other UDB users indicated that the UDB, which includes basic information on households and individuals required for implementation of such programmes, is greatly needed (Bah, Mardiananingsih, and Wijaya 2014). However, the UDB still needs to be improved
Figure 10. Process for Updating KPS Beneficiaries
to accommodate the individual goals and needs of each programme. Furthermore, changes in demographics, migration, and socioeconomic conditions of beneficiaries require periodic UDB updates. Several updating methods are available at different levels and could complement each other:
The following points should be considered in a national update of the UDB:
a. Harmonising new quotas for target households with previous quotas. It is important to avoid a large difference between the quotas already in place for poor households and the proposed coverage of social assistance programmes for each location. The benefit of real-time quota synchronisation and data collection is to minimise sudden changes in the quota of target households to enable smooth programme implementation at any level below the national level.
b. Involving ministries/agencies that provide social assistance programmes from the early stages of targeting activities. The experience of ministries and agencies in programme implementation is critical to improving targeting. The identification and subsequent record of beneficiaries is essential to the preparation of the pre-list of poor households. Therefore, concerns that some
Updates based on feedback from UDB users about individuals and households that register or withdraw as programme beneficiaries. Information about the identification of and changes in programme beneficiaries routinely communicated to UDB managers so data is up to date.
Periodic updates completed by local governments, which have the closest and most direct contact in the field with programme implementers and also have the most information about conditions in the region.
TargeTIng
potential programme beneficiaries may not be covered by the UDB can be addressed, except in cases where socioeconomic conditions change after data collection.
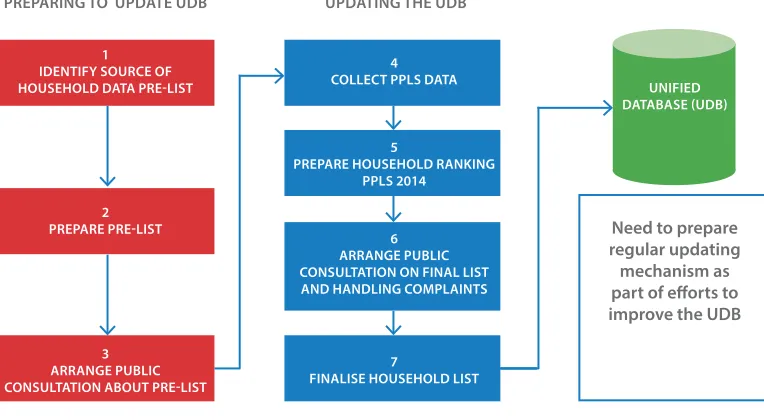
c. Encouraging greater participation by and involvement of local governments and communities. The consultation process with the poor needs to be improved and expanded to larger groups of poor people. Public participation can be promoted through additional activities during the updating process, for example, public consultation events at which communities receive a list of beneficiaries for feedback on its accuracy. Figure 11 presents an alternative process for a comprehensive nationwide UDB update.
Accurate targeting is key to the success of social assistance programmes; therefore, the maintenance and improvement of UDB functions is important. Improvements to the UDB will have a direct bearing on the improvement of social assistance programme targeting as well as complementarity among such programmes. The KPS, which will expire at the end of 2014, should be continued in order to further strengthen the targeting of social assistance programmes.
Figure 11. Proposed UDB Updating Steps
1
Identifikasi Sumber Data RT Dalam Pre-list
PREPARING TO UPDATE UDB
Temporary UnconDITIonaL casH TransFers (Blsm)
The Temporary Unconditional Cash Transfers (Bantuan Langsung SementaraMasyarakat
or BLSM) programme was one form of compensation provided to poor and vulnerable households to compensate for rising fuel prices in 2013. BLSM is not designed as a long-term solution to poverty but instead to act a short-long-term measure to prevent a decline in the purchasing power of poor households, which could in turn have implications in terms of asset sales, school attendance, consumption of nutritious foods, and child labour reduction, among others.
The implementation of BLSM 2013 was informed by the success of the 2005/2006 and 2008/2009 BLT programmes in sustaining the consumption levels of poor and vulnerable households after fuel price hikes in 2005 and 2008. Several evaluations indicated that the distribution of BLT funds was timely and effective in the short term in sustaining household consumption despite rising fuel prices. BLT beneficiary households in 2005 successfully planned their expenditures (for example, by reallocating or reducing their consumption) to overcome the negative impact of rising fuel prices, so their level of consumption did not change significantly. Furthermore, Bazzi et al (2014) found the BLT to be highly effective if cash assistance was provided in a timely manner; delays in cash assistance disbursement led to a decline in household consumption by 7.5 percent.
In 2013, the BLSM programme targeted the poorest 25 percent of households in Indonesia. According to the Unified Database, the number of targeted households (Rumah Tangga
Sasaran or RTS) that received BLSM benefits was 15,530,897. A Social Protection Card
(KPS) was sent directly to each target household3. BLSM beneficiaries were required to
bring their KPS and supporting documents to their nearest post office to collect the cash assistance.
The amount and duration of the BLSM was influenced by poverty line inflation (2008–13), the duration of the initial inflationary impact of fuel price hikes, and the government’s fiscal capacity. Based on an evaluation of the impact of fuel price hikes in 2005 and 2008, BLSM was set at Rp 150,000 per month over a four-month period (table 1). With assistance per household totalling Rp 600,000, BLSM amounted to about 15 percent of the income of poor households. At this level, the BLSM programme was expected to be effective
3. See the description on KPS in the section on targeting.
Temporary UnconDITIonaL casH TransFers (BLsm)
in protecting the welfare of poor and vulnerable households and simultaneously not causing a reduction in the productivity of beneficiary households. The total budget for the 2013 BLSM was Rp 9,318.5 billion (table 1).
The Ministry of Social Affairs (MoSA) implements the BLSM programme. However, because BLSM is meant to compensate for fuel price hikes, its implementation is coordinated by the Vice President of the Republic of Indonesia. The Vice President chairs the Central Control
Table 1. BLSM Implementation Budget, 2013
Item APBN-P 2013 Target Households 15,530,897 Value of assistance/month (Rp) 150,000 Duration (months) 4 TOTAL (Rp. billions) 9,318.5
TEmPORARy UNCONDITIONAl CAsH TRANsFERs (Blsm)
Team, which consists of a consortium of ministries, and the Programme Implementation Agency. The Central Control Team provides guidance to Local Government Working Units (Satuan Kerja Pemerintah Daerah or SKPD) in their capacity as provincial/district-level programme providers.
BLSM CHALLENGES
Based on the results of a study on the implementation of BLT in 2005 and 2008, TNP2K identified the following challenges:
a. BLSM Beneficiary Household Targeting
A World Bank study (2011) revealed that 40 percent of the poorest households in Indonesia in 2008 received two-thirds of total BLT funds. Figure 12 shows that the greatest mistargeting occurred in the province of Nanggroë Aceh Darussalam and all provinces in East Nusa Tenggara, Kalimantan, Papua, and West Papua. Targeting accuracy was highest in East Java.
Factors causing BLT/BLSM mistargeting include issues with source data and an imperfect beneficiary verification process. SMERU (2011) indicated that the verification process of 2008 BLT beneficiary households from the 2005 Socioeconomic Data
Source: World Bank (2011) TEmPORARy
UNCONDITIONAl CAsH TRANsFERs (Blsm)
Collection was not effective. Verification, which should have involved all levels of society, only involved leaders in urban wards.
b. Households Receiving the Correct Amount of BLT
One of the main challenges in BLT/BLSM implementation has been ensuring that beneficiary households receive the correct amount of BLT. The payment process through PT Pos Indonesia and the use of a barcode only ensures that the right amount of benefits is paid to households at post offices. However, it cannot prevent a reduction in this assistance, for example, if households arrange for an intermediary to pick up the benefit for a fee. A 2006 SMERU study (figure 13) showed that nearly 6 percent of 2005 BLT beneficiaries experienced such a benefit reduction in their first payment. For the second payment, the percentage increased to about 10 percent of 2005 BLT beneficiaries.
Similar analysis by the World Bank (2011) showed that, in 2005/2006, 10 percent of households experienced a reduction in BLT benefits (table 2). Unfortunately, this percentage increased to 40 percent of beneficiaries for the 2008-2009 BLT. The intention of those distributing benefits was to divide them equally among both BLT beneficiaries and non-beneficiaries and to cover the cost of issuing new identity cards.
Source: SMERU (2006)
TEmPORARy UNCONDITIONAl CAsH TRANsFERs (Blsm)
c. Public Awareness Initiatives
Raising public awareness of the BLT and BLT data collection process is key to the BLT programme’s success. However, the World Bank (2011) and SMERU (2011) found that the dissemination of such information was its greatest challenge during the 2005 and 2008 implementation processes. Structured awareness raising was only undertaken up to the district/municipality level. Households obtained information on the BLT and BLT processes from various channels, such as subdistrict heads, village heads, television, and radio. This limited communication led to different interpretations by communities, which proved to be among the more serious difficulties for BLT implementers to overcome.
On Average (63%) Redistribute Equally (42%)
Head of village (25%)
Transportation Fee (26%) New Identity Card (29%) 45-54
2008/2009
TOTAL ( RP IN THOUSANDS) Tranche 1 53
d. Public Complaints
A main component in the implementation of this social assistance programme has been a complaints system through which households can submit complaints related to programme implementation. The World Bank (2011) estimated that one-third of beneficiary households faced implementation issues during the 2005 BLT.
POLICIES TO IMPROVE IMPLEMENTATION OF THE 2013 BLSM PROGRAMME
Based on an evaluation of the challenges faced during implementation of the 2005/2006 and 2008/2009 BLT, TNP2K strived to improve the 2013 BLSM by:
a. Increasing the Accuracy of BLSM Beneficiary Household Targeting
In 2013, the list of BLSM beneficiary households was still comprised using the 2011 UDB, which represented socioeconomic conditions in 2011 and not changes to these conditions that took place between 2011 and 2013. TNP2K recognised that demographic, social, and economic conditions had changed for some poor and vulnerable households in Indonesia and developed an updating process (figure 14) to ensure that the BLSM beneficiary households selected aligned with reality in 2013. This updating process relied on community input through village meetings (musyawarah desa or musdes) and urban ward meetings (musyawarah kelurahan or muskel) , during
which participants worked to verify the lists sent to them by TNP2K.
4. More detailed description about the process of updating the list of BLT target households is found in the Handbook of Information Dissemination and Implementation of Compensation Programmes for the Fuel Subsidy Price Adjustment Policies in 2013.
Figure14. Social Protection Card (KPS) Beneficiary Updating Process
TEmPORARy UNCONDITIONAl CAsH TRANsFERs (Blsm)
The implementation of this updating process required an administrator at the subdistrict level; therefore, TNP2K and MoSA collaborated with subdistrict social welfare personnel (Tenaga Kesejahteraan Sosial Kecamatan or TKSK) to administer the updating process. To ensure that TKSK shared the same understanding of their duties and functions in data updating, TNP2K and MoSA distributed TKSK handbooks to all TKSK.
To ensure that MoSA obtained an accurate list of people who should receive BLSM, the Management Information Systems (MIS) team at the TNP2K Secretariat and PT Pos Indonesia together developed a system to revise the list of target households online (Replacements Summary Form System). They processed data from the
musdes/muskel on targeted households, organising them into those to remove
and those to add to the list. The data input process was conducted at the district/ municipality level by the Audit Office (Kantor Pemeriksa) of PT Pos Indonesia. In November 2013, towards the end of the updating process, 402,861 KPS were returned or withdrawn and 333,331 new KPS issued. Based on the data of those households that replaced the ones removed, MoSA carried out a process of ratification in order to print Replacement-KPS (KPS-Penggantian) so these new beneficiary households could access the BLSM and other social assistance programmes.
b. Coordination between Central and Local Governments
The implementation of the KPS data updating process and handling of public complaints involved government officials at the subdistrict and urban ward levels. To ensure a common understanding of the relevant duties and functions, TNP2K in cooperation with the Ministry of Home Affairs (Kementerian Dalam Negeri) drafted and issued the Minister of Home Affairs Instruction (Inmendagri) Number 541/3150/SJ of 2013 on the Management of Programme Issues of the Programme for the Acceleration and Expansion of Social Protection (Program Percepatan dan Perluasan Perlindungan
Sosial or P4S) and other special programmes. These instructions covered the duties
and responsibilities of local governments in implementing P4S and other special programmes and were sent by telegram to all provincial and district/municipality governments in Indonesia.
c. Dissemination of Information provision and public complaints
TNP2K collaborated with the Ministry of Home Affairs and UKP4 to provide multiple channels for public complaints. Channels for complaints now include the following:
• LAPOR! UKP4
Implementation of the programme to compensate for fuel price hikes included a complaint handling mechanism in the form of the LAPOR! (Layanan Aspirasi dan
Pengaduan Online Rakyat, which translates to Registering People’s Aspirations and
Service Complaints Online or REPORT!) web portal. This channel is an integrated web portal accessible by the public at www.lapor.ukp.go.id. In addition, individuals can also submit complaints by sending a short message service (SMS) to the telephone number 1708 using the following format:
[Number of KPS] [Complaint] (KPS beneficiary) or [KPS] [Complaint] (nonbeneficiary).
As the TNP2K Secretariat was assigned to manage the KPS, its primary task regarding KPS was to direct complaints or questions to the appropriate programme implementers. In managing the UDB, TNP2K handles requests related specifically to inclusion in social assistance programmes.
Between July 2013 and June 2014, 25,115 inquiries and complaints were received about BLSM. Of these 1,694 have been acknowledged, that is, answered or forwarded to MoSA, leaving 23,421 inquiries and complaints unanswered. Of those handled, 362 have been resolved (i.e. no further communication was received from the complainant two weeks after the complaint was responded to) and 1,327 have not been processed.
In addition to managing LAPOR!, the TNP2K Secretariat also established the KPS coordination centre. It is responsible for providing information and complaints services either by mail, phone, SMS, or through visits to communities by groups or individuals responsible for communicating with the public on the KPS, BLSM, and P4S.
Source: UKP4 dan TNP2K
TEmPORARy UNCONDITIONAl CAsH TRANsFERs (Blsm)
• Village/Urban Ward and Subdistrict Complaint Centres
Complaints can also be submitted at the village/urban ward and subdistrict levels (table 3). An advantage of direct complaints at the village/urban ward and subdistrict levels is that decisions can be quickly taken and solutions found by programme implementers at the community level, especially for complaints related to accessing benefits.
d. Community Representatives
Raising public awareness is critical to the successful implementation of government programmes. For the implementation of BLSM in 2013, TNP2K collaborated with aawareness strategy to reach various stakeholders. Appropriate media were determined based on the target audience and objectives of the dissemination.
• Designing and Distributing Materials to Raise Awareness
The Dissemination and Implementation handbook as well as the guidelines for Resolving Beneficiary Issues for the Social Protection Card were written and distributed to national and local governments to raise awareness about the fuel subsidy adjustment compensation programmes and help resolve issues on who may obtain a KPS. The KPS solution book guides local governments on updating the beneficiary lists through village and urban ward meetings. It also includes the Instruction of the Minister of Home Affairs Number 541/3150/SJ on the Distribution of Social Protection Cards and Public Complaints Handling Mechanisms.
Table 3. Village/Urban Ward and Subdistrict Complaint Centres
• Raising Awareness of kPS Beneficiary Households
KPS beneficiary households were given information on the purpose of the card and on how to take advantage of BLSM using the KPS. This information was delivered directly to households after BLSM had been formally incorporated into the revised 2013 Annual National Budget (Anggaran Pendapatan dan Belanja
Negara–Perubahan or APBN-Revision).
• Raising Awareness of Subdistrict Officials and Village and Urban Ward Officials
This effort had two main objectives: first, provide information on the KPS and how to use it to benefit from the P4S and BLSM programmes and, second, encourage the active participation of village officials in distributing the KPS, updating the beneficiary list, and establishing complaint centres at the subdistrict and village or urban ward levels. Public awareness materials have included KPS posters, a Circular Letter (Instruction) from the Minister of Home Affairs, as well as a cover letter from the Coordinating Ministry for Social Welfare.
• Raising Awareness of TkSk
This effort had two main objectives: first, to provide information on the KPS and its use to village and urban ward officials and, second, to provide information on the duties and responsibilities of the TKSK in the KPS beneficiary household updating process, as well as general information on the implementation of the P4S and BLSM programmes. The TKSK have worked collaboratively with officers at PT Pos Indonesia subdistricts, villages, and urban wards. The TKSK handbook was sent to all TKSK at the subdistrict level (figure 17).
Figure 16. The Handbook of Dissemination, Implementation and Resolving Beneficiary Issues with the Social Protection Card
TEmPORARy UNCONDITIONAl CAsH TRANsFERs (Blsm)
• Raising Public Awareness
This effort included general knowledge of the KPS and its eligibility benefits (Raskin, BSM, and BLSM). Information was shared through press conferences attended by more than 100 local and national media outlets, through public service announcements in print and electronic media, as well as through the placement of posters and banners at strategic locations to reach the general public. All this work was done in collaboration with ministries/agencies and local governments.
Figure 17. TKSK Handbook
NEXT STEPS FOR THE BLSM PROGRAMME
BLSM is a short-term instrument implemented to disburse funds quickly and simultaneously throughout Indonesia to counter economic shocks. As the time between the dissemination of information on compensation packages and the implementation of BLSM compensatory programmes tends to be short, efficient communication lines between central and local governments are a prerequisite to successful implementation. Therefore, central and local governments should evaluate the information distribution system (and the bureaucracy involved) and improve the effectiveness and efficiency of the distribution system.
Evaluations of BLT and BLSM implementation show continued weaknesses in the BLSM household beneficiary updating process; therefore, improvement in the design and implementation of the updating process is necessary.
CAsH TRANsFERs FOR POOR sTUDENTs (Bsm)
The Cash Transfers for Poor Students (Bantuan Siswa Miskin or BSM) programme provides cash assistance directly to primary, junior secondary, and senior secondary students from disadvantaged backgrounds. Schools under the supervision of the Ministry of Education and Culture (MoEC) and the Ministry of Religious Affairs (MoRA), such as primary, junior secondary, senior secondary, and vocational schools, including their Islamic school equivalents are covered by the BSM programme5.
The programme, which began in 20086, generally intends to:
a. Remove barriers so that poor students can continue their schooling by providing access to better educational services.
b. Reduce the number of dropouts and encourage school-aged children from both poor and vulnerable households to return to school.
c. Support the completion of the of Nine YearUniversal Basic Education Programme
(Program Wajib Belajar Pendidikan Dasar or Wajar Dikdas) potentially up to
university level.
5 These include, respectively, madrasah ibtidaiyah (MI), madrasah tsanawiyah (MT) and madrasah aliyah (MA).
6 The provision of assistance to poor students started at the time of the economic crisis in 1998 through the Social Safety Net for Education Programme (Program Jaringan Pengaman Sosial Bidang Pendidikan), which has since evolved into the BSM programme.
CAsH TRANsFERs FOR POOR sTUDENTs (Bsm)
The BSM programme also supports the government’s commitment to increasing enrolment rates, especially in poor and remote districts and municipalities. BSM is not referred to as a scholarship programme, in compliance with a Constitutional Court decision that scholarships are awarded based on merit and not socioeconomic status. BSM complements the School Operational Assistance (Bantuan Operasional Sekolah or BOS) programme, which is designed to ease the burden students face in paying for the operational costs of school.
2008–2012 IMPLEMENTATION CHALLENGES
Based on existing studies, TNP2K identified several challenges when implementing the BSM programme in 2008–12, including:
a. BSM Programme Target Beneficiaries
At the start of the BSM programme, beneficiaries comprised of students from poor households who were selected by schools. Figure 18 shows the inaccuracy of this targeting method: many BSM beneficiaries did not come from poor families/ households (inclusion error) and many students from poor families/households did not receive BSM benefits (exclusion error).
Figure 19 illustrates the process for targeting potential BSM beneficiaries:
a. BSM administrators at the central level (ministry) determine the maximum number of BSM beneficiaries in each district/municipality.
b. Based on this information, each district education office or district/municipality Figure 18. Evaluation of BSM Programme Targeting Accuracy
CAsH TRANsFERs FOR POOR sTUDENTs (Bsm)
MoRA office then distributes and assigns the maximum number of BSM beneficiaries at each school/madrasah.
c. Each school/madrasah then targets the BSM programme beneficiaries and sends this information to its district education office or district/municipality MoRA office.
d. After receiving these proposals from schools/madrasah, the district education office or district/municipality MoRA office reconfirms the total number of district/municipality-level BSM beneficiaries and submits it to the MoEC and MoRA.
e. MoEC and MoRA then produce a national total of BSM beneficiaries as set out in the Decree (Surat Keputusan) on Determining the National-Level BSM Programme Beneficiaries.
There are two drawbacks to this process.
• Determination of school/madrasah-level BSM student beneficiaries. Schools whose proposed lists of beneficiaries exceed the quota may have included students who do not necessarily qualify for BSM (inclusion error). Conversely, some schools submit the exact number of students allowed in the quota, which may mean that some poor students are left out (exclusion error).
• School-based targeting process. As school/madrasah principals, the school/ madrasah committee, and teachers identify which students are entitled to BSM programme benefits, the process can become subjective. Indicators used by schools to select students are not always clear and often difficult to monitor.
Figure 19. Process followed for BSM Targeting Process, 2008–12
Bsm Administrator (central level)
ministry determines ceiling/quota for regencies and cities
ministry receives regency and city recapitulation and makes a national recapitulation for schools that have Bsm beneficiaries.
The office makes a recapitulation of prospective Bsm beneficiaries and sends it to the ministry.
schools and madrasahs send the names of students according to the regency or city quota.
education office/ministry of religious affairs office receive quotas from
re-gencies and cities and then prepare school quotas
Bsm administrator (local government level)
schools
casH TransFers For poor sTUDenTs (Bsm)
b. Amount of BSM Programme Assistance Received by Students
An accurate amount of BSM assistance to cover educational costs not related to tuition is an important incentive for poor and vulnerable households to send their children to formal schooling. Until 2012, the value of BSM assistance had not been enough to cover non-tuition education expenses. A TNP2K Secretariat evaluation of results based on the 2009 Susenas showed that these benefits only covered about 30 to 40 percent of the total cost of education incurred by poor households (table 4).
c. Timeliness of BSM Disbursements
By providing BSM assistance at the beginning of each academic year, the government is better able to maintain enrolment levels among poor students as it provides them with the money necessary to graduate to the subsequent grade/class. Until 2012, BSM assistance was received by students periodically in March and September, while the disbursement of BSM assistance in June was minimal. The results of an evaluation conducted by TNP2K found that the critical periods for household finances are at the end of the school year in May/June and at the beginning of the school year in July, particularly when students transition from one education level to the next, such as primary to junior secondary school (or equivalent) and from junior secondary to senior secondary school (or the equivalent).
Table 4. Evaluation of the Accurate Amount of BSM Programme Assistance
Education Level
Value of BSM Benefits in 2012
(Rp per student per academic year)
910,000 1,390,000 1,660,000
Source: Susenas (2009)
CAsH TRANsFERs FOR POOR sTUDENTs (Bsm)
d. BSM Programme Beneficiary Coverage
The BSM programme intends to cover all children from poor and vulnerable households; however, table 5 shows that BSM coverage was very limited. For primary level and equivalent schooling, BSM could cover only half of all students from poor households. For junior and senior secondary or equivalent levels, BSM could cover only students from poor households, not vulnerable ones (table 5).
e. Lack of knowledge on How to Access the BSM Programme
Preliminary results from the implementation of the BSM programme in 2013, which was made available to compensate for fuel price hikes through the P4S and KPS, reveal that the take-up rate (KPS and BSM cards) for the BSM programme was under 10 percent. The cause of the low take-up rate was, among other things, that target households (Rumah Tangga Sasaran Penerima Manfaat or RTS-PM) did not know that they could use the KPS to access the BSM programme. In October 2013, TNP2K
Source: Susenas (2009)
Figure 20. Evaluation of the Likelihood of Continued Education by Expenditure Quintile
Table 5. BSM Beneficiaries Based on UDB and Magnitude of BSM Coverage, 2011
Source: UDB (2011) and BSM Implementation Guidelines (MoEC and MoRA 2011).
Total number of primary-level children (public and religious schools)
5,742,817 9,193,965 2,790,000
Total number of junior secondary–level children (public and religious schools)
1,692,658 2,936,195 1,598,212
Total number of senior secondary–level children (public, vocational, and religious schools)
648,190 1,239,834 706,124
PERSENTILE POOREST 10% POOREST 20% BSM COVERAGE (2011)
assessed the distribution of BSM and KPS cards in 2,088 households in eight provinces. The results of TNP2K’s monitoring efforts showed that 95.3 percent of households claimed to have received KPS/BSM cards and about 4.7 percent of households had not. Households that received KPS/BSM cards exhibited a take-up rate of 32.8 percent. This proved that target households were not properly informed about taking advantage of the BSM programme through KPS and that the dissemination of information to target households could be improved.
f. Complementarity with PkH
CAsH TRANsFERs FOR POOR sTUDENTs (Bsm)
However, complementarity between social assistance programmes for the education of poor students is still low. Data from the PKH recertification7 indicate that, of PKH
households that graduated from the programme, that is, former PKH beneficiaries no longer considered poor and/or did not meet the PKH beneficiary requirements, only about 27.4 percent received BSM. In contrast, for transitional households, that is, PKH beneficiaries considered to be poor and/or to have met PKH beneficiary requirements, only 31.12 percent received BSM benefits. This means that more than 65 percent of PKH households did not receive BSM in 20138.
POLICIES TO IMPROVE 2013 BSM PROGRAMME IMPLEMENTATION
Based on evaluations of the BSM programme before 2012, the TNP2K Secretariat supplied MoEC and MoRA—which operate the BSM programme—with recommendations for improving programme operations:
a. Ensure the continuation of education to higher grades, especially for students transitioning between educational levels, such as from primary to junior secondary school.
b. Ensure that the value of BSM benefits continues to increase, so the personal education needs of students from poor and vulnerable families can be better met.
The BSM programme is complex and has unique characteristics from a policy, technical, and administrative point of view. For example, the programme is implemented by several technical directorates in two separate ministries (MoEC and MoRA): the Elementary School Development Directorate, Junior High School Development Directorate, High School Development Directorate, Vocational School Education Directorate, Islamic School Education Directorate (for primary, junior secondary, and senior secondary levels). That is why the recommendations made by TNP2K to improve the operation of the BSM programme were implemented in several stages, as decided through an intensive advocacy process, technical workshops, and coordination (formal and informal) between TNP2K, MoEC, and MoRA since early 2012. The continuous advocacy and coordination efforts undertaken by TNP2K were integral in ensuring that both ministries possessed the same commitment and understanding, especially about the importance of improving targeting accuracy and accuracy on the amount and timeliness of distributions, so that
7 Re-collecting assessment data in order to appraise participation criteria and socioeconomic status of PKH beneficiaries as written into the 2007 PKH General Guidelines when the programme was launched.
8 The definition of transformation in PKH including recertification, graduation, and transition of CCT beneficiaries can be found in the chapter on PKH. CAsH TRANsFERs FOR
the following improvements could be implemented simultaneously at MoEC, MoRA, and TNP2K:
a. Improving Accuracy of Targeting BSM Programme Beneficiaries
TNP2K began by attempting to improve the accuracy of BSM beneficiary targeting. This involved two processes: first, use of individual information listed in the UDB, the data source for candidates of the BSM programme, and second, recommendations of eligible beneficiaries made at the school/Islamic school level to the central level.
CAsH TRANsFERs FOR POOR sTUDENTs (Bsm)
Improvements to the BSM programme were undertaken in several stages (figure 21). The first stage, in 2012, was designed to enable educational continuity for 281,909 students from poor families during periods of transition between primary and junior secondary levels (from grade 6 to grade 7 in the 2012/2013 academic year under MoEC). The BSM programme targeting method was modified from being school based to directly targeting poor students identified in the UDB.
The BSM programme also considered using other methods, such as poverty head count data, drop-out rates, and discontinuation rates in every district to determine the BSM programme beneficiary quota per district9. The results of the monitoring during
the first stage of BSM programme reform revealed several issues in implementation: from the late delivery of BSM cards to delays arising from the recapitulation process for BSM beneficiaries (from the school to the district level education offices and from the provincial to the ministerial level) or from geographic challenges and incomplete information on school-aged children in the UDB.
The Elementary and Junior High School Development Directorate and the Islamic School Education Directorate (MIs and MTs) in MoRA planned the second stage of reforms to the BSM programme for early 2013. The ministries planned to target 670,000 potential beneficiaries including 220,000 new students entering grade 1 and 450,000
Figure 21. Changes Recommended to Improve BSM Beneficiary Targeting Mechanism
Source: TNP2K CAsH TRANsFERs FOR