Characterizing the
Evolution of Social
Computing Research
Tao Wang, Zhong Liu, and Baoxin Xiu, National University of Defense Technology
Hong Mo, Changsha University of Science and Technology
Qingpeng Zhang, City University of Hong Kong
An analysis of the
characteristics of
social computing
research looks
at both static
and dynamic
perspectives. The
article characterizes
the key features
and the evolution
of social computing
from a quantitative
perspective.
wasn’t possible in the past,4,5 such as com-putational organization6 and sentiment analysis. Based on these improvements, so-cial computing1 has garnered more and more attention from researchers across mul-tiple domains.
We can analyze social computing from both qualitative and quantitative perspec-tives. Qualitative work mainly focuses on the application areas such as virtual com-munities and social media dimensions. Quantitative research focuses on collabo-ration networks or simple statistics dimen-sions. See the “Related Work” sidebar for a discussion on past surveys.
However, the qualitative description hardly shows the development accurately; and the statistics studies fail to consider the structural. Collaboration network analy-sis generally finds it difficult to show the research content because it only focuses on institutions or persons. Bibliometric analy-sis7 is an effective quantification method to
examine the situation of a research field, involving analysis from the statistical and social network dimension of scientific pub-lications, such as historiographical map-ping,8 document9 or author cocitation,10 co-word analysis,11 and journal mapping.12 Here, we characterize the footprint of social computing development from two quantita-tive, bibliometrical dimensions: statistics and topology.
Data Collection and Methodologies
In this section, we first introduced our data collection in detail, and then present our methods.
Data Collection
We identified a set of terms about so-cial computing from two sources: the top-ics of the IEEE International Conference on Social Computing (SocialCom) as of 2011 (see http://asesite.com/conferences/
W
eb 2.0 technology and its versatile applications, such as social
net-working sites and personalized recommender systems, have changed
our daily life profoundly.
1–3New and stronger computational infrastructures
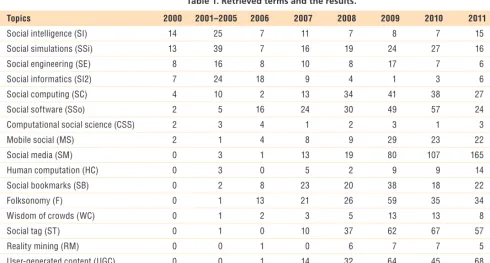
socialcom/2011) and the description of social computing from Wikipedia (see http://en.wikipedia.org/wiki/ Social_ computing). SocialCom provided 16 topics in three years. We extracted the keywords from Wikipedia and the most cited paper with “social comput-ing”1 in the title for each topic. Af-ter excluding universal Af-terms such as “data mining,” “Web 2.0,” and so on, and with the help of Fei-Yue Wang (the author of a widely cited review of social computing1), we identified 17 keywords to depict social computing research. We then retrieved these terms in two citation databases (the Science Citation Index Expanded and the Con-ference Proceedings Citation Index— Science) as of 2011, in which the term “social computing” appeared first in 1995.13 Table 1 shows the results.
After excluding duplicate items, we identified 2,079 items, including 1,518 proceedings papers. It should be noted that we didn’t cover all the publica-tions on social computing, even though the Science Citation Index Expanded database and Conference Proceedings Citation Index—Science database in-dexed the majority of papers.
Methodologies
We adopted statistics and co-word network analysis in this research. We treated overlapping content as a static characteristic to measure the proxim-ity14 between terms as we computed it in the whole dataset; while we used ThemeRiver15 visualized and the co-words network to show the dynamic characters.
We used content that overlapped be-tween records to show the static state of social computing. One paper of-ten had more than one keyword. We assume that if two papers share the same keywords, they share the same content to certain degree.14 If all the keywords are the same between two papers, the topic largely overlaps. For
example, the words in the records re-trieved by “social computing” (169 records with 521 keywords) share 41 of the same words with the records re-trieved by “computational social sci-ence” (19 records with 78 keywords). Hence, “computational social science” records overlapped “social comput-ing” records by 53 percent (41 of 78 keywords); while the “social comput-ing” records only overlapped “com-putational social science” records by 8 percent (41 of 521 keywords). This is similar to friendships in some sense. For example, Peter and Jack have 10 common friends. Peter has 100 friends, while Jack just has 20; there-fore, the 10 common friends are more important for Jack than Peter.
We make a ThemeRiver visualiza-tion for each term to show the trend of social computing research. The ThemeRiver visualization depicts the-matic variations in the context of a timeline.15 It uses a river metaphor to
convey several key notions, for exam-ple, the width of river represents the amount of content about the theme. Compared with the original Theme-River,15 we considered the relative ra-tio clearer in each time slice. We use a river metaphor to show keyword changes year by year, in which the length of the river is the timeline, and the width of the river represents its rel-ative amount. The combined width of all rivers is 100 percent. This exhibits the growth of each subfield relatively in each period.
We use co-word analysis11 and net-work topology16 for constructing the content map, which represents by the keywords of each paper. We first analyzed the topology proprieties of a co-word network at different time points. Then, we identified the theme transmission trend. Unlike common co-word analysis,17 we tried to iden-tify the evolution of social comput-ing at different time snapshots. We
S
ome surveys about social computing have been conducted from both qualitative and quantitative perspectives. Qualitative works mainly fo-cus on the application areas such as virtual communities and social me-dia dimensions.1 Quantitative research focus on collaboration networks2 orsimple statistics dimensions.3–6 Corina Pascu presented a systematic
empiri-cal assessment of the creation, use and adoption of specific social computing application areas.5 Yanxiang Xu and his colleagues analyzed the 187 papers
published at the 2009 IEEE International Conference on Social Computing and presented one benchmark to measure the maturing level of a social comput-ing research.6 Xiaochen Li and his colleagues summarized modeling methods
in social computing.4
References
1. M. Parameswaran and A.B. Whinston, “Research Issues in Social Computing,” J. Assoc. Information Systems, vol. 8, no. 6, 2007, pp. 336–350.
2. T. Wang et al., “On Social Computing Research Collaboration Patterns: A Social Net-work Perspective,” Frontiers of Computer Science in China, vol. 6, no. 1, 2012, pp. 122–130.
3. I. King, J. Li, and K.T. Chan, “A Brief Survey of Computational Approaches in Social Computing,” Proc. Int’l Joint Conf. Neural Networks, 2009, pp. 2699–2706. 4. X.C. Li et al., “Agent-Based Social Simulation and Modeling in Social Computing,”
Proc. Intelligence and Security Informatics, C.C. Yang et al., eds., 2008, pp. 401–412.
5. C. Pascu, An Empirical Analysis of the Creation, Use and Adoption of Social Comput-ing Applications, tech. report, Inst. for Prospective Technological Studies, 2008, pp. 1–92.
C O - W O R D A N A L Y S I S
concisely analyzed the trends and characters of each time snapshot.
Result 1: Static Characteristics
Figure 1 shows the static aspect of social computing research. We visualized the contents overlapping in the social-computing field based on the methods proposed in the “Meth-odologies” subsection. The x-axis rep-resents overlapping rate (OR). One unit describes the relationship be-tween one term and the other terms, in which the different terms can be identified by their color. For each term, bars on the left represent that they’re covered by other content, while bars on the opposite side rep-resent that they cover other content. The lengths of these bars indicate how critical the terms are. The terms are tagged with the number on the head of the bars (the length of left bars are noted as a minus to make a distinction between the two parts).
It’s evident from Figure 1 that a term overlapping itself entirely, that
is, the OR is 100 percent, are repre-sented as the longest bar. Taken as a whole, the average overlapping rate is 33 percent, which means that there is one-third overlapping content be-tween each two results retrieved by two different terms on average. This phenomenon shows that all the terms are members of one fam-ily in some sense. The different re-search items discuss the same theme and share the same topics to some extent. As the histogram shows, so-cial media is cruso-cial for almost ev-ery term (average OR reached 54 percent, minimum OR is 41 percent, and maximum OR is 66 percent). Compared with ThemeRiver (see Fig-ure 2), we find that although the “so-cial media” river is becoming wider and wider, almost half of the studies shared the same theme with all the other keywords.
Result 2: Dynamic Characteristics
Here, we further consider the ele-ments of the ThemeRiver, along
with the co-word network that we constructed.
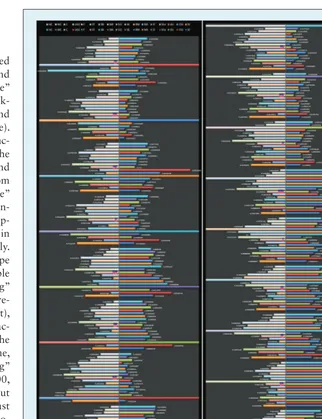
ThemeRiver
We constructed the ThemeRiver for 17 terms in Table 1, and Figure 2 used the river metaphor to show keywords change over the years. In these rivers, we can easily find the relative increas-ing or decreasincreas-ing trends of each term during these years. “Social simula-tion,” “social engineering,” “social in-formatics,” and “social intelligence,” emerged at the beginning—that is, before 2000. Hereafter, “social sim-ulation” received more attention. After 2005, almost all of the terms appeared.
The growth patterns were easier to find on the shapes of the ThemeR-iver. First, the rugby-shaped river increased step by step and then de-creased little by little. “Social infor-matics” is the typical case of this type, appearing in 1996 (only one record), then increasing from two (in 1998) to 18 (in 2006). After that, the term de-creased to one in 2009. The second
Table 1. Retrieved terms and the results.
Topics 2000 2001–2005 2006 2007 2008 2009 2010 2011 Total
Social intelligence (SI) 14 25 7 11 7 8 7 15 94
Social simulations (SSi) 13 39 7 16 19 24 27 16 161
Social engineering (SE) 8 16 8 10 8 17 7 6 80
Social informatics (SI2) 7 24 18 9 4 1 3 6 72
Social computing (SC) 4 10 2 13 34 41 38 27 169
Social software (SSo) 2 5 16 24 30 49 57 24 207
Computational social science (CSS) 2 3 4 1 2 3 1 3 19
Mobile social (MS) 2 1 4 8 9 29 23 22 98
Social media (SM) 0 3 1 13 19 80 107 165 388
Human computation (HC) 0 3 0 5 2 9 9 14 42
Social bookmarks (SB) 0 2 8 23 20 38 18 22 131
Folksonomy (F) 0 1 13 21 26 59 35 34 189
Wisdom of crowds (WC) 0 1 2 3 5 13 13 8 45
Social tag (ST) 0 1 0 10 37 62 67 57 234
Reality mining (RM) 0 0 1 0 6 7 7 5 26
User-generated content (UGC) 0 0 1 14 32 64 45 68 224
Crowdsourcing (CS) 0 0 0 0 4 20 35 54 113
Total 52 134 92 181 264 524 499 546 2292
(9 percent on average), “social book-mark” (6 percent on average), and “social tag” (10 percent on average). These terms have no dramatic fluc-tuation from beginning to end. The shrunk river is the third typical trend in Figure 2. “Social simulation” (from 25 to 3 percent), “social intelligence” (from 27 to 3 percent), and “social en-gineering” (from 15 to 1 percent) rep-resent this term type, which grew in the first period, then declined steadily. Mountain climbing is the fourth type of river, which increases in a stable way. For example, “crowdsourcing” first emerged in 2008 (with four re-cords, which account for 1 percent), then it increased to 54 records (ac-counting for 10 percent in 2011). The fifth river type is a fluctuating one, which includes “social computing” (8 percent of papers before 2000, few between 2000 and 2005, but bounced back after 2007). The last type of river is the soaring one. “So-cial media” is the best example—this river boomed from 13 in 2007 to 80 in 2009, and increased markedly even after 2009 (107 in 2010 and 165 in 2011).
Several research trends can be ob-served from the rivers. For example, “social engineering” appeared be-fore 2000. It flourished at an early stage, while it declined later as the focus shifted from research to appli-cations, such as homeland security, personal privacy, and so on.18 The most obvious trend observed is that social media played an increasingly critical role in the social computing field. The most important reason is that social media connected individu-als together,19 which is the core of so-cial computing in some sense1—that is, the people connected could mir-ror the real society. The content the
people created and shared provided rich content for social computing studies. In these studies, social media is mainly treated as a social sensor to detect the information, opinions, and sentiments.20
Network Evolution
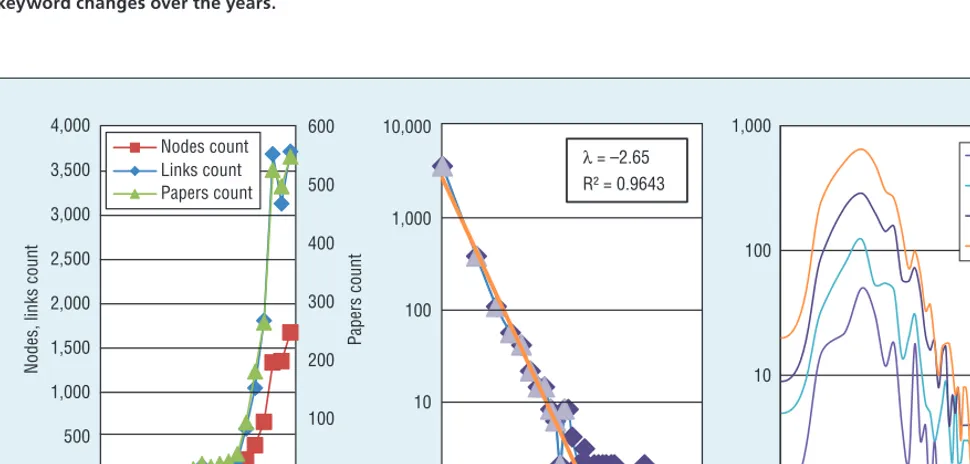
We constructed a co-word network21 with 3,542 distinctive keywords, which we extracted from the 2,079 items, to analyze the dynamic aspects of social computing research. The number of keywords increased year
by year (see Figure 3a), while isolated keywords increased more slowly than connected keywords (from 0 to 324 in 22 years). Few nodes connected together at an early stage, while the giant component of this network cov-ered 90.2 percent of the keywords (3,195/3,542), and they were con-nected by 12,936 links at last. We tagged the node’s time by the year it first appeared, while the links both have the node pair’s appearance time. We treated the same node pairs linked at different time as different links.
C O - W O R D A N A L Y S I S
Besides the data shown in Figures 3a and 3b, we analyzed the network to-pology information based on the giant component, not the whole network.
Figure 3a shows the papers, nodes, and links count year by year. We clearly see that links are actually in proportion to papers. Links can grow faster than
nodes and can be more easily affected than node count. The average links nodes ratio is four (12,936/3,195), which means that each new keyword
Figure 3. The co-word network. (a) Paper, node, and link counts, (b) keywords frequency distribution, and (c) keywords degree distribution.
0 100 200 300 400 500 600
0 500
1,000 1,500 2,000 2,500 3,000 3,500 4,000
1990 1992 1994 1996 1998 2000 2002 2004 2006 2008 2010
Papers count
Nodes, links count
Nodes count Links count Papers count
λ = –2.65
R² = 0.9643
1 10 100 1,000 10,000
1 10 100 1
10 100 1,000
1 10 100
2005 2007
2009 2011
(a) (b) (c)
Figure 2. The ThemeRiver. We constructed the ThemeRiver for the 17 terms shown in Table 1, using a river metaphor to show keyword changes over the years.
0% 10% 20% 30% 40% 50% 60% 70% 80% 90% 100%
2000 2005 2006 2007 2008 2009 2010 2011
Crowdsourcing (CS) User-generated content (UGC) Reality mining (RM) Social tag (ST) Wisdom of crowds (WC) Folksonomy (F) Social bookmark (SB) Human computation (HC) Social media (SM) Mobile social (MS)
Computational social science (CSS) Social software (SSo)
appearance would bring four links to the co-word network on average. Each paper often provides three or more keywords for indexing.
Figure 3b shows the log-log plot of the frequency distribution of keywords. The x-axis is the frequency and the y -axis is the keyword count, which ap-peared with the same frequency. This distribution followed power-law ap-proximately22 with a long tail. More than 80 percent of keywords appeared just once (2,933 in 3,542 keywords). While the other 609 keywords appeared
more than twice (3,220 times) appeared more than half the time, they occupied less than 20 percent, with the term “so-cial media” (136 times) and “Web 2.0” (124 times) being the most frequently occurring units.
Figure 3c shows the log-log plot of the keyword node degree distribution at four time snapshots in 2005, 2007, 2009, and 2011, respectively. For the giant component of the co-word net-work, the nodes with degree 4 played a critical role in the network. We can see that the amount of nodes with
degree less than 4 climbed quickly, while the amount of other nodes with degree more than 4 descended with a long tail. That means the keywords often appeared with three other key-words. Few keywords just appeared with one fixed keyword; while key-words appearing with more than 100 different keywords existed as well. These keywords played the core roles.
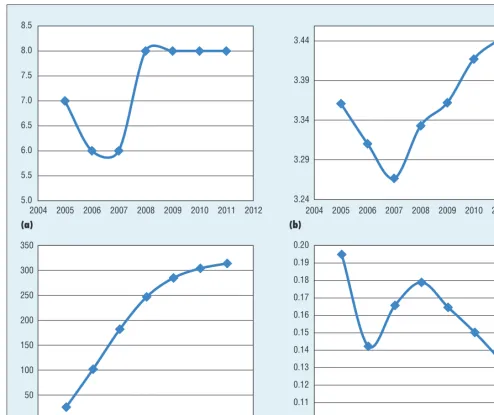
We can use network topology pro-prieties to identify the trends about the situation of research.16 Figures 4a through 4d shows four network
Figure 4. The topology properties of the co-words network in different time snapshots: (a) diameter, (b) average shortest path length, (c) number of multiedge node pairs, and (c) centralization.
5.0 5.5 6.0 6.5 7.0 7.5
2004 2005 2006 2007 2008 2009 2010 2011 2012
3.24 3.29 3.34 3.39
2004 2005 2006 2007 2008 2009 2010 2011 2012
0 50 100 150 200 250 300 350
2004 2005 2006 2007 2008 2009 2010 2011 2012
0.10 0.11 0.12 0.13 0.14 0.15 0.16 0.17 0.18 0.19 0.20
2004 2005 2006 2007 2008 2009 2010 2011 2012
(a) (b)
C O - W O R D A N A L Y S I S
topology properties from a node per-spective in different time snapshots. We can identify three characteris-tics about social computing research based on the following four topology propriety evolutions.
First, we observe a small world ef-fect, which further confirmed the pre-vious result of Xiaoguang Wang and his colleagues.21 The average shortest path length23 for all connected node pairs in the network is 3.443, with a diameter D of 8.23 Both numbers are small compared to the total number of nodes in the network (3,195). In addi-tion, the average clustering coefficient of the network is 0.89, indicating that the keywords tend to form closed trip-lets. Almost every paper has more than 3 keywords, which could form one cluster. These observations have shown that the social computing co-words net-work possesses the small world prop-erty, even though the average shortest path length increased little by little after 2007 from 3.27 to 3.44 (see Figure 4b). Second, the turning point of the so-cial computing field seems to have hap-pened in 2008, which we can draw from the diameter (see Figure 4a),
average shortest path length (see Fig-ure 4b), and centralizations24 (see Fig-ure 4d) of the co-word network.
Last, decentralization is another trend of the social computing research, even though the situation is on the op-posite side between 2006 and 2008. More topics appeared after 2008, and the social computing field evolved more and more subdomains, which could be shown from the centralization chang-ing trend in Figure 4d—ascended from 0.142 in 2006 to 0.179 in 2008 and then descended to 0.134 in 2011—and the number of multi-edge node pairs in Figure 4c. The increasing rate of multi-edge node pairs slowing down illus-trates that the new keywords preferred to connect to old keywords tradition-ally instead of connecting old keywords together, especially after 2008. These observations might indicate that the topics of social computing have been expanding after 2008, with the differ-ent topics providing differdiffer-ent keywords to form new research domains.
In addition to the topology from a node perspective, link types could reflect the changes as well. Two link types could be identified in our
co-word network. Some links con-nected the keywords with the same time tags, which means that they first appeared in the same year; while other links connected the keywords with different time tags, which indicates that one of them appeared before and they didn’t appear in the same paper at an earlier time. We focused more on the second type of links and treated the co-word network as directed.
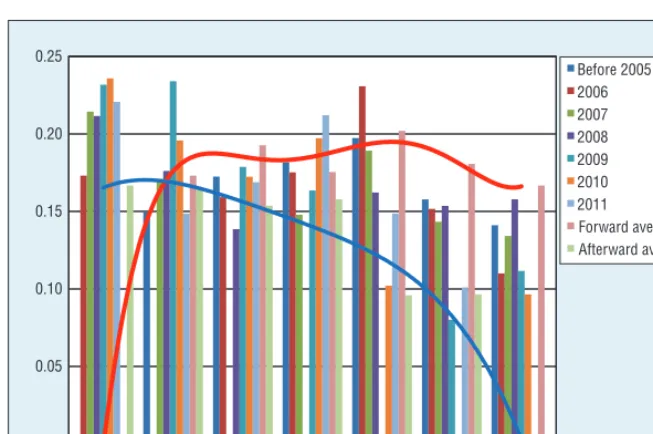
Figure 5 plots the network evolution from a link perspective in different time points. We treated keywords ap-pearing before 2006 as a monolithic group. While we treated each year af-ter 2006 as one time point based on the distribution of links. We mea-sured the transmission by the links amount normalized ratio between dif-ferent time points, which we plotted on the y-axis. The content at one time point might share some keywords that appeared previously (input links), and be shared with the new keywords appearing at a later time point (output links). The red line in the figure shows the approximate trend of the average forward links transmission, while the blue line represents the average after-ward links transmission.
We can explain this from different perspectives. One possible explana-tion is the memory effect of the pa-pers, which is similar to a co-citation network.22 The almost stable aver-age forward links suggested that the forward memory (the keywords re-membered others keywords) is stable in some sense, while the afterward memory (the keywords remembered by others keywords) were descending, which was indicated by a trend of av-erage afterward links. Another poten-tial explanation could be made from transmission insight. If the links from one node to the other node in the co-word network mean that the two nodes transmitted something, then we can treat this phenomenon as theme
Figure 5. The links between different time points. We treated keywords appearing before 2006 as monolithic, while we treated each year after 2006 as one time point based on the distribution of links.
0
Before 2005 2006 2007 2008 2009 2010 2011
transmission. The descending trend of average afterward transmission in-dicated that the earlier theme trans-mitted more than the later period, especially for the themes appearing before 2005. This means that most themes at later periods left less value than the content at earlier periods on average, even though the number of papers published increased. Most pa-pers might just follow some popular topics and share the keywords, while the main themes don’t reflect the issue.
I
n this article, we analyzed the static and dynamic aspects of so-cial computing research. Overlapping content indicated that subfields of so-cial computing often share the same topics, even though they have many different terms. There are several as-pects of this research future study could enhance. First, as our biblio-graphical data is retrieved by terms, we might have missed some records that don’t share terms which we used. Retrieving the publications with cited and citing patterns might be a better approach to get more precise records. Second, we took the same weight of all papers, while the importance of each paper is not the same in some senses. Constructing weighted net-works would be a promising direc-tion to improve our research.Acknowledgments
We thank Fei-Yue Wang and Xiaolong Zheng for their guidance and advice in this research. This work is supported in part by Hunan Provincial Innovation Founda-tion for Postgraduate, and by the NaFounda-tional Natural Science Foundation of China under grants 70771109 and 61074903.
References
1. F.Y. Wang et al., “Social Computing: From Social Informatics to Social Intel-ligence,” IEEE Intelligent Systems, vol. 22, no. 2, 2007, pp. 79–83.
2. W. Fei-Yue, “Study on Cyber-Enabled Social Movement Organizations Based on Social Computing and Parallel Systems,” J. Univ. Shanghai for Science and Technology, vol. 1, 2011; http:// en.cnki.com.cn/Article_en/CJFDTO-TAL-HDGY201101003.htm. 3. W. Fei-Yue et al., “A Study of the
Human Flesh Search Engine: Crowd-Powered Expansion of Online Knowl-edge,” Computer, vol. 43, no. 8, 2010, pp. 45–53.
4. S. Bankes, R. Lempert, and S. Popper, “Making Computational Social Science Effective—Epistemology, Methodol-ogy, and TechnolMethodol-ogy,” Social Science Computer Rev., vol. 20, no. 4, 2002, pp. 377–388.
5. D. Lazer et al., “Life in the Network: The Coming Age of Computational Social Science,” Science, vol. 323, no. 5915, 2009, pp. 721–723.
6. L. Zhong and Y. Dongsheng, “Cyber-Physical-Social Systems for Command and Control,” IEEE Intelligent Sys-tems, vol. 26, no. 4, 2011, pp. 92–96. 7. Q. Zhang et al., “25 Years of
Collabo-rations in IEEE Intelligent Systems,”
IEEE Intelligent Systems, vol. 25, no. 6, 2010, pp. 67–75.
8. E. Garfield, “Historiographic Mapping of Knowledge Domains Literature,” J. Information Science, vol. 30, no. 2, 2004, p. 119.
9. H. Small, “Cocitation in the Scientific Literature: A New Measure of the Rela-tionship between Two Documents,” J. Am. Soc. for Information Science, vol. 24, no. 4, 1973, pp. 265–269.
10. H.D. White and K.W. McCain, “Visual-izing A Discipline: An Author Co-Ci-tation Analysis of Information Science, 1972-1995,” J. Am. Soc. for informa-tion Science, vol. 49, no. 4, 1998, pp. 327–355.
11. M. Callon et al., “From Translations to Problematic Networks: An Introduction to Co-Word Analysis,” Social Science In-formation, vol. 22, no. 2, 1983, p. 191. 12. R.J.W. Tijssen and T.N. Van Leeuwen,
“On Generalising Scientometric Journal Mapping Beyond ISI’s Journal and Cita-tion Databases,” Scientometrics, vol. 33, no. 1, 1995, pp. 93–116.
13. H.R. Hansen, “Conceptual-Framework and Guidelines for the Implementation the National University of Defense Technology, Changsha, China. He’s a visiting student in the State Key Laboratory of Management and Control for Complex Systems at the Chinese Academy of Sciences. His research interests include social computing, social network analy-sis, and cyber-enabled social movement organization. Wang has an MS in engineering from the National University of Defense Technology. Contact him at [email protected].
Zhong Liu is a professor at the National University of Defense Technology. His research interests include information management and decision-making support technology. Liu has a PhD in engineering from the National University of Defense Technology. Contact him at [email protected].
Baoxin Xiu is an associate professor in Information Systems Engineering Laboratory at the National University of Defense Technology. His research interests include granular computing, and computational and mathematical organization theory. Xiu has a PhD in management science and engineering from the National University of Defense Technol-ogy. Contact him at [email protected].
Hong Mo is an associate professor at the School of Electric and Information Engineering, Changsha University of Science and Technology. Her research interests include linguistic dynamic systems and intelligence computing. Mo has a PhD in engineering from the Grad-uate University of China Academy of Sciences. Contact her at [email protected].
C O - W O R D A N A L Y S I S
of Mass Information-Systems,” Infor-mation & Management, vol. 28, no. 2, 1995, pp. 125–142.
14. J. Law and J. Whittaker, “Mapping Acidification Research: A Test of the Co-Word Method,” Scientometrics, vol. 23, no. 3, 1992, pp. 417–461.
15. S. Havre et al., “ThemeRiver: Visu-alizing Thematic Changes in Large Document Collections,” IEEE Trans. Visualization and Computer Graphics, vol. 8, no. 1, 2002, pp. 9–20.
16. N. Shibata et al., “Detecting Emerging Research Fronts Based on Topologi-cal Measures in Citation Networks of Scientific Publications,” Technovation, vol. 28, no. 11, 2008, pp. 758–775. 17. G.A. Ronda-Pupo and L.Á.
Guerras-Martin, “Dynamics of the Evolution of
the Strategy Concept 1962–2008: A Co-Word Analysis,” Strategic Management J., vol. 33, no. 2, 2012, pp. 162–188. 18. L.A. Cutillo, R. Molva, and T. Strufe,
“Safebook: A Privacy-Preserving Online Social Network Leveraging on Real-Life Trust,” IEEE Comm., vol. 47, no. 12, 2009, pp. 94–101.
19. T. Ahlqvist, Social Media Roadmaps: Exploring the Futures Triggered by Social Media, VTT, 2008.
20. N. Savage, “Twitter as Medium and Message,” Comm. ACM, vol. 54, no. 3, 2011, pp. 18–20.
21. X. Wang et al., “The ‘Small-World’ Characteristic of Author Co-Words Net-work,” Proc. Int’l Conf. Wireless Com-munications, Networking, and Mobile Computing, 2007, pp. 3717–3720.
22. S. Redner, “How Popular is Your Pa-per? An Empirical Study of the Citation Distribution,” The European Physical J. B-Condensed Matter and Complex Sys-tems, vol. 4, no. 2, 1998, pp. 131–134. 23. D.J. Watts and S.H. Strogatz,
“Col-lective Dynamics of ‘Small-World’ Networks,” Nature, vol. 393, no. 6684, 1998, pp. 440–442.
24. J. Dong, and S. Horvath, “Understand-ing Network Concepts in Modules,” BMC Systems Biology, vol. 1, no. 1, 2007; doi:10.1186/1752-0509-1-24.
Selected CS articles and columns are also available for free at http://ComputingNow.computer.org.
A plaque and $2,000 honorarium is presented in recognition of outstanding skills and dedication to diplomacy, team facilitation, and joint achievement in the development or promotion of standards in the computer industry where individual aspirations, corporate competition, and organizational rivalry could otherwise be counter to the benefi t of society.
NOMINATE A COLLEAGUE FOR THIS AWARD!
DUE: 15 OCTOBER 2014 PAST RECIPIENT: ANNETTE D. REILLY
• Requires 3 endorsements.
• Self-nominations are not accepted.
• Do not need IEEE or IEEE Computer Society membership to apply.
“For harmonization and development of novel approaches to the system and software engineering standards for vocabulary, life-cycle information, and user documentation.”
CALL FOR STANDARDS AWARD NOMINATIONS
IEEE COMPUTER SOCIE T Y HANS K ARLSSON STANDARDS AWARD