The Design of Integrated Tapioca Agro-Industries
Development Model
Azmi Alvian Gabriel, Susinggih Wijana, Sri Kumalaningsih
Agro-industries Technology Department, Faculty of Agriculture Technology, Brawijaya University
Abstract
Tapioca is an agro-industries product with high consumption level that reached 1.132 million tons per year. However, that potential was not balanced with the productivity levels of tapioca industries due to weak capacity and production period. This research aims to design the development model of tapioca agro-industries which can produce in a sustainable way in terms of quality as well as quantity of product. Study of research location was in the Kaur Regency of Bengkulu Province. This research consists of three stages. The first study was conducted to know the projection of the raw materials availability and product demand using regression and quadratic equation smallest method. The result of calculation projections showed the availability of raw cassava achieved an average of 10 million tons per year and the demand for tapioca 1.36 million tons per year. The second study was done to determine the partnership patterns between company and farmers using pairwise comparison and rating scale methods. From the results of the research note that "Inti-plasma" was the most efficient partnership patterns applied to tapioca agro-industries. The third study was conducted to determine the feasibility of the planned development model. The calculation result of feasibility analysis show the value of benefit cost ratio of 1.23; payback period amounted to 1 year 2 months; net present value of IDR 143,285,734,440.98; internal rate of return 43.55%; and the profitability index 3.56. Based on the overall feasibility criteria, then the model development of tapioca agro-industries can be said to deserve to be realized.
Keywords: agro-industries, financial analyses, factory design, partnership patterns
INTRODUCTION 1
Indonesia was became the second largest cassava producer country in the Asia-Pacific [10]. By 2012, the Indonesia cassava production reached 24 million tons with a production areal amounted to 1.129.688 acres [2]. Until now, cassava was became an agricultural product which has the second largest productivity after rice [2][14]. Tapioca industry was one kind of agro-industries which using cassava as a raw material. This industriy have a great development potential in Indonesia, based on the quantity of raw material which is quite abundant as well as the high level of market demand for the product.
Indonesia has always imported tapioca products and its derivatives to fullfill the needs of industries in the country. It recorded a total reached 757 thousand tonnes and imports of manioc or cassava chips that reaches 13 thousand tons in 2012. Indonesia has also noted the import 74,24 thousand tons of dextrin, 348,93 tons of mannitol and 2.06 thousand tons of sorbitol, mainly from Japan [2]. The high
1
Coressponding Address: Azmi Alvian Gabriel
Email : [email protected]
Address : Jl. Sumbersari Gg. IV 268 C, Lowokwaru, Malang, 65145
number of import was because the weak of tapioca production as well as the low capacity and quality of the cassava processing into tapioca [16]. It was also supported by weak government policy in supporting the creation of synergy between agriculture and agro-industries, thereby impacting on the slow pace of development of industry of tapioca [1].
In 2010, the ministry of industry noted that there are 146 units of large and moderate tapioca processing industry in Indonesia. Indonesia tapioca production was reached average 897 thousand tons per year during 2007-2011. However, the tapioca production was only able to meet the needs of some areas, including Surabaya, Bogor, Indramayu and Tasikmalaya [9][12]. Another problem that arose in the tapioca industry was the availability of fresh cassava that exists only periodic. This situation occurs because the cassava optimal harvest only experienced a relatively short which is about 4 months [3][5]. Based on the research conducted by Balitkabi (2012), cassava provides optimum crop yields when harvesting is done since the plant was 8 to 12 months.
resources to solve these problems, so that the factory can remain productive. Sliced dried cassavas processing into the tapioca is one of the alternatives that can be made by the management to solve these problems. Sliced dried cassava was processed cassava which is obtained by means of drying using either sunlight or dryers. This product is typically used as a raw material for animal feed, foodstuffs, alcohol production and others.
The availability of dried slice cassava in the country can be seen from the export numbers that reach 39.643 tons [2]. It shows that sliced dried cassava have great potential in supporting the sustainability production of tapioca industry. In other way, this utilization can also increase the selling and using value of sliced dried cassava. Noviani, et al. (2006) and Wijana, et al. (2006) states that the sliced dried cassava deserve to be used as the raw material substitution of cassava because it can prolong the production period as well as increasing the production capacity of tapioca industry.
Increasing capacity of tapioca production requires a guarantees the availability of cassava and sliced dried cassava as a raw material. The companies can get around these problems by applying a partnership system with cassava farmers. Partnerships are built to be able give an advantage on both the company and the farmers. Therefore, it required the proper partnership pattern between companies and farmers in ensuring the availability of raw material.
The magnitude of market demand and various positively impacts posed by tapioca industry require a feasibility study which deals with the development model of integrated tapioca agro-industries. This study expected to be created the development of integrated agro-industries from upstream to downstream in an effort to improve the product quality by utilizing local resources and reduce dependence on imported products, so as to help meet the needs of domestic industries.
RESEARCH METHOD Type of Research
This research was a qualitative and quantitative approach. A descriptive analysis was done in terms of production process, patterns of partnerships, segmentation, targeting and positioning markets, competition and marketing strategies. Quantitative research is conducted to obtain the availability projection of raw materials
and product demand, as well as financial aspects calculation of the investment project value, income value, feasibility criteria, and sensitivity analysis.
Limit Problem
Some of the assumptions used in this study, included:
a. Fresh cassava raw is used for 4 months and sliced dried cassava raw is used for 8 months of production beyond the fresh harvest period.
b. The quality of raw material is stable.
c. Cash flows recorded for the project during the 20 year period of operation.
d. The cost and financial feasibility only applied on the present calculation.
e. The effective interest rates 11%.
f. Study locations were in Kaur Regency of Bengkulu Province.
Methods
a. The Availability Projection of Raw Materials and Product Demand
The availability level of the raw materials needed have to determine for the production capacity. It can be obtained by calculating the projected availability based on Kaur Regency raw material production historical data from Indonesia Central Bureau of Statistic. The projections calculation of the raw material availability was done using the regression equation as follows:
The production capacity was determined based on the projections of future tapioca demand assumptions. Total production per year was assumed to be a 3.5% out of a total projected need of tapioca in the future. The need of the tapioca was assumed to be derived from market demand within the country and abroad. The country needs projections calculated using regression method based on a comparison of the tapioca consumption level, by the following formula:
{ ( )
⁄
}
Whereas the calculation of the abroad projection needs was calculated using least squares method based on the tapioca export historical data. The formula used is as follows:
b. The Efficiency of Cassava Farmers Partnership Patterns
Data collection using the questionnaire is used to determine the appropriate partnership pattern between farmers and tapioca industry. The questionnaire was assessed by 4 experts. The
assessment was conducted covering “weighting variable assessment” and scoring on each
variable of partnership pattern.
Weighting variable assessment using pairwise comparison method
Weighting was done by pairwise comparison method. The weighting assessment was done by comparing each factor that affect the determination of industrial partnership pattern. In determining the weight of each variable was used a scale value of 1 to 3.
Variable scoring of partnership pattern using rating scale method
Scoring was done by rating scale method. The assessment score given to variables that have a conformity level in each partnership pattern using a scale value of 1 to 5.
c. The Tapioca Industrial Designs
The financial analysis was the final stage of tapioca industry design, so it can be inferred about the feasibility of development integrated tapioca factory to be realized. Financial analysis includes the following:
Capital investment
Calculation of the total capital Investment was carried out using Guthrie method, according to the following equation:
( )
Where: CSite = 0,15 CTBM;
CWorking capital = 0,15 CTBM;
CBuilding = 0,2 CTBM;
COffsite = 0,05 CTBM
Operational costs of production
Operational costs of production obtained from the calculation of the raw materials cost, utilities cost, labor costs, the cost of care and insurance as well as marketing costs and overhead costs. These costs are calculated during the year when the factory operates.
Cost of revenue
This fee was obtained from the results of products sales for the year of operation, either from the sale of primary products and byproducts.
The calculation of income and cash flow
Income is the difference in cost of revenue and costs of operational every year. Furthermore, perform the calculation of depreciation, before tax cash flow, and the after
tax cash flow to determine the company’s cash
flow every year.
Economic Feasibility
The calculation will be performed was Interest Rate of Return (IRR), Net Present Value (NPV), payback period, Break Event Point, and sensitivity analysis to find out the feasibility of designed factory. The sensitivity analysis was done by the approach changes due to rising production costs and a production capacity decline amounted to 11%.
RESULT AND DISCUSSION
A. The Availability Projection of Raw Materials and Product Demand
Market Aspects
Market aspect and marketing is one of the important aspects in considering the development of an industry. Tapioca markets can be divided into two categories, namely domestic market and foreign market. There are two market segments that may be intended in domestic market, including food industry and non-food industry. As for foreign markets, China and Malaysia are the main tapioca export destination as well as several other countries such as Singapore, Japan, Philippines, Taiwan, Spain, Netherlands, Switzerland, Germany, United Kingdom, Italy, Poland and Russia [14]. In this design, a market position that will be taken was the challenger's position; given the large number of tapioca industry has been standing in Indonesia. In this position, the company should be able to instill that the tapioca products have a competitive quality even better than competitor products.
The projected market demand is obtained by comparing the rate of population growth projections to the tapioca per-capita consumption amounting 4.86 kg/capita/year, assuming that the rate of consumption per capita per year for the next 10 years. While, the market demand abroad used tapioca export demand trend data sourced from the Indonesia Central Bureau of statistics.
an average 68,531.72 tons per year. Thus, the average market opportunity was reached 1,361,570.23 tons per year. Table 1 shows the results for the calculations of tapioca demand projection on domestic and foreign markets. Based on these, the company planned to take a market share 3.5% of the total available market opportunities. Thus, the company takes tapioca production capacity amounting to 47,654.96 tons or rounded be 45,000 tons per year.
Table 1. Projected Market Share of Tapioca
Years Domestic Demand (Ton) (A)
Foreign Demand (Ton) (B)
Market Opportunities (Ton) (C = A+B)
2015 1,244,141.35 56,681.80 1,300,823.15
2016 1,263,002.54 61,421.77 1,324,424.30
2017 1,282,149.65 66,161.73 1,348,311.39
2018 1,301,587.04 70,901.70 1,372,488.74
2019 1,321,319.10 75,641.67 1,396,960.77
2020 1,341,350.30 80,381.63 1,421,731.93
2021 1,361,685.17 85,121.60 1,446,806.77
2022 1,382,328.32 89,861.56 1,472,189.88
Average 1,293,038.51 68,531.72 1,361,570.23 Source: Data processed, 2013
Analysis of Competition
Tapioca markets that exist today belong to oligopoly markets, where the company will face the competition tight enough in some aspects like competition obtaining raw materials (supplier) and competition between manufacturers or companies. The company will
provide the raw material from farmer’s
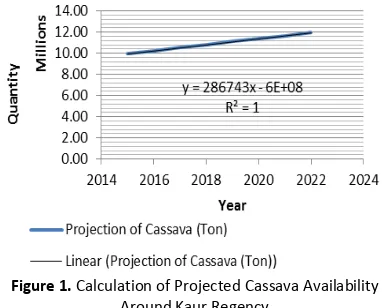
cooperatives or directly from local farmers around Kaur Regency. To set up the tapioca company with production capacity of 45,000 tons per year, it takes 180 thousand tons of cassava with starch yield assumptions 25 percent. Meanwhile, the projected availability of cassava around Kaur Regency annually achieved an average of 10 million tons (Figure 1). The cassava availability figures are much greater than the needs of the company, so the rivalry with collectors and traders between industries tapioca can be minimized.
The competitors that will be faced by the industry were designed is tapioca industries who has stood before. In addition, other competitors that will be faced by the company is an importer of tapioca. These industries are the main competitors because it has had a clear market share. Therefore, as the new company, needed a marketing strategy to win the market competition. Some strategies that can be used, including:
Figure 1. Calculation of Projected Cassava Availability Around Kaur Regency
Source: Data processed, 2013
a. Product Strategy
Product strategy taken include: maintaining the product quality through the control input, process and output of the production in accordance with SOP (Standard Operational Process). Quality standards that are used for these product was a standard National Indonesia 01-2997-1996. In addition, product strategies taken include the use of packaging and manufacture product label. The packaging used was a sacks coated plastic-Polypropylene on the inside. This type of packaging was chosen because of some considerations include: sack can protect the product from direct friction with other objects, the sack is sturdy and flexible so as to facilitate the distribution of plastic packaging, while the inside has a strong but lightweight, inert, not rusty, thermoplastic, and easily given colors. The labels were made on the basis of General Food Labeling Ruleson in Directive 2000/13/EC.
b. Pricing Strategy
Pricing strategies that were used on the tapioca product sales was a combination of penetrating pricing and status quo pricing strategy. It was applied to gain lower prices in accordance with the rates applied by competitors.
c. Marketing Channel Strategy
distributor. Whereas the marketing of tapioca in foreign countries, companies can market their products to importers abroad.
d. Distribution Strategy
Distribution strategy used was intensive distribution strategy where the products sold were placed on many retailer and distributor in various places. It was because tapioca products were staple goods that have high demand and levels of consumption. Beside that also used the market development strategy by expanding the distribution area and cooperation relationship with small and large traders so guaranteed product availability in the market.
Technical Aspects
Analysis of technical aspects concerning several matters related to technical and operations. Studies conducted include the determination of the project location, determining the production capacity and technological process. The company planned in the Regency Kaur. This location is a Regency of Bengkulu Province, which put agriculture as an important sector that have role in the economy. In 2012 the agricultural sector's contribution to GDP Kaur Regency increased 177 percent. Some of the considerations that made reference in determining this location include:
a. The distance to the raw materials location Kaur Regency is one of the regions with the cassava productivity has increased significantly reaches 52.61 percent every year [6]. In addition, its location directly bordered by the Lampung Province, South Sumatra Province and Bengkulu Province in other districts can provide ease in accessing the resources of raw materials in some locations. Mileage from the location of industrial establishments towards the raw materials location in South Sumatra Province and Lampung Province respectively reached approximately ± 275 km and ± 317 km or the equivalent of approximately 6 hours road trip.
b. The distance to the market location
Jakarta is the main marketing location to be traveled from Bintuhan Port to Merak Port of Jakarta reached approximately 360 km or approximately 3 hours using the travel lane.
c. Availability of workforce number of jobless reached 2.701 souls [7]. d. Availability of energy
The energy required for the production process includes water and electricity. Industrial water needs can be met from several sources of water as well as from the well bore. In addition, the demand for water also can be provided by Regional Drinking Water Companies. The water supply can be channeled reach 1.125 cubic meters per day. Electricity needs for the industry can be supplied by the State Electrical Company. There were 4 sub branches of State Electrical Company that was able to supply power 14.797.490 KwH per year [8].
e. Community Response
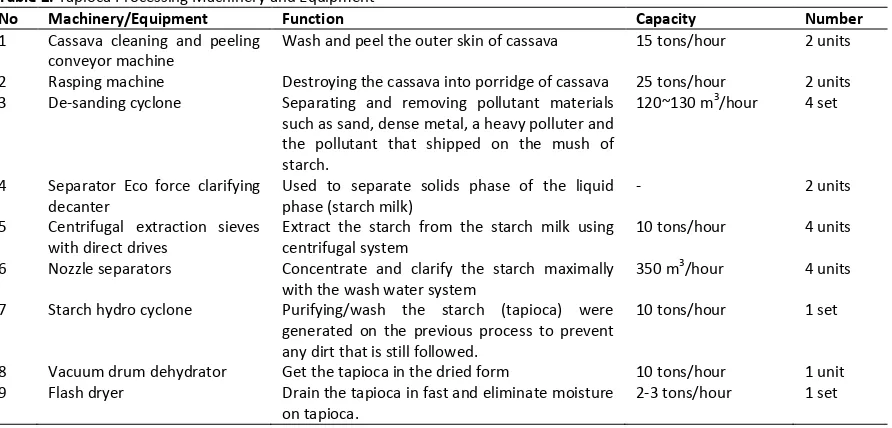
The establishment of this industry will give some positive impacts that can be obtained from the local community such as the opening of new jobs for local people. It will also give an impact to the increasing of local cassava crop absorption, which directly will improve the welfare of farmers. In addition, it can become a destination market for local cassava farmers to market his China Company (GEA Mechanical Equipment) that has been ISO 9001 standard and high quality materials. By using this technology, the amount of water needs for the production process could be minimized. In one production line required a total power of 300 Kw. Extents of land needed for one line of the production process is approximately 1000 m2. Machinery and equipment production planned is a set of machines that are using automated systems with the human operator as a function of power and control. Installation of tapioca production station was planned to operate for 24 hours with a total capacity 150 tons of tapioca per day. Details of machines that are used can be seen in Table 2.
B. The Efficiency of Cassava Farmers Partnership Patterns
Table 2. Tapioca Processing Machinery and Equipment
No Machinery/Equipment Function Capacity Number
1 Cassava cleaning and peeling conveyor machine
Wash and peel the outer skin of cassava 15 tons/hour 2 units
2 Rasping machine Destroying the cassava into porridge of cassava 25 tons/hour 2 units
3 De-sanding cyclone Separating and removing pollutant materials
such as sand, dense metal, a heavy polluter and the pollutant that shipped on the mush of starch.
120~130 m3/hour 4 set
4 Separator Eco force clarifying decanter
Used to separate solids phase of the liquid phase (starch milk)
- 2 units
5 Centrifugal extraction sieves with direct drives
Extract the starch from the starch milk using centrifugal system
10 tons/hour 4 units
6 Nozzle separators Concentrate and clarify the starch maximally
with the wash water system
350 m3/hour 4 units
7 Starch hydro cyclone Purifying/wash the starch (tapioca) were
generated on the previous process to prevent any dirt that is still followed.
10 tons/hour 1 set
8 Vacuum drum dehydrator Get the tapioca in the dried form 10 tons/hour 1 unit
9 Flash dryer Drain the tapioca in fast and eliminate moisture
on tapioca.
2-3 tons/hour 1 set
Source: GEA Mechanical Equipment, 2013
Table 3. The Priorities Determination of Partnership Pattern
No Variable Weights Inti Plasma Sub-Contract General Trade Franchise Agency
Score Value Score Value Score Value Score Value Score Value
1 Types of industrial
sectors 0.187 5 0.937 4 0.749 2 0.375 2.5 0.468 2 0.375
2 Types of business
entities 0.161 5 0.805 4 0.644 3 0.483 1.5 0.242 2 0.322
3 The amount of capital 0.196 5 0.981 4 0.785 2.5 0.490 2.5 0.490 1 0.196
4 Span of employment
contract 0.115 5 0.576 4 0.461 3 0.346 2.5 0.288 1.5 0.173
5 Types of business
contracts 0.127 5 0.636 4 0.509 2 0.254 2.5 0.318 2 0.254
6 Viewpoint of system 0.095 5 0.473 4 0.379 3 0.284 2 0.189 1 0.095
7 Payment and profit
sharing systems 0.118 5 0.591 4 0.473 3 0.355 2 0.237 1 0.118
TOTAL 1 5.000 4.000 2.587 2.232 1.533
Source: Data processed, 2013
cassava and dried sliced cassavas. Fresh cassava will be supplied directly by the farmer for further processed into tapioca. In addition, the company will cooperate with farmers through the partnership pattern to process cassava into raw dried sliced cassavas, because of fresh cassava was only available about 4 months on the optimal harvesting period. Generally, the cassava farmers will sell fresh cassava and dried sliced cassavas to collectors, so the price of raw materials will be high on the corporate level. This has an impact on the low price of raw materials at the farmers level, so that did not benefit from the sale of raw materials. Solutions that can be taken to overcome these problems through partnerships pattern between the company and farmers.
Based on the assessment variable of partnerships patterns undertaken by some
expert respondent, obtained that “inti plasma”
was the most suitable partnership patterns applied to tapioca agro-industries. From the
weighting results, the “inti plasma” partnership
patterns obtained the highest total score (Table
3). The high value of “inti plasma” models due to
the highest suitability scoring variables used in the weighting of the partnership pattern. The utilization of this partnership pattern in tapioca agro-industries has a quite strong economic strength, particularly in addressing the problems of funding as well as product quality at the farmers level, ensure the marketing and production price of farmers.
product through the partner group. The quality and quantity of raw materials will be more easily controlled by means of conducting training and guidance to farmers about cultivating cassava planting patterns and timing of planting cassava, fertilizer, as well as training production of sliced dried cassavas.
C. The Tapioca Industrial Designs
The financial analysis was intended to gain an overview of investment plans which can be used as a business establishment. This analysis can also be used as a feasibility assessment of the planned tapioca agro-industries model. The planned tapioca agro-industries development model can be seen in Figure 2. Some assumptions used in the calculation of this financial analysis, including: (a) the repayment of bank loans made within 4 years; (b) the age of the plant was estimated to be over 20 years with the construction company for 1 year; (c) 1st year production for 8 months, 2nd year production for 10 months and the next year production settled for 1 year; (d) effective interest rate 11% and inflation rate 10%; and (e) income tax rates according to Indonesia article 17 of ACT No. 7 of 1984.
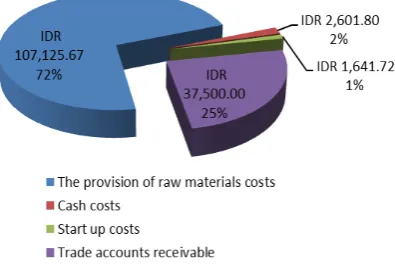
In this discussion, financial analysis and feasibility analysis was discussed is the calculation and analysis of the costs incurred for the company's investment and overall costs that are used in the 1st year production. Financial calculations based on the results obtained for total capital investment amounting IDR 165,286,354,288.09. Total capital investment was comprised of the some cost details include working capital investment and fixed capital investment. Details of the capital investment can be seen in Figure 3 and Figure 4.
Figure 3. The Details of Total Working Capital Investment (x 1 million)
Figure 4. The Details of Total Fixed Capital Investment
The other cost were used for the financial analysis is the production cost. The total production cost of the company reached IDR 25,147,414,915.96. In the 1st year production, the company can produce for 8 months by generating 30,000 tons of tapioca products so obtained the cost of goods production IDR 4,171.58. That value was quite low when compared with the tapioca price in the market that reached IDR 5,500 per kilogram [4]. Based on several considerations, the company plans a product selling price IDR 5,000. It was taken as the benchmark price for a company that can be used by distributors in considering consumer-level price.
By setting the selling price of tapioca products, then it can be calculated the estimated total revenue to be received. The Total revenue received by the company in the 1st year production was reached IDR 150,000,000,000. While in 2nd year production the company will have total revenue IDR 187,500,000,000 with a total production reach 37.500 tons of tapioca. In the 3rd year production and the next year, the total revenue will be constant IDR 225,000,000,000 with a total production 45,000 tons of tapioca.
Feasibility Test Criteria
calculation result for feasibility indicators of can be known payback period for tapioca factory was planned for 2 years 4 months, where this value was less than the age of planned project. c. Internal Rate of Return (IRR)
The calculation results obtained from Internal Rate of Return values of 43.55%. Thus, the planned tapioca factory can be said to deserve built.
d. Profitability Index (PI)
Based on the results of the feasibility analysis obtained values of Profitability Index 3.56 so the planned factory can be said to deserve built. e. Benefit Cost Ratio (B/C Ratio)
Based on the results of the feasibility analysis calculations, retrieved value B/C ratio amounted to 1.23. This value indicates that the B/C ratio obtained was greater than 1, so that the project can be said to deserve built
f. Break Event Point (BEP)
Based on the results of the feasibility analysis calculation obtained 3.30% of BEP with BEP unit 991,269.16 kg of tapioca per year and the level of sales was IDR 4,956,345,812.12. The whole feasibility analysis calculation result of the planned tapioca factory can be seen in Table 4. g. Sensitivity Analysis
Sensitivity analysis was used to see the influences that will occur as the result of company condition changes due to decrease in sales and increase in operating costs. In this case, it was assumed the value changes for each condition changes in some feasibility investments criteria, the business was still said deserve to be realized.
CONCLUSIONS AND RECOMMENDATIONS Conclusion
Based on the results of research can be drawn some conclusion with regard to the feasibility
study of tapioca agro-industries development model, including:
1. To produce continuously, tapioca-processing industry to be constructed must consider the availability of the raw materials used. The optimal harvest cassava which was only about 4 months used the company to produce tapioca with fresh cassava raw materials, while production in the next month was done with raw sliced dried cassavas obtained from farmers and gatherers.
2. The companies can involve farmers through
the “inti-plasma” partnership program to obtain the raw fresh cassava and sliced dried cassavas were quality and sustainability. Through this program the quality of raw materials can be controlled in accordance with the company quality standards.
3. Based on the data calculation result of projected tapioca demand both domestic and foreign, the company was targeting 3.5% market of the total market opportunity projection or equivalent to an average production capacity of 45,000 tons of tapioca annually.
4. Based on the calculation result of financial analysis, feasibility analysis and sensitivity analysis, thereby the establishment of tapioca factory development model was highly feasible.
Recommendations acceptance from the communities surrounding industry relating to the application of tapioca processing technology with raw material substitution of fresh cassava and slice dried cassavas.
3. It is need to do a research on integrated utilization and handling of tapioca industrial waste with raw fresh cassava and slice dried
[2]. Badan Pusat Statistik (BPS). 2012. Tabel Luas Panen- Produktivitas- Produksi Tanaman Ubi Kayu Seluruh Provinsi. bps.go.id/. Diakses pada 23 Agustus 2013. 18.20 WIB.
[3]. Balai Penelitian Tanaman Kacang-kacangan dan Umbi-umbian (Balitkabi). 2012. Pengaturan Waktu Tanam dan Waktu Panen Ubikayu. Balai Penelitian Kacang-kacangan dan Umbi-umbian, Malang.
[4]. Badan Pengawas Perdagangan Berjangka Komoditi Kementerian Perdagangan (Bappebti). 2014. Statistik Perdagangan. Kementerian Perdagangan, Jakarta.
[5]. Bautista, M. R. 1998. Effect of Domestic Policies and External Factors on Agricultural Price: Cassava and Soybeans in Indonesia. Journal The Developing Economies, XXXVI-2: 155-77.
[6]. BPS Kabupaten Kaur. 2012. Kabupaten Kaur Dalam Angka 2012. BPS Kabupaten Kaur. Bengkulu.
[7]. BPS Kabupaten Kaur. 2013. Kabupaten Kaur Dalam Angka 2013. BPS Kabupaten Kaur. Bengkulu.
[8]. BPS Provinsi Bengkulu. 2012. Provinsi Bengkulu Dalam Angka 2012. BPS Provinsi Bengkulu. Bengkulu
[9]. Departemen Pertanian Republik Indonesia (Deptan). 2005. Pengembangan Usaha Pengolahan Tepung Tapioka. Ditrektorat Pengolahan dan Pemasaran Hasil Pertanian. Jakarta.
[10]. Food and Agricultural Organization of the United Nations (FAO). 2011. The Cassava Transformation in Africa. The Food and Agriculture Organization of The United Nations (FAO).
[11]. GEA Mechanical Equipment. 2013. Tapioca Starch Processing Engineering Excellence for Custom-Fit Solutions. GEA Westfalia Separator Group GmbH
[12]. Kementerian Perindustrian Republik Indonesia (Kemenperin). 2011. Laporan Kinerja Sektor Industri dan Kinerja Kementerian Perindustrian Tahun 2012. Kementerian Perindustrian. Jakarta.
[13]. Kementerian Perindustrian Republik Indonesia. 2012. Pemantauan Ekspor Komoditi Hasil Industri Terpilih Ke Negara Mitra Dagang Utama Tahun 2007 Sampai 2011. Kementerian Perindustrian. Jakarta. [14]. Koswara, S. 2006. Teknologi Modifikasi Pati.
Ebook Pangan.
[15]. Noviani, dkk. 2006. Analisis Kelayakan Finansial Substitusi Gaplek Sebagai Bahan
Baku Industri Tapioka Pada Skala Kecil. Agritek 14 (4) : 969-975 (ISSN 0852.5426). [16]. Umar, Husein. 2000. Business an
Introduction. PT. Gramedia Pustaka Nusantara. Jakarta.