Multigroup Moderation Test in Generalized Structured Component Analysis
Angga Dwi Mulyanto1, Solimun1, Ni Wayan Surya Wardhani 1, Suharno2
1Brawijaya University, Indonesia 2Mercu Buana University, Indonesia
Email: [email protected]
ABSTRACT
Generalized Structured Component Analysis (GSCA) is an alternative method in structural modeling using alternating least squares. GSCA can be used for the complex analysis including multigroup. GSCA can be run with a free software called GeSCA, but in GeSCA there is no multigroup moderation test to compare the effect between groups. In this research we propose to use the T test in PLS for testing moderation Multigroup on GSCA. T test only requires sample size, estimate path coefficient, and standard error of each group that are already available on the output of GeSCA and the formula is simple so the user does not need a long time for analysis.
Keywords: GSCA, GeSCA, Multigroup Moderation Test
INTRODUCTION
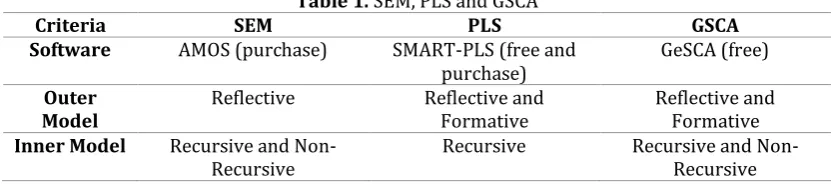
In 2004, Hwang and Takane introduced an alternative method for path analysis called Generalized Structured Component Analysis (GSCA). GSCA can be used for data reflective and formative, can be used for recursive and non-recursive relationship, doesn’t require normality assumption, and can be used for small sample size [1]. Differences and similarities GSCA with other method can see in Table 1.
Table 1. SEM, PLS and GSCA
Criteria SEM PLS GSCA
Software AMOS (purchase) SMART-PLS (free and purchase)
GeSCA (free)
Outer Model
Reflective Reflective and Formative
Reflective and Formative Inner Model Recursive and
Non-Recursive
Recursive Recursive and Non-Recursive
THEORITICAL REVIEW
The Formula for multigroup moderation test using T test if standard deviations are equal can be write as [3]
If standard deviations are unequal, the formula can be write as [3]
𝑡 = |𝑏1− 𝑏2|
Degree of freedom for standard deviations are unequal can be write as [3]
𝑑𝑓 = ‖(
b1 : estimate for path coefficient group 1
b2 : estimate for path coefficient group 2
n1 : sample size group 1
n2 : sample size group 2
SE1 : standard error group 1
SE2 : standard error group 2
To know that standard deviations are equal or unequal, we can use Bartlett test. Formula Bartlett test for moderation multigroup can be write as [5]
𝜒2=(𝑛 − 𝑘) ln 𝑠𝑝2− ∑ (𝑛𝑘𝑖=1 𝑖− 1) ln 𝑠𝑖2
k is the number of group and n is the total of sample size. Because T test can only use for 2 group, equation 4 can rewrite as
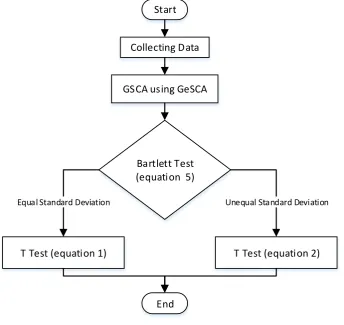
2. GSCA
The second step is structural modeling with GSCA using GeSCA software. The user can access www.sem-gesca.org to run GSCA.
3. Bartlett Test
After obtained the results of GSCA, the third step is compare standard deviation group 1 and group 2 using equation 5. If standard deviation group 1 equal with standard deviation group 2 (p-value ≥ 0.05) we can use T Test in Equation 1, and if standard deviation group 1 unequal with standard deviation group 2 (p-value < 0.05) we can use T Test in Equation 2. 4. Multigroup Moderation Test
The last step is Multigroup Moderation Test using T Test according the results of Bartlett Test. If p-value ≥ 0.05 then the effect of group 1 similar with the effect of group 2, else if p-value < 0.05 then the effect of group 1 difference with the effect of group 2.
Collecting Data
GSCA using GeSCA
Bartlett Test (equation 5)
Equal Standard Deviation Unequal Standard Deviation
T Test (equation 1) T Test (equation 2)
Start
End
Figure 1. Steps of Research
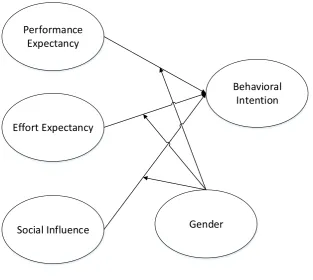
Performance Expectancy
Effort Expectancy
Social Influence
Behavioral Intention
Gender
Figure 2. Research Model
RESULTS AND DISCUSSION
The first step is Generalized Structured Component Analysis with GeSCA software. The Result of GSCA can see in table 2.
Table 2. Result of GSCA
Path Group 1 Group 2
Estimate SE CR Estimate SE CR performance expectancy >
behavioral intention
0.205 0.183 1.12 0.038 0.22 0.17
effort expectancy > behavioral intention
0.19 0.161 1.18 0.122 0.188 0.65
social influence > behavioral intention
0.379 0.173 2.19* 0.539 0.176 3.06*
CR* = significant at 0.05 level
effort expectancy > behavioral intention 0.632093 0.426589 standard deviation equal social influence > behavioral intention 0.027056 0.869347 standard deviation equal
As we can see from Table 3 that both groups have the same standard deviation in all paths, so for multigroup moderation test we can use equation 1.
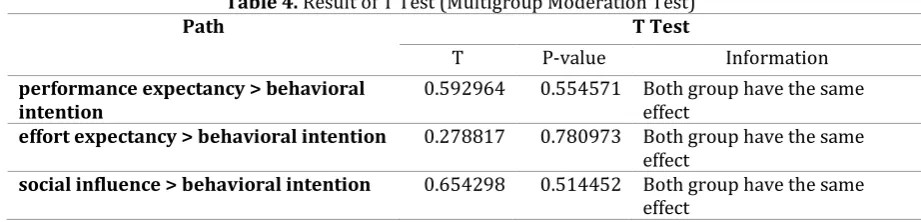
Table 4. Result of T Test (Multigroup Moderation Test)
Path T Test
T P-value Information
performance expectancy > behavioral intention
0.592964 0.554571 Both group have the same effect
effort expectancy > behavioral intention 0.278817 0.780973 Both group have the same effect
social influence > behavioral intention 0.654298 0.514452 Both group have the same effect
Based on Table 4, we can say that there is no difference between male and female in all paths or in other word we can say that Gender is not a moderator variable that moderate the effect of performance expectancy, effort expectancy and social influence on behavioral intention using e-learning.
CONCLUSION
T test only requires estimate path coefficient, sample size and standard error of each group, so it can be used as an alternative test to compare the effect between group in Generalized Structured Component Analysis. Limitations of the T test can only be used to compare the 2 groups.
The results of this research indicate difference with UTAUT, male and female have similar effect and only social influences which have an effect on behavioral intention on e-learning. To increases behavioral intention using e-learning in male or female student, Mercu Buana University need more social approach to students. Sosial approach can through persuasion from lecturer to student or student to student.
REFERENCE
[1] H. Hwang and Y. Takane, "Generalized structured component analysis," Psychometrika, vol. 69, no. 1, pp. 81-99, 2004.
[2] H. Hwang, GeSCA User’s Manual, Online User Manual, 2011.
[3] M. Sarstedt, J. Henseler and M. Christian, "Multigroup Analysis in Partial Least Squares (PLS) Path Modeling: Alternative Methods and Empirical Results," Measurement and research methods in
international marketing, advances in international marketing, vol. 22, pp. 195-218, 2011.
[4] W. W. Chin, Frequently asked questions – partial least squares and PLS-graph, Online User Manual, 2000.
[5] NIST/SEMATECH, e-Handbook of Statistical Methods, Online User Manual, 2012.