*Corresponding author:
HYPOCENTER DETERMINATION AND CLUSTERING OF
VOLCANO-TECTONIC EARTHQUAKES IN GEDE VOLCANO
2015
Aulia Kharisma Nugraha1*, Sukir Maryanto2, Hetty Triastuty3
1Magister Program of Physics, Faculty of Mathematics and Natural Sciences, Brawijaya
University
2Department of Physics, Faculty of Mathematics and Natural Sciences, Brawijaya University 3Center of Volcanology and Geological Hazard Mitigation (CVGHM), Bandung
Recieved: 16th March 2017; Revised: 28th March 2017; Accepted: 20th April 2017
ABSTRACT
Gede volcano is an active volcano in West Java, Indonesia. Research about determination the volcano-tectonic earthquake source positions has given results using volcano-volcano-tectonic earthquakes data from January until November 2015. Volcano-tectonic earthquakes contained deep (VT-A) have frequency (maximum amplitude) range 5 – 15 Hz. Furthermore, they contain shallow earthquake, VT-B have range 3-5 Hz and LF have range 1-3 Hz. Geiger’s Adaptive Damping (GAD) methods used for determining the hypocenter of these volcano-tectonic (VT) events. Hypocenter distribution divided into 4 clusters. Cluster I located in the crater of Gede volcano dominated by VT-B earthquakes their depth range 2 km below MSL to 2 km above MSL including the VT-B swarm. The seismic sources in cluster I indicated dominant due to the volcanic fluid or gas filled in conduit pipes. Cluster II located at the west of Gede volcano caused by Gede-Pangrango fault-line dominated by VT-A earthquakes with depths range 1.5 km below MSL to 700 m above MSL. Cluster III located in the North of Gede volcano dominated by VT-A events there caused by graben fault area with those depths range 7.5 – 1.65 km below MSL. Cluster IV located in South West of Gede volcano contained VT-A earthquakes with depth range at 10 km below MSL and VT-B earthquakes this depth 2 km below MSL. Due to magma intrusion filled into fractures of the fault in the West of Gede volcano this shallow magma filling-fractures and degassing in subsurface assumed dominates the volcano-tectonic events from January to November 2015 due to faults extends from North to South occured in the West of Gede volcano.
Keywords: Gede; volcano; volcano-tectonic; earthquake; hypocenter
Introduction
Subduction-zone volcanoes are among active and produce the most explosive worldwide. They are located along the convergent margins of oceanic and continental crusts. The most convergent tectonic plates are located in Pacific Ocean, along its margins continuous volcanic chains found and called ‘Ring of Fire’. The islands of Indonesia represent the west tropical part of this volcanic front. Sumatera and Java islands are the most dangerous regions due to dense population.1
The famous volcanoes are Semeru, Guntur, Kelud and Sinabung volcanoes have increased activity recently.2–5 Therefore, research in
order to prevent volcanics disaster is increasing throughout all volcano activities
The phenomenon of volcano-tectonic events (swarm or not swarm) at Gede volcano raises questions about their mechanism. Hypocenters determination for the first step to determine their source positions and depths. Moreover, their presence was related to the structure that develops in Gede volcano. The next question will expand on how volcanic swarm influence against Gede volcano further volcanic activity.
Geology Study
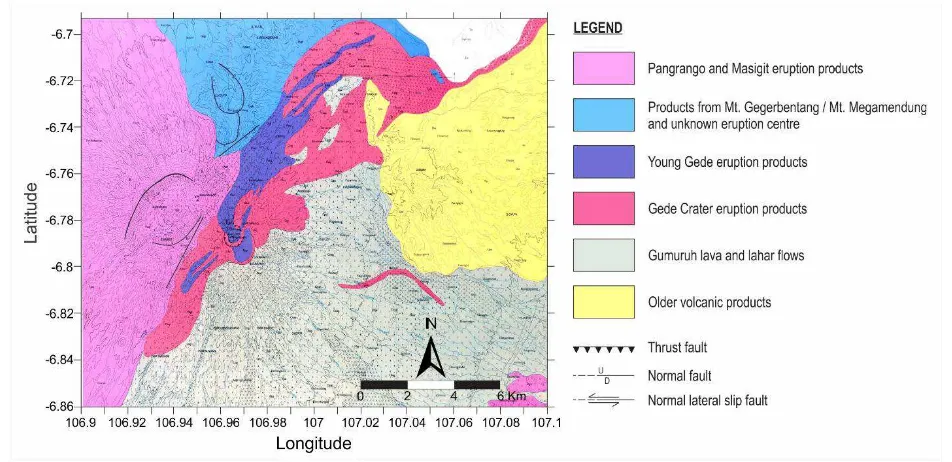
Gede volcano is a stratovolcano type, it composed by pyroclastic from explotion and effusive activities and deposit on depression area of ancient Gede volcano. The edifice of Gede volcano divided into three parts i.e main staratocone called Gumuruh, intra-caldera cone, and intra-crater.8
The main stratocone, Gumuruh has relative elevation 2.4 km above the volcanic base and it volume 95% of the total volume of the volcano. Gumuruh stratocone covered by thick lava flows and debris avalanche deposit in South-Eastern formed from ancient gravitational collapse. The avalanche deposit composed by variously fragmented and deformed former massive lava flows of
high-silica basalats. The Gumuruh cone has horseshoe shape which it is opened toward the NNE.7–9
Intra-caldera cone has relative elevation 200 m above the flat floor of a half circular called “Alun-alun”. The “Alun-alun” separates the caldera from the caldera wall lying toward the SSE. The cone is composed of thick massive lava flows of basaltic andesites, some with rough columnar joint. The lava cone is covered by massive pyroclastic sequence that probably erupted during summit crater formation and other explotion activities.8
The summit crater of Gede volcano filled with a small lava dome which it is the source of a 1.5 km-long thick blocky lava flows. Three explosive funnels i.e Kawah Ratu8, Kawah Lanang, and Kawah Baru surrounded by aprons of coarse explosive on top of the lava dome. The pyroclastic drop spread in South and South East while the lava flows in North and North East. Western of Gede volcano contiguous with Pangrango volcano. The Gede-Pangrango complex affected by normal fault between the mountains. Furthermore, Gede volcano has shear fault in South East (Figure 1).10
Methods
The research data used the arrival time P and S wave of VT earthquakes. The data represented from seismogram that recorded from January-November period in 2015 obtained. The arrival time P and S picked using Seisan 9.0 manually. Picking result beside arrival time P and S wave, the raw data has been cut along the signal are picked and save it into ascii format. The ascii data used to determinate their frequency. Then they classified VT-A (high frequency), VT-B and Low Frequency. Furthermore, determine the
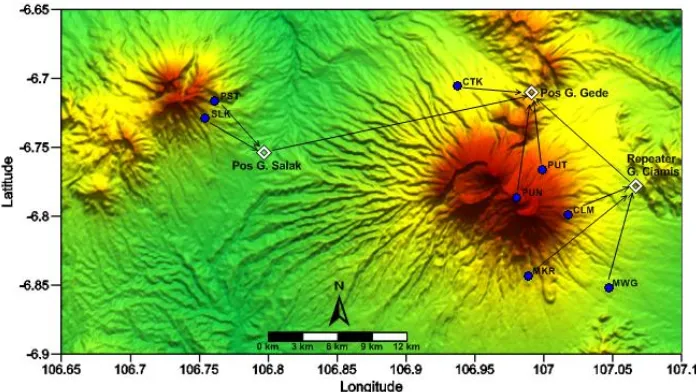
hypocenters need some additional data such as stations coordinates, velocity model, and contours map of Gede volcano. Figure 2 showed a map of Gede volcano and its seismic network. The recording stations looked on the seismic network of Gede volcano consist of 6 stations in Gede volcano i.e Citeko, Puncak, Gunung Putri, Culamega, Mekarwangi and Mangkurejo and 2 stations in Mt. Salak i.e
Figure 2. Map of seismic data transmission network of Gede volcano and mount Salak
(modified).7 Hypocenter determination obtained from
calculation of Geiger Adaptive Damping (GAD) method.3 This method works with the parameters of the arrival time, velocity model and station position station in Cartesian coordinate. Besides, the velocity model obtained from the previous studies. The minimum station needed GAD in determining the source position was 3 stations.
GAD calculation principle is to minimize residual between the observation and calculation of arrival time of P and S waves11.
The residual time tijres rijshowed on the equation (2) influenced by their duration times
ij 1 with the distance segmentation (ds) from the
earthquake source to the stations (receiver).
In addition, GAD method also yielded to the earthquake origin time wherein determining the origin time used velocity model 1-D.5 GAD hypocenter was source
position in the form of Cartesian coordinate which must be changed to the form of geography coordinate. Then, the result was plotted into the contours map of Gede volcano. Moreover, it was also plotted to a depth cross section for latitude and longitude position.
The analysis carried out on hypocenter distribution then observing their patterns and dividing into several hypocenter clusters. The division of this cluster referred to the correlation of VT earthquake hypocenter to the geological condition in the area. Moreover, it could be correlated based on the position of the depth with the volcanic activity, e.g. due to intrusion, gas release, or due to fault on the conduit walls in Gede volcano.
Result and Discussion
The number of volcano-tectonic (VT) earthquake from January-November 2015 was 514 events. Next, they were selected again and cataloged them based on number of station that recorded for the same earthquake. After selection, 100 VT earthquakes recorded in 3 stations or more (Figure 3). Then, their arrival time P and S waves were used as input for GAD calculation.
Figure 3. The sum of volcano-tectonic (VT) earthquake of Gede volcano on January-November period in 2015 as many as 514
earthquakes.
The volcano-tectonic (VT) earthquakes for
January – November 2015 period data obtained their classification consist 2 VT type such as depth (VT-A) and shallow (VT-B and LF)6-7 earthquake. Meanwhile, Figure 4
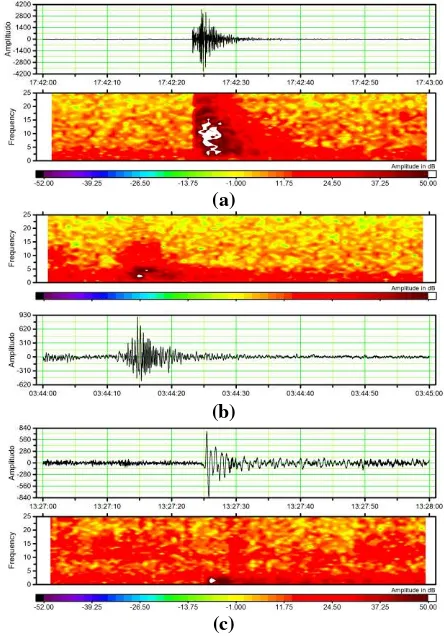
indicated the wave form and frequency of VT types obtained from the selection data before. The frequency determinated using short-time fourier transform. Sampling interval for each waves type is 0.01 s. Based on Figure 4a, VT-A earthquake (from sample January 07, 2015; 13: 33 WIB) have clearer P wave form and contained frequency at maximum amplitude (white color spectrum) ranged from 5 to 15 Hz. The VT-B earthquake (sample March 03, 2015; 3:44 WIB) at Figure 4b have frequency range from 3 to 5 Hz at maximum amplitude (white color spectrum). The low-frequency earthquake (Figure 4c) have frequency ranged from 1 to 3 Hz at maximum amplitude (sample March 19, 2015; 13:27 WIB).
(a)
(b)
(c)
Figure 4.Earthquake characters of volcano-tectonic on January-November 2015. (a) VT-A earthquake (January 07, 2015; 13:33 WIB),
(b) VT-B earthquake (March 03, 2015; 3:44 WIB) and, and (c) LF earthquake (March 19,
2015; 13:27 WIB).
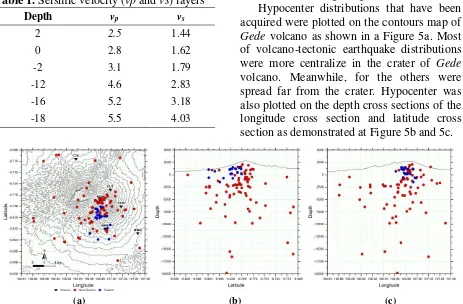
Velocity model used in hypocenter calculation was common model which it recommended by CVGHM based on the previous studies in Sinabung volcano13. The
velocity model divided into 6 layers based on P and S wave velocity in each layer’s depth with their configuration at Table 1.
Table 1. Seismic velocity (vp and vs) layers
Depth vp vs
2 2.5 1.44
0 2.8 1.62
-2 3.1 1.79
-12 4.6 2.83
-16 5.2 3.18
-18 5.5 4.03
The GAD calculation process could obtain VT earthquake hypocenter done by using trial and error against the arrival time of P and S wave. As the control was residual value from observation time to the calculations, the less the residual time in the all stations recording so the volcano-tectonic earthquake hypocenter obtained would be getting better.
Hypocenter distributions that have been acquired were plotted on the contours map of
Gede volcano as shown in a Figure 5a. Most of volcano-tectonic earthquake distributions were more centralize in the crater of Gede
volcano. Meanwhile, for the others were spread far from the crater. Hypocenter was also plotted on the depth cross sections of the longitude cross section and latitude cross section as demonstrated at Figure 5b and 5c.
(a) (b) (c)
Figure 5. The calculation result of hypocenter distribution with GAD method on (a) the contours map of Gede volcano, (b) latitude cross section and (c) longitude cross section.
Figure 6. The hypocenter distribution map divided into 3 clusters. All of the clusters indicated the different earthquake source.
The hypocenters distribution map was divided into 4 clusters (Figure 6). Cluster I showed the VT earthquake derived from the sources on top of the Gede volcano, including the swarm earthquake (blue color). Cluster I was dominated by the non-swarm VT-B earthquake with depth range 2 kilometers below mean sea level to 1.9 kilometers above mean sea level. The range of the depth indicated that the earthquake was in the conduit pipe area or magma pouch. The possibility was influenced by degassing activity.14
kilometers above sea level and 700 meters under the sea level. The depth range showed that the swarm of the earthquake was shallow earthquakes (VT-B). Although it was dominant of VT-B earthquake, in the crack of the VT-B earthquake appearing in the swarm, there was VT-A earthquake which appeared once during the period of the swarm. This VT-A earthquake was identified has depth 4.5 kilometers under the sea level.
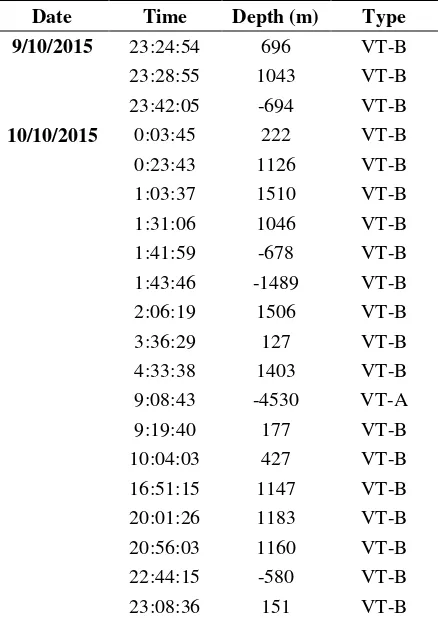
The earthquakes called swarm because they have a magnitude relatively. In this case found VT-B earthquakes identified as a swarm occurred at October 09th - 10th, 2015. Interval
of their emergence about 10-30 minutes per event and their magnitude range between 0.5-1.5.
Table 2. Depths and types of volcano-tectonic swarm October 2015
Date Time Depth (m) Type
9/10/2015 23:24:54 696 VT-B
23:28:55 1043 VT-B 23:42:05 -694 VT-B
10/10/2015 0:03:45 222 VT-B
0:23:43 1126 VT-B
1:03:37 1510 VT-B
1:31:06 1046 VT-B
1:41:59 -678 VT-B
1:43:46 -1489 VT-B
2:06:19 1506 VT-B
3:36:29 127 VT-B
4:33:38 1403 VT-B
9:08:43 -4530 VT-A
9:19:40 177 VT-B
10:04:03 427 VT-B
16:51:15 1147 VT-B 20:01:26 1183 VT-B 20:56:03 1160 VT-B 22:44:15 -580 VT-B
23:08:36 151 VT-B
Cluster II showed the VT earthquakes ploted at Pangrango (Figure 7) which it correlated with fault located on the West of
Gede volcano and graben on Pangrango.9 The source of VT earthquake in cluster II was in the depth between 5-10 kilometers below the sea level and dominant of inside earthquake
(VT-A).6 They are shown in Figure 6 that the position of the earthquake in cluster II formed direction straightness from the north to the south. If it was attributed to the geological structure of mount Pangrango, so it could be concluded that the source of VT earthquake was caused by active cracks beneath the mount
Pangrango10. The active cracks gave the magma intrusion way from the deep magma chamber which filled the fracture gaps then break through the magma vents of the Mt. Pangrango.
Figure 7. The hypocenter source of volcano-tectonic earthquake in cluster II was more influenced by the structure of normal fault or
graben in the western side of Gede volcano precisely in mount Pangrango.
Cluster III represented a group of VT-A earthquake which derived from the north side in the outside of the Gede volcano. The earthquake source was spread in the depth between 7.5-16.5 kilometers below mean sea level. The most possibility was caused by the magma intrusion through the fault in the north of Gede volcano.
kilometers. The earthquake source in cluster IV was assumed that it was a breakthrough or magma intrusion through the new crevices caused by the normal fault in cluster II area.
The volcanic system reviewed from these earthquake activities of Gede volcano caused by the different sources. Based on the clustering results indicated Gede volcano have VT-B earthquakes (shallow) dominantly including the swarm at October 9th – 10th, 2015. Swallow depth estimated 2 kilometers below mean sea level up to 2 kilometers above mean sea level indicating the hypocenters affected from degassing or lava/fluid migration filling the fault fractures of Gede
volcano. This condition became one of the reasons why enhancement activity in crater surface rarely. Graben surround the top of the crater cause the appearance of the shallow cracks below the top of the crater. If there was the process of degassing, most of the gas fluid would be distributed through the fracture gaps evenly then its came out above the crater seemed much less.
Conclusions
Based on the research above, it can be concluded that volcano-tectonic earthquake on January-November 2015 period had the earthquake characteristics, such as inside earthquake A), shallow earthquake (VT-B and LF). The swarm pattern of volcano-tectonic earthquake happened on the 09-10 October 2015 dominated by VT-B earthquake with the depth to -1.5 km to 700 m from the sea level. The results of the hypocenter determination distinguished into 4 clusters based on the earthquake source. The appearance of earthquake source in cluster I was caused gas-release process (degassing) at the shallow depth. Meanwhile, the existence of degassing in cluster I demonstrated by the VT earthquake swarm in the cluster. It was different from cluster I, the earthquake source in cluster II caused by the activity of Gede-Pangrango fault on the West of Gede volcano. The fault of Gede-Pangrango extended from the north to the south with the result that affected the earthquakes in cluster III in the north and cluster IV in the south.
Acknowledgement
Thanks to Directorate of Research and Community Service, The Ministry of Research and Higher Education of the Republic of Indonesia, which has provided grant funding for research activities through “PUPT” of Brawijaya University under contract no. 460.74/UN10.C10/PN/2017). Thanks also to “Program Hibah Penguatan Suparman Y, Surono. Seismicity South of Guntur volcano , West Java , Indonesia. In: Annuals of Disasster Preventation Research Institute Kyoto University.; 2010:277–288.
2. Iguchi M, Suantika G, Sulaeman C, Wildan A, Sutawidjaja IS, Kriswati E, Kristianto, Solihin A, Surono, Triastuty H. Source Mechanisms of Volcanic Earthquakes at Some Volcanoes in Indonesia. Bandung; 2001.
3. McCausland W, White R, Indrastuti N, Gunawan H, Patria C, Suparman Y, Putra A, Triastuty H, Hendrasto M. Using a process-based model of pre-eruptive seismic patterns to forecast evolving eruptive styles at Sinabung Volcano, Indonesia. Journal of Volcanology and Geothermal Research. 2017.
7. Mulyana I, Basuki A. Laporan Penelitian dan Pengamatan Gunung Gede 2013; 2013.
8. Belousov A, Belousova M, Krimer D, Costa F, Prambada O, Zaennudin A. Volcaniclastic stratigraphy of Gede Volcano, West Java, Indonesia: How it erupted and when. Journal of Volcanology and Geothermal Research. 2015;301:238–252.
10. Situmorang T, Hadisantono RD. Peta
Geologi Gunungapi Gede, Cianjur, Jawa Barat. Scale 1:50000. Direktorat Vulkanologi; 1992.
11. Hasan MM, Triastuty H, Santosa BJ, Widodo A. Hypocenter Distribution of Low Frequency Event At Papandayan Volcano. Jurnal Neutrino:Jurnal Fisika dan Aplikasinya. 2016;9(1):10.
12. Nishi K. Hypocenter Calculation Software GAD (Geiger’s method with Adaptive Damping). Silver Expert JICA Indonesia; 2005.
13. Indrastuti N. Studi Kegempaan dan Seismik Tomografi Gunung Sinabung. 2013
14. Buurman H, West ME, Thompson G. The seismicity of the 2009 Redoubt eruption. Journal of Volcanology and Geothermal Research. 2013;259(September 2008):16–30.
6. Mulyadi D, Suantika G. Pengamatan seismik dan pengukuran suhu G. Gede Jawa Barat Juni – Juli 2002; 1992.