© The Author 2015. Published by Oxford University Press on behalf of the American Association for Public Opinion Research. All rights reserved. For permissions, please e-mail: [email protected]
THE POLLS—TRENDS
AMERICANS’ ATTITUDES TOWARD THE POLITICAL
PARTIES AND THE PARTY SYSTEM
HOWARD J. GOLD*
Abstract Drawing on survey data from ANES, Gallup, Pew, and other
polls, this article examines attitudes toward the parties and the party sys-tem from 1996 to 2014. A previous Poll Trends analysis of the parties, through 1995, found antipathy toward the party system but not toward the parties themselves. The data since 1996 demonstrate that extreme discontent now extends beyond the party system to the Republican and Democratic parties. The data also show that Americans have grown more likely to see sharp differences between the major parties, and to per-ceive both parties as too ideological. As for the party system, Americans express a high degree of ambivalence. On one hand, many believe that the major parties do not do an adequate job of representing the people, and that the country needs a third political party. On the other hand, there is skepticism that a third party would improve the quality of American democracy. Surveys continually register almost no support or even will-ingness to seriously consider support for a third-party candidate.
Americans’ attitudes toward political parties have changed considerably since the 1950s. The early work on partisanship found that citizens held a deep attachment to political parties; that they interpreted the complex world of politics through the lens of partisanship; and that this profound con-nection made it unlikely that voters would develop loyalty to a third party
(Campbell et al. 1960). Subsequent research, based on trends in the 1970s
and 1980s, suggested that rising issue awareness alongside institutional and generational changes contributed to weakening Americans’ partisan attach-ments (Beck 1976; Nie, Verba, and Petrocik 1976; Polsby 1983). Wattenberg
(1998) went even further, maintaining that parties had become increasingly
irrelevant, and were supplanted by candidates, in the minds of voters. But as
Howard J. Gold is a professor of government at Smith College, Northampton, MA, USA. The author thanks Donald Baumer, Brent Durbin, Ron Seyb, and the anonymous reviewers for helpful com-ments and suggestions. *Address correspondence to Howard J. Gold, Department of Government, Smith College, 10 Prospect Street, Northampton, MA 01063, USA; e-mail: [email protected].
doi:10.1093/poq/nfv033
at Monash University on November 24, 2015
http://poq.oxfordjournals.org/
elite-level partisan polarization crystallized in the 1990s and 2000s, several scholars argued that a partisan resurgence, rooted in this deepening polari-zation, took hold (Abramowitz and Saunders 1998; Hetherington 2001;
Green, Palmquist, and Schickler 2002; Stonecash, Brewer, and Mariani
2003; Saunders and Abramowitz 2004; Baumer and Gold 2010). Fiorina,
Abrams, and Pope (2011) countered that polarization was limited to
parti-san elites, and that these sharp divisions left a centrist majority with little representation.
In a Poll Trends article that appeared in Public Opinion Quarterly in 1996, Christian Collet (1996) examined perceptions of the parties and the party system. He presented survey data that showed discontent with the two-party system and strong support for a possible third-party candidate in presidential elections. Collet’s conclusions suggested that antipathy was directed toward the two-party system, and not toward the Democratic and Republican parties, both of which still commanded deep loyalty. He also found that the public wanted more choice at the polls, not necessarily the replacement of a major party by a new party. In short, Collet found significant discontent with the two-party system, but ambivalence about the electoral and governing prospects of a new party.
Collet’s article examined partisan polling trends through 1995. It appeared not long after H. Ross Perot ran one of the most successful third-party cam-paigns in American history, and was on the verge of a second presidential campaign. This article picks up where Collet left off, examining perceptions of the political parties and the party system from 1996 until 2014. There is reason to expect that attitudes toward the parties would have changed since the mid-1990s. The partisan-driven impeachment of President Clinton, two protracted wars, the economic downturn, and increasingly vitriolic partisan polarization, especially in Congress, may well have produced not only greater dissatisfac-tion with the two major parties, but also a heightened receptivity toward a new party competing on the national scene.
The analysis of trends in public opinion toward political parties is divided into three sections. The first examines how assessments of the Democratic and Republican parties changed since the mid-1990s; the second section describes how the public perceives differences between the parties; and the third exam-ines public satisfaction and dissatisfaction with the party system as well as the public’s openness to a new national third party.
Assessments of the Major Parties
Over the years, there has been no shortage of survey questions that ask Americans what they think of the Democratic and Republican parties. This has been asked in many different ways. Perhaps best known is the question that asks whether respondents have a favorable or unfavorable opinion of each
at Monash University on November 24, 2015
http://poq.oxfordjournals.org/
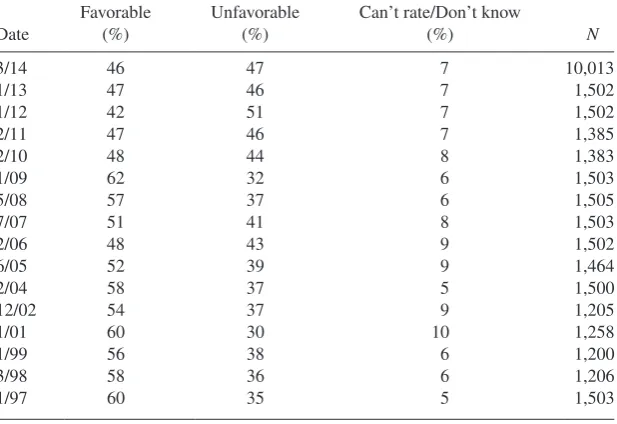
party. Tables 1 (Democrats) and 2 (Republicans) include the distribution of responses, going back to 1997.1
There are several noteworthy findings. First, there is no question that public esteem for both parties has fallen since the mid-1990s. In the early years of the time series, the Democrats’ favorability rating was at or just below 60 percent. In 2006, it dropped below 50 percent for the first time, and it has remained below that mark since 2010. In 2012, for the first time, the Democrats’ unfa-vorability rating was higher than its faunfa-vorability score.
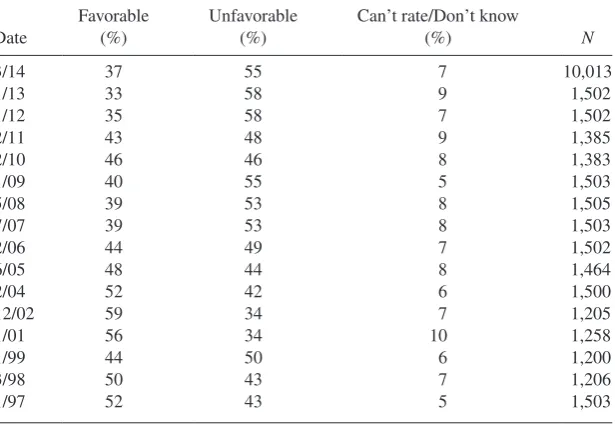
Perceptions of the Republicans followed a similar pattern. The party’s favora-bility rating dropped quite dramatically over the years. In the late 1990s and early 2000s, Republican Party favorability generally stood above the 50 percent mark. In recent years, it has not come close to that. In 2013, only one-third of Americans said they had a favorable opinion of the Republican Party, and the percentage of those unfavorable exceeded those favorable by an overwhelming 25 points (58 – 33). Although perceptions of both parties have deteriorated over time, the Republicans appear to have taken the brunt of growing public discontent.
The Republican Party has also consistently suffered from a lower favorability rating than the Democrats. This is true in all years except 2002. In some years, this gap has been very large—22 points in January 2009, for example. That
Table 1. Democratic Party Favorability
PEW: “Would you say your overall opinion of the Democratic Party is favorable or unfavorable?”
Can’t rate/Don’t know
(%) N
1. The data in tables 1 and 2 come from PEW. Both CBS and Gallup have asked the same party favorability question multiple times over these years, with very similar results.
at Monash University on November 24, 2015
http://poq.oxfordjournals.org/
large Democratic advantage no doubt reflected the positive feeling surround-ing the historic election of Barack Obama in November 2008. Other fluctua-tions over time similarly reflect major political developments. The one point at which the Republicans held an advantage was December 2002, shortly after the midterm elections and during the run-up to the Iraq War. But the Democrats’ favorability advantage has generally ranged from about five to ten points.
The pattern of growing discontent with the parties appears on other questions as well. The American National Election Studies (ANES) have consistently asked respondents to rate the parties on a 100-degree feeling thermometer. Tables 3, 4, and 5 present the percentage of respondents who express negative (below 50), neutral (50 degrees), and positive (above 50) ratings of each party, as well as their ratings of the “major parties” as an institution. For the Democrats, the percentage of people expressing a negative rating (37 percent) was higher in 2012 than it has been at any time since 1996.2 Similarly, negative affect toward the Republicans
grew by 13 percentage points (32 to 45) between 1996 and 2012. And not surpris-ingly, we find growing negative assessments of the “major parties”; 19 percent were negative in 1996, a figure that jumped to 29 percent in 2008. In all three cases, growing negativity has been the consequence of fewer people with positive ratings; the proportion of neutral respondents has remained fairly stable.
Table 2. Republican Party Favorability
PEW: “Would you say your overall opinion of the Republican Party is favorable or unfavorable?”
Can’t rate/Don’t know
(%) N
2. Indeed, it was higher in 2012 than it has been since 1978, when ANES first asked respondents to rate the parties on a feeling thermometer.
at Monash University on November 24, 2015
http://poq.oxfordjournals.org/
Table 3. Feeling Thermometer Ratings of the Democratic Party
ANES: “I’d like to get your feelings toward some of our political leaders and other people who are in the news these days. I’ll read the name of a person and I’d like you to rate that person using something we call the feeling thermometer. Ratings between 50 degrees and 100 degrees mean that you feel favorable and warm toward the person. Ratings between 0 degrees and 50 degrees mean that you don’t feel favorable toward the person and that you don’t care too much for that person. You would rate the person at the 50-degree mark if you don’t feel particularly warm or cold toward the person. How would you rate the DEMOCRATIC PARTY?”
Date
Table 4. Feeling Thermometer Ratings of the Republican Party
ANES: “I’d like to get your feelings toward some of our political leaders and other people who are in the news these days. I’ll read the name of a person and I’d like you to rate that person using something we call the feeling thermometer. Ratings between 50 degrees and 100 degrees mean that you feel favorable and warm toward the person. Ratings between 0 degrees and 50 degrees mean that you don’t feel favorable toward the person and that you don’t care too much for that person. You would rate the person at the 50-degree mark if you don’t feel particularly warm or cold toward the person. How would you rate the REPUBLICAN PARTY?”
Date
at Monash University on November 24, 2015
http://poq.oxfordjournals.org/
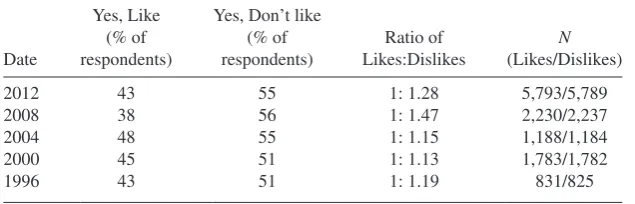
ANES also has asked respondents if there is anything in particular they like or dislike about the Democratic and Republican parties. The most notable shift has occurred on the Democratic side (see table 6). In 2012, for the first time, the percentage of individuals who expressed at least one dislike of the Democratic Party exceeded the percentage expressing a like. This marks a major change from prior years, where the ratio was consistently greater than one (see the third column of table 6). The Republicans have typically drawn more dislikes than likes, although that ratio was particularly unfavorable in 2008 (see table 7).
Perceptions of Partisan Difference
The evidence reviewed to this point indicates that Americans have grown increasingly negative toward both parties in recent years. One possible cause
Table 6. Democratic Party Likes and Dislikes
ANES: “Is there anything in particular that you LIKE/DON’T LIKE about the Democratic Party?”
2012 48 49 1: 1.02 5,797/5,797
2008 62 42 1: 0.68 2,242/2,245
2004 57 48 1: 0.84 1,181/1,185
2000 57 44 1: 0.77 1,784/1,778
1996 52 45 1: 0.88 827/825
Table 5. Feeling Thermometer Ratings of the Major Parties
ANES: “I’d like to get your feelings toward some of our political leaders and other people who are in the news these days. I’ll read the name of a person and I’d like you to rate that person using something we call the feeling thermometer. Ratings between 50 degrees and 100 degrees mean that you feel favorable and warm toward the person. Ratings between 0 degrees and 50 degrees mean that you don’t feel favorable toward the person and that you don’t care too much for that person. You would rate the person at the 50-degree mark if you don’t feel particularly warm or cold toward the person. How would you rate the MAJOR PARTIES?”
Date
at Monash University on November 24, 2015
http://poq.oxfordjournals.org/
is heightened partisan polarization. To what extent do Americans view the par-ties as different from each other, and has that changed over time?
To answer these questions, I examine three survey items that ask respond-ents about their perceptions of partisan difference and ideology. The first one, from ANES, asks respondents if they perceive important differences in what the major parties stand for (see table 8). The evidence here is decisive: we have seen a significant growth in the proportion of Americans who believe that there are major differences between the parties. In 1996, that figure was 64 percent, and by 2012, it had jumped to over 80 percent. It is apparent that, at a minimum, the public has recognized the growing elite-level polarization, and increasingly sees the parties as very different. Additional evidence supports this conclusion. The ANES also asks respondents where they place each party on a seven-point ideological spectrum (1 = liberal; 7 = conservative). Table 9
includes the mean placement of each party since 1996, along with the differ-ence between the respective means. Not surprisingly, Republicans are consist-ently rated as more conservative than Democrats. But the size of this gap has grown, such that by 2012, it exceeded 2.5 points (on a seven-point scale) for
Table 8. Differences between the Major Parties
ANES: “Do you think there are any important differences in what the Republicans and Democrats stand for?”
Date
Table 7. Republican Party Likes and Dislikes
ANES: “Is there anything in particular that you LIKE/DON’T LIKE about the Republican Party?”
2012 43 55 1: 1.28 5,793/5,789
2008 38 56 1: 1.47 2,230/2,237
2004 48 55 1: 1.15 1,188/1,184
2000 45 51 1: 1.13 1,783/1,782
1996 43 51 1: 1.19 831/825
at Monash University on November 24, 2015
http://poq.oxfordjournals.org/
the first time since ANES first asked this question in 1972. Interestingly, much of this change is the product of growing perceptions of the Democrats as lib-eral. Whereas the mean Republican placement has consistently been near the conservative end of the scale (above 5), the Democratic mean has been nearer to the midpoint of the scale (3.5), until 2012 (when it dropped to 2.66).
Questions asked by commercial survey organizations also support this find-ing that the public has increasfind-ingly come to view the Democrats as liberal, indeed “too liberal.” Since 2009, the proportion of Americans who perceive the Democratic Party as too liberal has been close to 50 percent, whereas in earlier years, it was at 40 percent or even below (see table 10). This has been accom-panied by a drop in the proportion of Americans who say that the Democrats’
Table 9. Placement of the Major Parties on the Seven-Point Liberal-Conservative Scale
ANES: “We hear a lot of talk these days about liberals and conservatives. Here is a seven-point scale on which the political views that people might hold are arranged from extremely liberal to extremely conservative. Where would you place the DEMOCRATIC/REPUBLICAN PARTY on this scale?” (1 = most liberal; 7 = most conservative)
2012 5.29 (5,672) 2.66 (5,684) 2.63 2008 4.95 (2,110) 3.31 (2,127) 1.64 2004 5.16 (1,091) 3.04 (1,097) 2.12 2000 5.17 (1,354) 2.95 (1,370) 2.22 1998 5.01 (1,122) 3.34 (1,142) 1.67 1996 5.08 (1,555) 3.19 (1,566) 1.89
Table 10. Perceptions of Democrats’ Ideology
Gallup: “In general, do you think the political views of the Democratic Party are too conservative, too liberal, or about right?”
Date
at Monash University on November 24, 2015
http://poq.oxfordjournals.org/
views are “about right.” On the Republican side, there has been greater stabil-ity over time, with those who see the party as too conservative holding steady at around 40 percent (see table 11). By 2010, the proportion perceiving the Republicans as too conservative was nine points lower than the proportion see-ing the Democrats as too liberal. This is one advantage the Democrats appear to have lost—the perception that they are a more mainstream party.
Evaluations of the Party System
In recent years, Americans have expressed more negativity toward both par-ties, and they have come to view the parties as more ideologically distinct. Have these patterns produced greater receptivity to possible changes in the party system, in particular the possibility of a new third party contesting national elections?
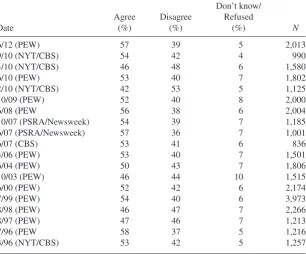
There have been various survey questions about the effectiveness of the two-party system. Regardless of the wording, strong support exists in recent years for more electoral choice. Since 1996, PEW (along with NYT/CBS and PSRA) has asked Americans if the country should have a third political party to compete with the Democrats and Republicans (see table 12). In most years, a majority of Americans agree that we need a third party—generally, 45–55 percent adopt this view. Likewise, large proportions (54–67 percent) sup-port the idea that third parties should run candidates for president, Congress, and state offices (see table 13). Interestingly, in spite of growing negativity toward the major parties, there is still a sizable minority—generally in the 40–50 percent range—that disagree with the statement that the country needs a third political party (see table 12). Some of the variation observed in these tables may be the product of wording differences employed by the various
Table 11. Perceptions of Republicans’ Ideology
Gallup: “In general, do you think the political views of the Republican Party are too conservative, too liberal, or about right?”
Date
Too conservative (%)
Too liberal (%)
About right (%)
No opinion
(%) N
5/10 40 15 41 4 1,049
6/09 43 17 34 6 1,011
2/08 43 15 38 4 1,016
10/06 42 14 38 6 1,002
11/02 34 10 51 5 1,014
2/99 39 12 45 4 1,034
11/98 39 15 41 5 1,039
10/96 41 13 41 5 1,229
at Monash University on November 24, 2015
http://poq.oxfordjournals.org/
survey organizations, but it appears that the public is open to the idea of a new national political party.
Since 2003, Gallup has asked a related question: Do the major parties do an adequate job of representing the American people? Only once (in 2003) did a plurality defend the two major parties (see table 14). Although the response patterns here have been volatile, in just about every other year more respond-ents have stated that a third major party is needed. In some years (2013, 2010, 2007), about 60 percent of respondents have expressed this view.
Other survey organizations have asked similar questions, albeit less con-sistently. In the question asked by NBC/WSJ (see table 15), only 12–15 per-cent state that the two-party system works fairly well. Instead, over half the respondents acknowledge that there are real problems with it, and about a third of respondents believe it is so broken that the country needs a third party. In
Table 12. Do We Need a Third Major Political Party?
PEW, PSRA/Newsweek: “Some people say we should have a third major (political) party in this country in addition to the Democrats and Republicans. Do you agree or disagree?”
NYT/CBS: “Some people say the country needs a third political party—a new party to compete with the Democratic and Republican parties. Do you agree or disagree?”
4/10 (NYT/CBS) 46 48 6 1,580
6/10 (PEW) 53 40 7 1,802
2/10 (NYT/CBS) 42 53 5 1,125
10/09 (PEW) 52 40 8 2,000
6/08 (PEW 56 38 6 2,004
10/07 (PSRA/Newsweek) 54 39 7 1,185 6/07 (PSRA/Newsweek) 57 36 7 1,001
6/07 (CBS) 53 41 6 836
3/96 (NYT/CBS) 53 42 5 1,257
at Monash University on November 24, 2015
http://poq.oxfordjournals.org/
a variation of this question (see table 16), over half of respondents surveyed in 2007 stated that the two-party system does not do a good job of addressing important issues, a large jump from when this question was first asked in 1999.
Although there is deep discontent with the two-party system and support for greater electoral choice, in most elections, support for third parties is very weak. Yet, when asked generically whether they would consider voting for a third-party candidate, sizable majorities say they would (see table 17). In eight polls conducted between 1999 and 2013, between 52 and 67 percent of respondents said they would consider voting for a third-party presidential candidate. Of course, stating that one will “consider” voting for a third party poses a low threshold. That becomes apparent when the stakes are raised and respondents are asked to specify how “likely” it is that they will vote, or con-sider voting, for a generic third-party candidate. Whereas 50–65 percent ini-tially state that they will consider voting for a third-party candidate, only about one-third of respondents state that it is “likely” that they will vote, or even consider voting, for a third party (see table 18).
Other questions have been asked over the years that shed more light on the public’s ambivalence toward changing the two-party system. Unfortunately, these questions have not been asked consistently. Nevertheless, evidence exists showing that sizable majorities believe that a third party would raise issues that the major parties do not address (58 percent, CBS/NYT, March 1996); that voting for a third-party candidate sends an important message that the political system needs to change (55 percent, FOX, June 1999); and that it would be good for the country if a third-party candidate were to win the
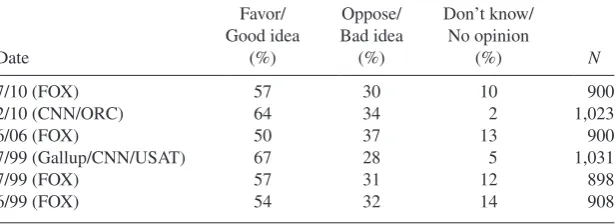
Table 13. Should Third Parties Run Candidates?
CNN/ORC, Gallup/CNN/USAT: “Would you favor or oppose having a third political party that would run candidates for president, Congress, and state offices against the Republican and Democratic candidates?”
FOX: “In general, do you think it would be a good idea or bad idea if a third national political party were formed that would run candidates for president, Congress, and state offices against the Republican and Democratic candidates?”
2/10 (CNN/ORC) 64 34 2 1,023
6/06 (FOX) 50 37 13 900
7/99 (Gallup/CNN/USAT) 67 28 5 1,031
7/99 (FOX) 57 31 12 898
6/99 (FOX) 54 32 14 908
at Monash University on November 24, 2015
http://poq.oxfordjournals.org/
Table 15. Is the Two-Party System Broken?
NBC/WSJ: “Which of the following statements is closest to your own view of the two-party system today, in terms of how well it defines issues and provides choices for voters? The two-party system works fairly well. The two-party system has real problems, but with some improvements it can still work well. The two-party system is seriously broken, and the country needs a third party.” but can still work well
(%)
Table 14. Do Major Parties Adequately Represent the American People?
Gallup, Gallup/CNN/USAT 1: “In your view, do the Republican and Democratic parties do an adequate job (of) representing the American people, or do they do such a poor job that a third major party is needed?” Gallup/USAT 2: “In your view, do the Republican and Democratic parties do an adequate job of representing the American people, or would you like there to be a third major party as well?”
NYT/CBS: “In your view, do the Republican and Democratic parties do an adequate job of representing the American people, or do they not do an adequate job and a third major party is needed?”
Date
10/13 (Gallup) 26 60 14 1,028
9/12 (Gallup) 45 46 9 1,017
12/11 (Gallup/USAT 1) 32 54 10 1,034
9/11 (Gallup) 38 55 8 1,017
4/11 (Gallup/USAT 1) 40 52 8 1,013 8/10 (Gallup/USAT 1) 35 58 7 1,021
2/10 (NYT/CBS) 27 59 14 1,125
9/08 (Gallup) 47 47 6 1,007
9/07 (Gallup) 39 57 4 1,010
7/07 (Gallup/USAT 1) 33 58 10 1,014
9/06 (Gallup) 45 48 7 1,002
6/06 (Gallup/USAT 2) 40 54 3 1,000 10/03 (Gallup/CNN/USAT) 56 40 4 1,004
at Monash University on November 24, 2015
http://poq.oxfordjournals.org/
2008 presidential election (45 percent good, 19 percent bad; FOX, June 2007). At the same time, there is lingering doubt that American democracy would work any better with a viable third party. In 1996, a plurality of respondents expressed the view that the effectiveness of American democracy would not be enhanced by the creation of a third party (46 percent, National Survey on Democracy, January 1996). That same year, a majority (53 percent) stated that a third party would not make much difference in producing better candidates (NYT/CBS, March 1996). In 2000, a majority (55 percent) held that third parties end up hurting the election by taking votes away from the major par-ties (LAT, July 2000). And, on the one question that was replicated over time, strong majorities held that third parties would not make much difference in giving ordinary people more say in government. In 1996, 56 percent held that position; in 2010, 60 percent expressed that view (see table 19).
Conclusion
In his 1996 POQ Poll Trends article, Collet concluded that the American public expressed “extreme discontent” toward the party system, though not toward the two parties themselves, and that Americans supported the notion of a new national third party, but would not translate that hypothetical sup-port into supsup-port for a particular third party. Almost twenty years later, we are still in a period of “extreme discontent,” but this discontent now extends beyond the party system to the two major parties themselves, and the public is still conflicted between its attachment to the existing parties and a restructuring of the party system that would see the emergence of a new national third party. There is no question that public disdain for both the Democratic and Republican parties has grown considerably since the mid-1990s, and that the public understands well the polarization that has gripped political elites. Increasing numbers of Americans have come to see the parties as ideologically far apart, with large percentages stating that the Republicans are too conservative and that the Democrats are too liberal. Paradoxically, although the public is turned off by ideological parties, there
Table 16. Does the Two-Party System Address Important Issues?
“In general, do you think the two-party system does a pretty good job of addressing issues that are most important to people like you, or not?”
Date
Yes, pretty good job
(%)
No, not a good job
(%)
Don’t know
(%) N
6/07 (PSRA/Newsweek) 37 57 6 1,001
5/07 (WP/Kaiser) 45 53 2 2,140
10/99 (PSRA/Newsweek) 54 39 7 400
at Monash University on November 24, 2015
http://poq.oxfordjournals.org/
is also evidence that partisans have become more critical of their own party for not upholding traditional “liberal” and “conservative” values (PEW, January 2014).
Despite consistent majorities and pluralities who believe that the coun-try needs a third political party and that the Democrats and Republicans inadequately represent the people, only a minority of Americans are likely to consider voting for a third-party candidate—this has remained fairly
Table 17. Consider Voting for Third-Party Candidate
FOX 1: “In the next election, would you consider voting for a third-party presidential candidate?”
FOX 2: “Would you consider voting for a presidential candidate you like who is a third-party candidate?”
Reason-Rupe: “Would you consider voting for an independent or third-party candidate for president in 2012?”
Democracy Corps (Greenberg Quinlan Rosner Research): “Please tell me whether the first statement or the second statement comes closer to your own view, even if neither is exactly right. First statement: I would consider voting for a third-party candidate in next year’s (2012) presidential election. Second statement: I would not consider voting for a third-party candidate in next year’s presidential election.
Harris: “Thinking of the presidential election next year (2008), would you consider voting for an Independent candidate who is not a Democrat or Republican?”
Ayres, McHenry, and Associates (Party Control of Congress and Third Parties Survey): “There has been a lot of discussion lately about the possibility of third-party candidates running for president (in 2000). Would you consider voting for a third-party candidate for president, rather than either the Democratic or Republican nominees?”
Date
8/11 (Reason-Rupe) 53 25 19 4 1,200 (8/11 Democracy Corps) 53 42 NA 4 1,000 3/11 (Reason-Rupe) 60 17 20 2 1,200
7/07 (Harris) 66 30 NA 3 1,010
6/07 (FOX 2) 67 25 NA 8 900
9/99 (A, McH, and Assoc.) 52 37 NA 11 1,000
Note.—NA, not applicable.
at Monash University on November 24, 2015
http://poq.oxfordjournals.org/
consistent over time. And there is plenty of ambivalence about the ben-efits of a third party for American democracy. Unfortunately, many of the questions that measure attitudes toward third parties and the party system are asked sporadically, and more commonly when a prominent third-party candidate (like Perot) emerges. This not only creates an obvious context effect; it also hampers our ability to understand the public’s long-term views of the party system. Still, the best evidence suggests that although the Democratic and Republican parties have become the object of deepen-ing disapproval and even contempt, the American public is not quite ready to let go of them.
Table 18. Likelihood of Voting for a Third Party-Candidate
AP/Yahoo, LAT 1: “Regardless of how you plan to vote in this particular election (2000, 2008), how likely would you be to consider voting for a third-party candidate? Likely, not likely.”
LAT 2: “Some people think it’s a good idea to vote for third-party or independent candidates while others think that’s a waste of one’s vote. Will you consider voting for an independent or third-party candidate for president in 1996, or will you most likely decide between the nominees of the Democratic and Republican parties? (If would consider independent/ third party, ask:) Will you be very likely or somewhat likely to vote for an independent or third-party candidate for president?”
Date
1/08 (AP/Yahoo) 33 66 1 2,016
12/07 (AP/Yahoo) 32 68 NA 1,821
7/00 (LAT 1) 37 61 2 1,058
04/96 (LAT 2) 31 57 12 1,374
Note.—NA, not applicable.
Table 19. Will a Third Party Give People More Say?
NYT/CBS: “If a third political party were created, do you think that would give people like you more say in the government, or wouldn’t a third party make that much difference?”
at Monash University on November 24, 2015
http://poq.oxfordjournals.org/
Appendix
Abbreviations
A, McH, and Assoc.: Ayres, McHenry, and Associates ANES: American National Election Studies
AP: Associated Press
CBS: Columbia Broadcasting System CNN: Cable News Network
FOX: Fox News LAT: Los Angeles Times
NBC: National Broadcasting Corporation NYT: New York Times
PEW: Pew Research Center for the People & the Press ORC: Opinion Research Corporation
PSRA: Princeton Survey Research Associates WP: Washington Post
WSJ: Wall Street Journal USAT: USA Today
The survey results reported in this article were obtained from searches of the iPOLL Databank provided by the Roper Center for Public Opinion Research at the University of Connecticut (http://www.ropercenter.uconn.edu/) and from the American National Election Studies (http://www.electionstudies. org). Unless otherwise noted, all surveys were conducted by telephone inter-views with national adult samples.
ANES (RR1): Data from ANES 1996–2012 pre- and post-election surveys. Mode of interview was face-to-face (FTF) for all years, except for a split-mode design in 2000 (FTF and telephone subsample) and in 2012 (FTF and Internet subsample). 1996, 59.8%; 1998, 63.9%; 2000, 60.5%; 2004, 58.2%; 2008, 59.5%; 2012, 38% (FTF), 2% (Internet).
AP/Yahoo (RR2): Conducted by Knowledge Networks. Online interviews.
12/07, 12.6%; 1/08, 12.4%.
CBS (RR1): 6/07, 9.03%.
FOX (RR3): 2011–2013 polls conducted by Anderson Robbins Research and Shaw and Company Research; polls prior to 2011 conducted by Opinion Dynamics. 6/99, 7.5%; 7/99, 8%; 6/06, 5.7%; 6/07, 7.6%; 7/10, 6.8%; 8/11, 16.6% (landline), 10.1% (cellular); 10/13, 8% (landline), 5.3% (cellular).
Gallup (RR3): 11/98, 35%; 2/99, 20%; 7/99, 24%; 11/02, 17%; 10/03, 16%;
6/06, 16%; 9/06, 16%; 10/06, 16%; 9/07, 13%; 2/08, 11%; 9/08, 15%; 6/09, 13%; 5/10, 8%; 8/10, 9%; 4/11, 8%; 9/11, 10%; 9/12, 11%; 10/13, 6%.
NYT/CBS (RR1): 2/10, 10.45%; 4/10, 9.53%; 9/10, 8.95%.
at Monash University on November 24, 2015
http://poq.oxfordjournals.org/
PEW (RR3): 1/01, 31%; 10/03, 27.3%; 2/04, 32.8%; 6/04, 30.3%; 6/05, 28.8%; 2/06, 22.2%; 4/06, 27.8%; 7/07, 16.7%; 5/08, 19.7%; 6/08, 21.8% (landline), 23.3% (cellular); 1/09, 20.4% (landline), 21.1% (cellular); 11/09, 18.5% (landline), 9.9% (cellular); 2/10, 21.5% (landline), 13.3% (cellular); 6/10, 12.9% (landline), 9.2% (cellular); 2/11, 13.5% (landline), 6.6% (cel-lular); 1/12, 10.7% (landline), 6.4% (cel(cel-lular); 6/12, 11.3% (landline), 5.6% (cellular); 1/13, 10.4% (landline), 5.9% (cellular); 3/14, 11.2% (landline), 9.8% (cellular).
PSRA/Newsweek (RR3): 6/07, 25.8%; 10/07, 24.7%.
Response rates for other surveys were requested but not available.
References
Abramowitz, Alan, and Kyle Saunders. 1998. “Ideological Realignment in the US Electorate.”
Journal of Politics 60:634–52.
Baumer, Donald, and Howard Gold. 2010. Parties, Polarization, and Democracy in the US. Boulder, CO: Paradigm.
Beck, Paul Allen. 1976. “A Socialization Theory of Partisan Realignment.” In Controversies in American Voting Behavior, edited by Richard Niemi and Herbert Weisberg, 396–411. San Francisco: Freeman.
Campbell, Angus, Philip Converse, Warren Miller, and Donald Stokes. 1960. The American Voter. New York: Wiley.
Collet, Christian. 1996. “The Polls—Trends: Third Parties and the Two-Party System.” Public Opinion Quarterly 60:431–49.
Fiorina, Morris, Samuel Abrams, and Jeremy C. Pope. 2011. Culture War? The Myth of a Polarized America. New York: Pearson Longman.
Green, Donald, Bradley Palmquist, and Eric Schickler. 2002. Partisan Hearts and Minds: Political Parties and the Social Identities of Voters. New Haven, CT: Yale University Press. Hetherington, Marc. 2001. “Resurgent Mass Partisanship: The Role of Elite Polarization.”
American Political Science Review 95:619–39.
Nie, Norman, Sidney Verba, and John Petrocik. 1976. The Changing American Voter. Chicago: University of Chicago Press.
Polsby, Nelson. 1983. Consequences of Party Reform. New York: Oxford University Press. Saunders, Kyle, and Alan Abramowitz. 2004. “Ideological Realignment and Active Partisans in
the American Electorate.” American Politics Research 32:285–309.
Stonecash, Jeffrey, Mark Brewer, and Mack Mariani. 2003. Diverging Parties: Social Change, Realignment, and Party Polarization. Boulder, CO: Westview Press.
Wattenberg, Martin. 1998. The Decline of American Political Parties, 1952–1996, 5th ed. Cambridge, MA: Harvard University Press.
at Monash University on November 24, 2015
http://poq.oxfordjournals.org/