The Causality Relationship between Management in Supply
Chain Collaboration with the Prosperity of Corn Farmers in
West Nusa Tenggara – Indonesia
Tajidan1*, Budi Setiawan2, M. Muslich Mustadjab2 and A. Wahib Muhaimin2 1
Doctoral student of Agricultural Science Program, Major in The Agricultural Economics, University of Brawijaya, Malang, East Java.
2
Lectures in The Faculty of Agriculture, Department of Agricultural Economics, University of Brawijaya, Malang, East Java.
*
E-mail of the Corresponding author: m.tajidan@gmail.com
Abstract
The objective of this research is to analyze factors determining the supply chain management and the prosperity of corn farmers. Data was collected using survey method by interviewing 120 farmers. The chain sampling was determined using snowballing technique from farmers to intermediate traders and consumers.
Result of the research indicates that the supply chain management is influenced by business process integration, supply chain collaboration and organizational performance. The prosperity rate of the farmers is directly influenced by supply chain management, supply chain collaboration, and organizational performance, but it is indirectly influenced by business process of integration and of competitive advantage.
Keywords: supply chain collaboration, business process integration, supply chain management, organizational performance, and the prosperity of corn farmers.
1. Introduction
There is a sharp increase of corn production of West Nusa Tenggara Province in the last 10 years. The increase rate is about 22.36 %year-1, which is much higher than the increase rate of national corn production of 4.55 % year-1 (Sjah, 2011).
Thisis because of the increase of land area and productivity of corn. Corn harvest area in West Nusa Tenggara increases from 24,969 ha in 2001 to 64,529 ha in 2010, while land productivity enhances from 20.34 quintals ha -1
to 38.09 quintals ha-1at the same period (BPS NTB, 2011).
West Nusa Tenggara local government has implemented a grand strategy for developing corn agribusiness by targeting corn production of 613,496 tons in 2013, which can be achived by increasing the productivity to 40-50 quintals ha-1 through applying agricultural science and technology, and also appropriate and efficient post-harvest management (Diperta NTB, 2009; Pemda NTB, 2009).
To do so, farmers’ behavior and capacity are very crucial to be developed, which in turn will create better farmers’ prosperity. Improving farmers’ prosperity is the task of many stakeholders. Their prosperity must be improved in order to increase their interest in farming corn (Sadikin, 1999; Hadijah, 2009).
Improvement of the prosperity of corn farmers needs the presence of a specific organization in order to protect farmers from the risk and loss due to the decrease of output price and the increase of input price (Karyasa and Sinaga, 2004). This improvement can be achieved if good supply chain management is implemented (Bansod and Barode, 2007; Kustiari and Nuryanti, 2009; Roekel, et al., 2002).
Good practice of supply chain management can play a significant role to anticipate the tight market competition by giving the acceptable sale price for certain commodity to the customers (Hamid, 2011; Hendratman, 2009). The application of good supply chain management in the corn agribusiness is expected to produce better condition through inter-organizational coordination supported by information system and also through the distribution of incentive share based on value chain and marketing function (Kamalabadi, et al., 2008; Pawisari, 2011). This will in turn give direct or indirect influence to increased prosperity of corn farmers. Therefore, the relationship in the supply chain management is not only to the transactional relationship, but also involves mutual collaboration (Hartono and Muhaimin, 2009; Sidarto, 2009).
Based on the supply chain collaboration theory, it is asserted that collaboration is a driving force to produce effective supply chain management because it helps organization or company to share risk and to access required resources. Supply chain collaboration allows the cooperation made between organization and company to increase the power of supply chain management (Mathuramaytha, 2011; Utomo, 2011). Therefore, the farmers as the main actor of raw material producer, and also as the organization involved within supply chain, are deserved to get similar incentive as obtained also by intermediary traders and user customers.
(Sadikin, 1999; Imran, 2007). The failure of supply chain collaboration may break the cooperative relationship between farmers and company because farmers do not receive reasonable incentive for their resource use. Proportional incentive share may ensure the sustainability of long-term cooperative relationship (Batt, 2003; Dwyer, et al., 2007; Sinjal, 2009).
The improvement of supply chain management and that of the prosperity of corn farmers are very important to consider. This paper reports the causality relationship between management in supply chain collaboration and the prosperity of corn farmers in West Nusa Tenggara Province.
2. Review of Literature
2.1. Supply Chain Collaboration Theory
The collaboration has been proved as the power which drives supply chain management, and therefore, it can be called as core competence. Indeed, the collaboration between organizations engaged within supply chain may help the achievement of potential advantage (Irmawati, 2007; Adinugroho, 2010). Supply chain collaboration theory also explains the demand at certain level of organization and the identification of this demand allows organization members to be successful in the collaboration (Mathuramaytha, 2011).
Many studies have examined collaboration in recent years (Mentzeret al., 2001; Guangyinet al., 2010; Adinugroho, B., 2010; Safiee, et al., 2011). The current research elaborates the implementation of supply chain collaboration to achieve competitive advantage through sharing information, making collective decision, sharing and obtaining bigger profit, and improving consumer satisfaction, compared to standalone activity (Thomas and Grifin, 1996; Hervani, et al., 2005; and Widodo, et al., 2011). The collaboration concept includes 3 (three) dimensions: information sharing, decision synchronization and incentive harmony (Mathuramaytha, 2011; Wang and Chiung, 2004).
Supply chain collaboration supports competitive advantage of company. It determines how far an organization protects its product against rival. Competitive advantage comprises to 5 (five) dimensions such as: competitive price, premium price, value to customers, dependable delivery, and production innovation (Mathuramaytha, 2011).
The concept of theoretical model of supply chain collaboration is adopted from the integration of the index system for supply chain measurement from Guangyin, et al. (2010) and the financial indicator from Safiee, et al. (2011). Moreover, this concept of collaboration model is also empowered by customer satisfaction from Mentzer,et al. (2001) and the ratio of producer surplus to total variable cost as the market performance indicator from Just,et al. (2004).
The concept of theoretical model of supply chain collaboration from Mathuramaytha (2011) is related with the prosperity of farmers as the main actor of corn supply chain. Therefore, this concept is not only analyzing the relationship between organizational and supply chain management, but also examining the influence of supply chain management on the prosperity of corn farmers.
2.2. Competitive Strategy Theory
The difference between supply chain and non-supply chain is on how the competition is perceived. In the supply chain, whole organizations in the supply chain are competing against other supply chain, not each organization against other as in non-supply chain (Christopher and Towill, 2001; Anatan and Ellitan, 2008).
Competitive advantage is found in the consumer level and thus, the success or failure of supply chain is determined by final consumer. Competitive advantage is also determined by the ability to provide appropriate quality and quantity of product, appropriate price, and appropriate schedule which are then responded positively by consumers. In other word, the company can maximize consumer satisfaction by understanding the change of market situation.
A producer must produce a product with certain quality with minimal cost (Huang, et al., 2003). Internal relative competence of supply chain to minimize the cost of certain product quality is called as comparative advantage. The combination between comparative and competitive advantages is an integral part of supply chain strategy to win the competition.
The combination of comparative and competitive advantages of a product is a responsibility and a coordination of integrator in applying or adapting competitive strategy theory. This competitive strategy theory is developed by Michael F. Porter from Harvard Business School. This competitive strategy theory is then known as Porter’s five forces analysis. This analysis compares a product against market, by which a product is “suitable” to market if five forces show an increase of profit of the product, and if it is “not suitable”, these five forces show a decrease of product profit. These five forces, according to Porter (1998), are as the following: (1) threat of new entrants; (2) bargaining power of suppliers; (3) bargaining power of buyers; (4) threat of substitute products; and (5) competitive rivalry within the industry.
processing industry company. However, the processing industry company expects lower purchasing price to obtain surplus from the intermediate traders, and therefore, the intermediate traders suppress the price at farmer level to increase their profit margin.
2.3. Business Process Integration
Integration business model, or collaboration model, has been suggested as a business approach which allows company to combine local and global information to conduct a multi-focuses and flexible process (Wang and Chiung, 2004). This argument is supported by Spekman, et al. (2001) by saying that the integration of process at multi-enterprises level will influence the increase of competitive advantage of company and the increase of company is activity in supply chain through value creation (Anatan and Elitan, 2008; Wilson, 1995).
3. Research Method
3.1. Location of Research
The research was conducted in East Lombok in the administrative area of West Nusa Tenggara Province. Research location was determined by using purposive sampling (Nazir, 1983). The number of respondents in each village was determined by proportional random sampling technique with a total number of respondents of 120 corn farmers; 75 farmersfrom Northern Pringgabaya village in Pringgabaya District and 45 farmersfromBebidas village in Wanasaba District.
Data were collected using survey and direct interview (Cochran, 1973; Lipton and Moore, 1980; Suryabrata, S., 1983; Vredenbregt, 1984; Zulganef, 2008; Daniel, et al., 2011). Some data were collected from the corn farmers. Snowball Sampling method was used to explore the product flow from farmers to intermediate traders until the user consumers of corn. All data were collected in March, April and May of 2013 using questionnaire.Additional data were collected using in-depth interview with some farmers, traders, agricultural counselors, company managers and user consumers.
3.2. Model, Variable and Measurement Scale
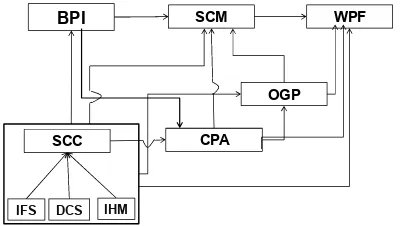
The important variables wwhich are believed as the factors determining the supply chain management and the prosperity of corn farmers are arranged within Path Diagram (Jogiyanto, 2002; Yamin and Kurniawan, 2002; Ferdinan, 2002; Pindyck and Rubinfield, 1991), and it is shown at Figure 1.
OGP
CPA SCC
IFS DCS IHM
BPI SCM WPF
Figure 1. Path Diagram of Research Model Design
Factors determining supply chain management (SCM) are collaboration (SSC), competitive advantage (CPA), organizational performance (OGP), and business process integration (BPI), while factors determining the prosperity of farmers are SCM, SSC, CPA, and OGP. Factors determining SCC are information sharing (IFS), decision synchronization (DCS) and incentive harmony (IHM). Business process integration is correlated with supply chain collaboration. The relationship between variables is arranged in a positive linear model.
Each variable is measured by Likert Scale from 1 to 5 where 1 = strongly disagree, 2 = not agree, 3 = almost agree, 4 = agree, and 5 = strongly agree (Ghozali, 2011).
3.3. Data Analysis
4. Factors Determining The Supply Chain Management and The Prosperity of Corn Farmers
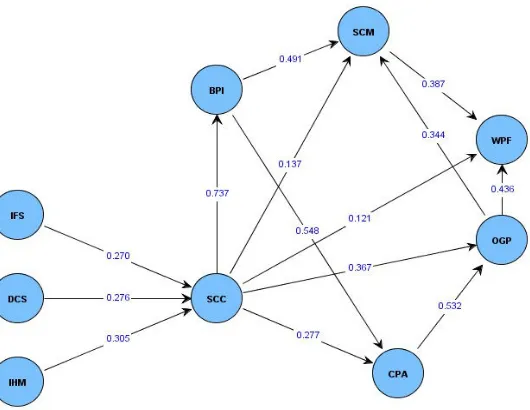
Using 95 % confident level, the hypotheses were accepted, except that competitive advantage does not significantly influence supply chain management and prosperity of farmers. It is described in Figure 2 and see Table 1.
4.1 Factors Determining The Supply Chain Management
Supply chain management has positive relationship with, and influenced by, business process integration, supply chain collaboration and organizational performance. Result of SEM analysis indicates that: SCM = 0.491 BPI + 0.137 SCC + 0.344 OGP
(p) (0.000) (0.015) (0.000) Explanation: p=probability value
Interpretation of SEM analysis is as follows:
BPI SCM: the higher business process integration, the higher supply chain management level; SCC SCM: the higher supply chain collaboration, the higher supply chain management level; OGP SCM: the higher organizational performance, the higher supply chain management level.
The supply chain management is measured with four indicators, namely inter-organizational coordination, product flow, service flow, and capital flow. These indicators are the strategy to improve the prosperity of farmers. They differs from the previous method where the prosperity of farmers is determined by the integration of farmers’ business and company business, and also by the increase of organizational performance. Moreover, organizational performance is measured with four indicators i.e. consumer surplus, consumer satisfaction, sale volume and ratio of profit/capital. The improvement of surplus and consumer satisfaction will increase the supply chain management through the change of competitive advantage (Spekman, et al., 2001; Anatan and Ellitan, 2008).
Figure 2. Path Coefficient of Factors Determining of The Supply Chain Management and Prosperity of Corn Farmers
Participation of farmers in supply chain collaboration is determined by information sharing, decision synchronization and incentive harmony. Farmer participation can also have direct and indirect influence on the supply chain management. This indirect influence is through the participation of farmers in the business process integration, which is the integration of post-production, transportation, and direct transaction with company. The indirect influence may evident also through the improvement of competitive advantage by producing higher quality corn, or by having direct transaction with the user consumers to improve consumer satisfaction and to take surplus from intermediate traders or middleperson.
The prosperity of corn farmers (WPF) is determined directly or indirectly by supply chain collaboration (SCC). The indirect influence is through the business process integration (BPI) and the supply chain management (SCM) in one hand, and through competitive advantage (CPA) and organizational performance (OGP) in other hand. These direct and indirect influences have strong positive impact on all variables analyzed (see into Table 1). The prosperity of farmers is directly and significantly determined by supply chain management, supply chain collaboration and organizational performance. SEM analysis of the results is as follows:
WPF = 0.387 SCM + 0.436 OGP + 0.121 SCC (p) (0.000) (0.000) (0.029) Explanation: p = probability value
Interpretation of SEM analysis as is follows:
SCM WPF: the higher supply chain management, the higher prosperity of farmers; SCC WPF: the higher supply chain collaboration, the higher prosperity of farmers; OGP WPF: the higher organizational performance, the higher prosperity of farmers.
Organizational performance, surplus indicator and consumer satisfaction, and also sale volume and ratio of profit/capital of intermediate traders, may have direct and positive influence which is indirectly determined by the increase of competitive advantage of the company and intermediary traders. It is also usable as the strategy for the increase of the prosperity of farmers in the future, which is fostering the farmers to produce corn product with greater quality and more suitable to consumer taste (Chinderhouse and Towill, 2001). This strategy may involve the use of specific variety, which is favored by consumers, and the determination of harvest time until 120 days since planting. The important thing needs to be considered is that the schedule of the plant such that the harvest can be made in series and based on the capacity of drying site. Simultaneous planting may slow the drying process which in turn may reduce the quality of corn product.
Previous research has shown that the participation of farmers in the supply chain collaboration is determined by information sharing, decision synchronization, and incentive harmony. The participation gives positive impact by being core competence to drive the performance of supply chain management (Mathuramaytha, 2011; Cachon and Lariviere, 1999). It is also mentioned that better supply chain management will improve the prosperity of farmers. It may be logically said that the improvement of supply chain collaboration directly influences the prosperity of farmers.
The participation of farmers in determining appropriately harvesting schedule in order to increase competitive advantage is still very low. Also, there are very few farmers engaged in post-production activities. Therefore, competitive advantage of company does not have significant influence on the improvement of the prosperity of farmers and the improvement of the performance of supply chain management. The influence of competitive advantage is only confined to the indirect influence through organizational performance.
5. Conclusions and Recommendations
5.1. Conclusions
A number of conclusions can be drawn from this research:
1. The supply chain management is direcly determined by business process integration, supply chain collaboration, and organizational performance; and indirectly determined by competitive advantage.
2. The prosperity of corn farmers is directly determined by the supply chain management, organizational performance and supply chain collaboration; and indirectly by competitive advantage and business process integration.
3. Business process integration has positive relationship with supply chain collaboration. 5.2. Recommendations
Findings from this research offer many useful insights for managers and have been utilized in some local governments to make affirmative policies and operational changes:
1. The improvement of the prosperity of corn farmers can be achieved through the improvement of the supply chain management;
2. Affirmative policies need to be protected for corn farmers by purchasing the exsessive supply of maize at the harvesting time ;and
3. Further research relationship between business process integration and competitive advantage improvement of companies is needed to be carried out.
Acknowledgement
References
Adinugroho,B., ( 2010). Manajemen Rantai Pasok (Studikasus :Frida Agro Kecamatan Lembang Kabupaten Bandung Barat). Faculty of Economics dan Management. Bogor Agriculture Institute. Bogor.
Anatan, L. dan Ellitan, L., (2008.), Supply Chain Management: Theory and Application. Alfabeta. Bandung. Bansod, S.V. dan Borade, A.B., (2007). Domain of Supply Chain Management – A State of Art. Journal of Technology Management & Innovation. Vol.2 Issue 4.p. 109-121.
Batt,PJ. (2003), Building Long Term Buyer Seller Relationships in Food chains. Proceeding International Farm Management Congress 2003, 10-15 August 2003. Perth. Western Australia.
BPS NTB, (2011), NTB Dalam Angka. Badan Pusat Statistik Province of West Nusa Tenggara. Mataram. Cachon, G.P. dan Lariviere, M.A., (1999), Capacity Choice and Allocation : Strategic Behavior and Supply Chain Performance. Management Science. Institute for Operations Research and Management Sciencees. Vol.45 No. 8. Augusts 1999. p.1091-1108.
Childerhouse, P. dan Towill, D.R., (2002), Analysis of Factors Affecting Real-Word Value Stream Performance. International Journal of Production Research 40. p.3499-3518.
Christopher, M., Towill, D.R., (2001), An Integrated Model for the Design of Agile Supply Chains. International Journal of Physical Distribution and Logistics Management 31 (4) pp.235-246.
Cochran, (1973) Sampling Design for Social Science. Cambrige University Press. New York.
Daniel,M., Darmawati, Nieldalina, (2011) PRA (Participatory Rural Appraisal: Pendekatan Efektif Mendukung Penerapan Penyuluhan Partisipatif dalam Upaya Percepatan Pembangunan Pertanian. Bumi Aksara. Medan. Diperta NTB, (2009) Program Unggulan Dinas Pertanian Tanaman Pangan Province of West Nusa Tenggara. Mataram.
Dwyer,F.R., Shurr, P.H. dan S. Oh, (1987) Developing Buyer – Seller Relationships. Journal of Marketing. 52(2), p.11-27.
Ferdinand,A., (2002) Structural Equation Modeling DalamPenelitianManajemen. BP Undip. Semarang.
Ghozali,I., (2011) Structural Equation Modeling: Metode Alternatif dengan Partial Least Square - PLS. Badan Penerbit Undip. Semarang.
Guangyin,X., Xianyang, Z., dan Jianhua, Q.U., (2002). Study on Index System of Supply Chain Performance Appraisal. Agricultural University. Zhenzhou.p.567
Hadijah, A.D., (2009). Identifikasi Kinerja Usahatani dan Pemasaran Jagung di NTB. Proseding Seminar Nasional Serealia. ISBN, 978-979-8940-27-9.
Hamid,H., (2011). Hubungan Antara Praktik Rantai Pasok, Rantai Permintaan, Keunggulan Kompetitif dan Kinerja Perusahaan: Studi Pada Perusahaan-perusahaan Konstruksi di Tarakan City – East Kalimantan. Gajah Mada University. Yogyakarta.
Hartono,R. dan A.W. Muhaimin, (2009). Analisis Rantai Pasokan Emping Melinjo: Studi Kasus pada Agroindustri Emping Melinjo di Desa Pojok, Ngantru, Tulungagung. East Java. Agritek Vo.17 No.5. p.865-873 Hedratman,D., (2009). Analisis Pengaruh Kualitas Hubungan Bisnis dengan Outlet dan Strategi Pelayanan Outlet Terhadap Kinerja Penjualan dalam Meningkatkan Loyalitas Outlet: Studi Kasus PT Indosat Semarang. Study Program of Magister Management Postgraduate Diponegoro University. Semarang.
Hervani,A.A., M.M.Helms dan J.Sarki, (2005). Performance Measurement for Green Supply Chain Management. Benchmark. International Journal 12, p.330-353.
Huang, G.G., J.S.K. Lau dan K.L. Mak, (2003), The Impact of Sharing Production Information on Supply Chain Dynamics. A Review of Literature. International Journal of Production Research 41, p.1483.1517.
Irmawati, (2007). Pengaruh Manajemen Rantai Pasokan terhadap Kinerja di PTPN VIII Gunung Mas Bogor. Department of Management. Faculty of Economic and Management. Bogor Agriculture Institute. Bogor.
Imran, A. (2007). Dampak Kebijakan Ekonomi dan Perubahan Faktor Eksternal Terhadap Kinerja Pasar Jagung dan Produk Turunannya di Indonesia. Scholl of Postgraduate, Bogor Agriculture Institute. Bogor.
Jogiyanto, (2002). Konsep dan Aplikasi Structural Equation Modeling Berbasis Varian Dalam Penelitian Bisnis. UPP STIM YKPN. Yogyakarta.
Just,R.E., D.L. Hueth dan A.Schmitz, (2004). The Prosperity Economics of Public Policy. Edward Elgar. Northamton. USA.
Kamalabadi, N. A. Bayat, A. Ebrahimi dan M.S. Kahreh, (2008). Presentation a New Algorithm for Performance Measurement of Supply Chain by using FMADM Approach. World Applied Sciences Journal 5(5): ISSN 1818-4952. p.582-589
Kariyasa, K danB.M.Sinaga, (2004). Faktor-faktor Yang Mempengaruhi Perilaku PasarJagung di Indonesia. Jurnal Agro Ekonomi Vol.22.No.2 p.167-194.
Pedesaan :Tantangan dan Peluang Bagi Kesejahteraan Petani. Centre of Analysis Economic Social and Policy of Agriculture. Departement of Agriculture. Bogor.
Latan, H. dan Gudono, (2012), SEMl: Strututural Equation Modeling, Faculty of Economics and Bussines Gadjah Mada University. Yogyakarta.
Lin,C., T.H.Chiudan Y.H. Tseng, (2006). Agility Evaluation Using Fuzzy Logic. International Journal of Production Economics 1 p.353-368.
Lipton and Moore, (1980). Metodologi Studi Pedesaan di Negara-negara Berkembang. Social Science Foundation. Jakarta.
Mathuramaytha, C.,(2011). Supply Chain Collaboration – What’s an outcome ? : A Theoreties Model. International Conference on Financial Management and Economics. IPEDR. Vol.11 @2011. IACSIT Press. Singapore. p.102-108.
Mantzer, J.T., Flint, D.J., and Hult, G.K., (2001), Logistics Service Quality as A Segment Costomized Process. Journal of Marketing. Vol. 65, pp.82-104.
Nazir, Moh., (1983). Metode Penelitian. Ghalia Indonesia. Jakarta.
Pawisari, (2011). Sistem Manajemen Mutu Pada Rantai Pasok Komoditi Jagung. Departement of Management and Bussines- Bogor Agriculture Institute. Bogor.
Pemda NTB, (2009). Grand Strategi Pengembangan Agribisnis Jagung. Dinas Pertanian Tanaman Pangan dan Bappeda Provinsi NTB. Mataram.
Pindyck, R.S. and D.L. Rubinfield, (1991). Econometric Models and Economic Forecast. Third Edition. McGraw-Hill International Edition. Singapore.
Porter, M.E., (1998). Competitive Strategy: Techniques For Analysis Industries and Competitors With A New Intruduction. The Free Press. New York.
Roekel, JV.,S.Williem and D.M. Boselie, (2002). Agri-Supply Chain Management: To Stimulate Cross-Border Trade in Developing Countries and Emerging Economies. Agri Chain Competence Center and Agricultural Economics Research Institute.
Sadikin,I., (1999). Analisis Daya Saing Komoditi Jagung dan Dampak Kebijakan Pemerintah Terhadap Agribisnis Jagung di Nusa Tenggara Barat Pasca Krisis Ekonomi. Pusat Penelitiandan Pengembangan Sosial Ekonomi Pertanian. Research and Development Departement of Agriculture Republic Indonesia. Bogor Shafiee, M. dan N. Shams e-alam, (2011). Supply Chains Performance Evaluation With Rough Data Envelopment Analysis: Case Study Food Industry (Ramak Co.) International Conference on Business and Economics Research 2010. IACSIT. Kuala Lumpur.
Sidarto, (2009). Konsep Pengukuran Kinerja SCM pada Sistem Manufaktur Dengan Model Performance of Activity (POA) and Supply Chain Operations Reference (SCOR), Journal of Technology. Akprind Institute, Volume 1. Number 1.
Sinaga, B.M., (1989). Economtric Model of The Indonesia Hardwood Products Industry : A Policy Simulation Analysis. Ph.D. Dissertation. University if The Philippines. Los Banos.
Sinjal,D., (2009). Kemitraan Jagung Berkelanjutan. Journal Agrina.
Sjah,T., (2011). Peluang Peningkatan Produksi Jagung di Nusa Tenggara Barat. Agroteksos: Journal of Agriculture Science. Volume 21.Nomor 2-3.ISSN 0852-8286.p.158-164.
Solimun, (2010). Analisis Multivariat Pemodelan Struktural: MetodePartial Least Square-PLS. CV Citra Malang. Malang.
Spekman, R.E., J.W. Kamauff Jr. dan N.Myhr, (2001). An Empirical Investigation into Supply Chain Management : A Perspective on Partnerships. International Journal of Physical Distribution and Logistics Management, 28(8).
Suryabrata,S., (1983). Metodologi Penelitian. Rajawali Pers. Jakarta.
Thomas,D.J. danP.M.Grifin, (1996). Coordinated Supply Chain Management. European Journal of Operation Research. Vol.94. No.1 pp.1-15.
Utomo,D., (2011). Strategi Supply Chain Management pada Proses Produksidan Saluran Distribusi terhadap Agroindustri Mangga (Mangiferaindica) di Kabupaten Probolinggo. Program of Postgraduate Faculty of Agriculture Brawijaya University. Malang.
Vredenbregt, J., (1984). Metodedan Teknik Penelitian Masyarakat. Gramedia. Jakarta.
Whang,S. dan Cheung,W., (2004). E-Business Adoption by Travel Agencies : Prime candidates for Mobile e-Business. International Journal of Electronic Commerce. Vol.8 (3) pp.43-63.
Widodo,K.H., K. Pramudya, A. Abdullah dan N. Pujawan, (2011). Supply Chain Management Agroindustri yang Berkelanjutan. Lubuk Agung. Bandung.
Winter, P., Simmons, P. dan Petrick, I., (2005). Evaluation of a Hybrid Seed. Contract between Smallholders and Multinational Company in East Java-Indonesia. The Journal of Development Studies, 41.p.62-89.
Yamin, S., dan Kurniawan, H., (2009), Structural Equation Modeling. Belajar LebihMudah Teknik Analisis Data Kuesioner dengan Lisrel – PLS, Salemba Infotek. Jakarta.
Zulganef, (2008). Metode Penelitian Sosial dan Bisnis. Graha Ilmu. Yogyakarta.
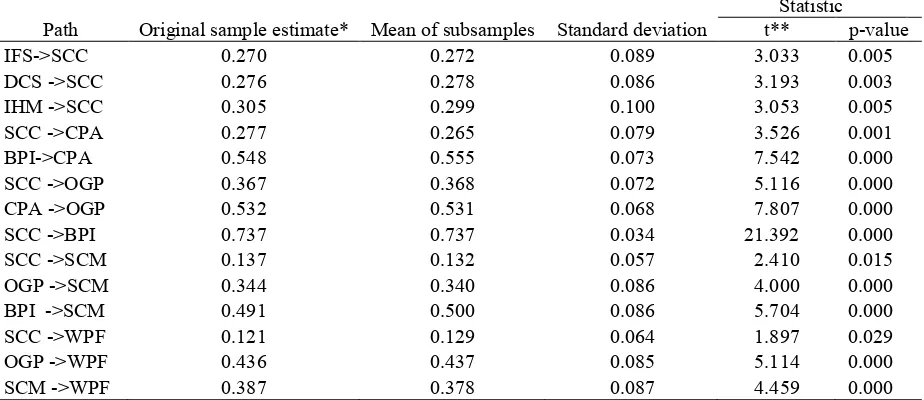
Table 1: Path Coefficients and t-statistic
Path Original sample estimate* Mean of subsamples Standard deviation
Statistic t** p-value
IFS->SCC 0.270 0.272 0.089 3.033 0.005
DCS ->SCC 0.276 0.278 0.086 3.193 0.003
IHM ->SCC 0.305 0.299 0.100 3.053 0.005
SCC ->CPA 0.277 0.265 0.079 3.526 0.001
BPI->CPA 0.548 0.555 0.073 7.542 0.000
SCC ->OGP 0.367 0.368 0.072 5.116 0.000
CPA ->OGP 0.532 0.531 0.068 7.807 0.000
SCC ->BPI 0.737 0.737 0.034 21.392 0.000
SCC ->SCM 0.137 0.132 0.057 2.410 0.015
OGP ->SCM 0.344 0.340 0.086 4.000 0.000
BPI ->SCM 0.491 0.500 0.086 5.704 0.000
SCC ->WPF 0.121 0.129 0.064 1.897 0.029
OGP ->WPF 0.436 0.437 0.085 5.114 0.000
SCM ->WPF 0.387 0.378 0.087 4.459 0.000