Climate Change Vulnerability Analysis of Baluran National Park
Beny Harjadi
Balai Penelitian Teknologi Kehutanan Pengelolaan Daerah Aliran Sungai, Jl. Ahmad Yani Pabelan Po. Box. 295, Solo, 7HOS
Corresponding author (e-mail: [email protected])
Abstrak. 6HWLDSHNRVLVWHPPHPSXQ\DLWLQJNDWNHUHQWDQDQ\DQJEHUEHGDWHUKDGDSJDQJJXDQ OLQJNXQJDQ \DQJ GLWHULPDQ\D EDLN GDUL IDNWRU DODP PDXSXQ JDQJJXDQ \DQJ EHUVLIDW DQWKURSRJHQLF 7DPDQ 1DVLRQDO 71 %DOXUDQ PHUXSDNDQ VDODK VDWX WDPDQ QDVLRQDO \DQJ PHPLOLNLNHWHUZDNLODQHNRVLVWHP\DQJOHQJNDS\DQJPHOLSXWLHNRVLVWHPKXWDQGDWDUDQWLQJJL KXWDQ GDWDUDQ UHQGDK KXWDQ SDQWDL PDQJURYH VDYDQQD GDQ HYHUJUHHQ IRUHVW 7XMXDQ SHQHOLWLDQLQLDGDODKXQWXNPHQGDSDWNDQIRUPXODSHUKLWXQJDQDQDOLVLVNHUHQWDQDQGDULIDNWRU WHWDS PDXSXQ IDNWRU GLQDPLV 3HQLODLDQ NHUHQWDQDQ 71 %DOXUDQ WHUKDGDS SHUXEDKDQ LNOLP GLODNXNDQGHQJDQPHOLKDWIDNWRUGLQDPLVGDQWHWDS.HUHQWDQDQWHWDSPHUXSDNDQNHUHQWDQDQ GDULIDNWRUGHQJDQNRQGLVLDVOLNRQWUROVHGDQJNDQNHUHQWDQDQGLQDPLVPHUXSDNDQNHUHQWDQDQ GDULIDNWRUEHUXEDK\DQJWHUSHQJDUXKNRQGLVLGDULOXDU.HUHQWDQDQ7HWDS.57GL71%DOXUDQ GLGRPLQDVLNRQGLVLWDKDQDUWLQ\DVHFDUDJHRPRUIRORJLGDQIDNWRUWHWDSODLQQ\DOHUHQJ GDQDUDKOHUHQJPDNDNRQGLVLGL71%DOXUDQFXNXSWDKDQWHUKDGDSWHUMDGLQ\DSHUXEDKDQLNOLP .5'.HUHQWDQDQ'LQDPLVPHUXSDNDQNHUHQWDQDQVXDWXZLOD\DKDWDXNDZDVDQ\DQJEHUXEDK NDUHQDDGDQ\DWHNDQDQGDULIDNWRUOXDU.5'GLSHQJDUXKLROHKIDNWRULNOLP:, :HWQHVV,QGH[ WDQDK6%, 6RLO%ULJKWQHVV,QGH[GDQYHJHWDVL*, *UHHQQHVV,QGH[.HUHQWDQDQ'LQDPLV .5'GL71%DOXUDQGDULWDKXQNHWDKXQEHUJHVHUGDUL\DQJVHPXODNDWHJRULVHGDQJ GDQEHUJHVHUNHUHQWDQ3HUDQSHQJLQGHUDDQMDXKXQWXNDQDOLVLVGHQJDQ VLVWHPUDVWHUVHFDUDGLJLWDOVHGDQJNDQVLVWHPLQIRUPDVLJHRJUDÀVXQWXNPHQDPSLONDQKDVLOSHWD VHFDUDNDUWRJUDÀ
Kata kunci:&LWUD/DQGVDW5DGDU7DPDQ1DVLRQDO3HQJLQGHUDDQ-DXKSIG.
Abstract. (YHU\HFRV\VWHPKDVDGLIIHUHQWOHYHORIVXVFHSWLELOLW\WRHQYLURQPHQWDOGLVWXUEDQFHV LWUHFHLYHVERWKIURPQDWXUDOIDFWRUVRUDQWKURSRJHQLFGLVWXUEDQFH1DWLRQDO3DUN13%DOXUDQ LV RQH QDWLRQDO SDUN WKDW KDV D UHSUHVHQWDWLRQ RI D FRPSOHWH HFRV\VWHP WKDW LQFOXGHV XSODQG IRUHVWHFRV\VWHPVORZODQGIRUHVWVFRDVWDOIRUHVWVPDQJURYHVVDYDQQDDQGHYHUJUHHQIRUHVW7KH REMHFWLYHRIWKLVVWXG\LVWRJHWDIRUPXODFDOFXODWLRQRIYXOQHUDELOLW\DQDO\VLVRIFRQVWDQWDQG G\QDPLFIDFWRUV%DOXUDQ13YXOQHUDELOLW\DVVHVVPHQWWRFOLPDWHFKDQJHGRQHE\ORRNLQJDWWKH G\QDPLFDQGÀ[HGIDFWRUV9XOQHUDELOLW\UHPDLQVDYXOQHUDELOLW\IDFWRUWRWKHFRQGLWLRQRIWKH RULJLQDOFRQWUROZKHUHDVYXOQHUDELOLW\LVWKHYXOQHUDELOLW\RIWKHG\QDPLFFKDQJHIDFWRUVZKLFK DIIHFWHGWKHFRQGLWLRQIURPWKHRXWVLGH&RQVWDQW9XOQHUDELOLW\&9LQ%DOXUDQ13GRPLQDWHG UHVLVWDQWFRQGLWLRQVPHDQLQJWKDWWKHJHRPRUSKRORJ\DQGRWKHUÀ[HGIDFWRUVVORSHDQG VORSHGLUHFWLRQDVSHFWWKHQWKHFRQGLWLRQLQ%DOXUDQ13VXIÀFLHQWO\UHVLOLHQWWRFOLPDWHFKDQJH '\QDPLF 9XOQHUDELOLW\ '9 LV WKH YXOQHUDELOLW\ RI DQ DUHD RU DUHDV WKDW FKDQJH EHFDXVH RI SUHVVXUH IURP H[WHUQDO IDFWRUV '9 LV LQÁXHQFHG E\ FOLPDWLF IDFWRUV :, :HWQHVV ,QGH[ VRLO6%, 6RLO%ULJKWQHVV,QGH[DQGYHJHWDWLRQ*, *UHHQQHVV,QGH['9LQ%DOXUDQ 13IURPWRVKLIWHGIURPWKHRULJLQDOFDWHJRU\RIEHLQJDQGVKLIWHGWRWKH VXVFHSWLEOH7KHUROHRIUHPRWHVHQVLQJIRUWKHDQDO\VLVRIUDVWHUGLJLWDOV\VWHPZKLOH WKHJHRJUDSKLFLQIRUPDWLRQV\VWHPWRGLVSOD\WKHUHVXOWVRIFDUWRJUDSKLFPDSV
Keywords:/DQGVDW,PDJH5DGDU1DWLRQDO3DUNV5HPRWH6HQVLQJ, GIS.
1. Introduction
0HWW]JHUHWDODQG,3&& GHÀQHYXOQHUDELOLW\DVDIXQFWLRQRIH[SRVXUH sensitivity of a system to change and the
climate variability and extreme condition. Every landscape has different level of vulnerability to environmental disturbances, either natural or anthropogenic. Damages to landscape tend to vary due to different level of vulnerability.
National park is one of interesting landscapes to study. According to Act Number 5 Year 1990 on Biological Resources Conservation and their Ecosystem, a national park shall be a nature conservation area which possesses native ecosystem, which is managed through a zoning system utilized which facilitates research, science, education, breeding enhancement, recreation and tourism. Baluran National Park is one of national parks with complete representations of ecosystem. It is the representation of highland, lowland, and beach forest, mangrove, savanna, and evergreen forest (Government Regulation of Ministry of Forestry, 2009).
Baluran National Park and its ecosystem components may show different vulnerability OHYHOWRWKHIDFWRUVLQÁXHQFLQJHFRV\VWHPHLWKHU in terms of biotic, abiotic, or anthropogenic factors, depending on the area and forest type, geographical condition, and cultural background of the communities surrounding the forest. Pressure from those factors will affect KXPDQ DQG IRUHVW HFRV\VWHP 7KH LQÁXHQFH magnitude depends on the forest ecosystem’s sensitivity and adaptive capacity, as well as management capability. Negative effect will increase in the future, unless earlier handling is done.
Harjadi (2005) assumes that details RQ YXOQHUDELOLW\ UHTXLUH KLJK DFFXUDF\ RQ land acreage which can be analyzed using geographic information system (GIS). Assessment for biophysical condition is carried out by considering static physical factors (inclination and slope direction, and elevation) and the dynamic physical factors (soil brightness and wetness, and canopy closure). According to CSSTEAP (2005), dynamic factors can be measured by satellite analysis, including Soil Brightness Index (SBI), Wetness Index (WI) and Greenness Index (GI).
This research aims to create a formula to analyze vulnerability assessment, both from static and dynamic factors. Vulnerability analysis can assist in the preparation of policies relating to the area management plans in the future
2. Research Method a. Research Location
The research was conducted at Baliuran National Park, East Java in 2010. Baluran National Park (25,000 ha) is located in Banyuputih, Situbondo Regency, East Java (based on the Decree of Ministry of Forestry, 1997). It is geographically situated on the coordinates of 7o45’-7o15’ South and 114o
18’-114o27 East, the southeast of Java island (Figure
1). It is bordered by Madura Strait in the north, Bajulmati River in the west, Bali Strait in the east, and Klokoran River in the northwest.
Figure 1. Research Sites in Baluran National Park (yellow circle)
Baluran National Park was granted as a National Park due to the Decree Letter of Ministry of Forestry dated May 23rd 1997, covering an area of 25,000 ha. In accordance with the allocation, the territory of the area is divided into some zones as mentioned in the Decision Letter of Directorate General of Nature Protection and Conservation Number 187/Kpts./DJ-V/1999 dated December 13th 1999, which consists of: core zone covering 12,000 ha, wilderness zone covering 5,537
KD :DWHUV KD DQG /DQG KD
intensive utilization zone covering 800 ha,
VSHFLÀFXWLOL]DWLRQ]RQHFRYHULQJKDDQG
rehabilitation zone covering 783 ha.
b. Materials and Equipments
Materials needed in this research include: 1) Basic maps, including 5%, map (Indonesia
map, and situation and administration map.
2) Recording of Landsat Enhan-ced Thematic Mapper 7 (TM7) image in August 1999 and 2010.
3) SRTM (Shuttle Radar Topo-graphic Mission)
4) Stationeries and writing tools for image LQWHUSUHWDWLRQ LQFOXGLQJ ÀQH IXOO FRORU OHP markers, scotch-tape and astralon plastic.
5) Plotting paper, printing paper, and cartridge ink (black, yellow, magenta and cyan).
0HDQZKLOHWKHHTXLSPHQWVQHHGHGDUHDV follow:
(TXLSPHQWVIRULQWHUSUHWLQJVDWHOOLWHLPDJH visually (loop, mirror/pocket stereoscope, and computer)
(TXLSPHQWV IRU ÀHOG VXUYH\ FRPSDVV DEQH\OHYHOS+VWLFNÀHOGIRUPVGLJLWDO camera and Global Positioning System (GPS)
(TXLSPHQWVIRUDQDO\]LQJGLJLWDOGDWDDQG SIG, including:
a) Hardware (computer)
b) Software for image analysis that consists of Erdas-Imagine 8.7 version and PC Arc/Info 3.4D plus version, and Ilwis 3.3. Excel, Microsoft Word, and DBASE III Plus for tabulation purpose.
c. Data Collection Technique 1) Climate data
Climate data are obtained from the nearest
%0.* %DGDQ 0HWHRURORJL .OLPDWRORJL GDQ
*HRÀVLND) or the Meteorogical, Climatological
and Geophysical Agency of Baluran National Park, located in Banyuwangi. The data include annual temperature, maximum average temperature, minimum average temperature, average maximum air pressure, average maximum humidity, average minimum humidity, and sum of rainy days in a year, from 1981 to 2007. Variables in the scope of weather consist of temperature, precipitation capacity, air pressure, air humidity, speed, and wind direction. Meanwhile, climate is the average condition of atmosphere, and it deals with topographical characteristics and water surface width in a certain region, within a
certain respective period in years (McMichael, 2003). Conceptually, changes of one or more climate dimensions (e.g. temperature and UDLQIDOOZLOOLQÁXHQFHWKHSURFHVVRIHFRV\VWHP (forest) (Ayres, et.al. 2009). The process of forest ecosystems will impact on population changes LQÁRUDDQGIDXQD
2) Land biophysical data
Land biophysical data collecting, according to Harjadi (2007), is carried out with land resources inventory, consisting À[HG IDFWRUV ODQGIRUP W\SHV RI URFNV W\SHV of soil, and slope inclination) together with dynamic factors (erosion, terrace, land cover, and land use capability). Furthermore, there are some factors used in analyzing satellite image to calculate Constant Vulnerability (CV) and Dynamic Vulnerability (DV). To measure constant vulnerability, data of slope inclination (slope), slope direction (aspect), and altitude DUHUHTXLUHG'DWDVORSHDVSHFWDQGHOHYDWLRQ follows the formula already provided by the ILWIS soft ware. Meanwhile, to calculate dynamic vulnerability, data of land wetness (WI), soil brightness (SBI), and level of plant greenness (GI) are needed. Furthermore, the FODVVLÀFDWLRQ WR GHWHUPLQH DUHDV WKDW KDYH high levels of vulnerability to climate : highly resistant, resistant, medium, vulnerable and Particularly vulnerable.
3) Ecosystem-change data
potential for any damage, or take advantage of condition resulted from dynamic climate” (McCarthy et al., 2001 in Locatelli et al., 2008).
D. Data Analysis
Scoring method is employed to assess vulnerability value. Method of calculating the value of vulnerability conducted by scoring, by summing the three variables, if the value <50 (very vulnerable), 50-100 (vulnerable), 100-150 (moderate), 100-150-200 (resistant),> 200 (very resistant). Vulnerability in the research location shows spatial and degree variations, and then Vulnerability Status Index (VSI) is obtained. Vulnerability analysis is carried out in two ways, consisting of CV with SRTM image, and DV with Landsat image taken in 1999 and 2010. On the basis of the vulnerability status, it is found that the maximum vulnerability value is 150 while the minimum value is 0. The value is categorized into 5 classes including very high (very vulnerable), high (vulnerable), moderate, low (invulnerable), and very low (very invulnerable).
By using remote sensing analysis results, the formula for assessing vulnerability with CSSTEAP (2005) is translated into dynamic vulnerability (DV):
Thus, assessment of DV can be done by comparing two satellite images taken in different time. Besides, by using image SRTM, CV can be calculated with the following formula:
Constant Vulnerability = Slope + Aspect +Altitude
Note:
Slop : level of slope
Aspect : level of slope direction
Altitude : level of height asl (above sea level)
3. Result and Discussion
The calculation of vulnerability in Baluran National Park is conducted by considering G\QDPLF DQG À[HG IDFWRUV &RQVWDQW vulnerability is the level of vulnerability LQÁXHQFHG E\ UHDO FRQGLWLRQ IDFWRUV FRQWURO while dynamic vulnerability is the vulnerability caused by external factors. Constant factor consists of slope, inclination, and altitude, while dynamic factor comprises GI and SBI.
Indications of climate change (season variations and extreme weather) in Baluran 1DWLRQDO3DUNLVLGHQWLÀHGIURPWKHLQFUHDVLQJ tendency in some climate parameters. They are DQQXDOWHPSHUDWXUH oC -27.50oC), average
maximum temperature (27.30 oC -28.70 oC),
average minimum temperature (24.20 o& oC), average maximum air pressure (1010.2
mb-1015.4 mb), average minimum air pressure (1004.8 mb-1009.5 mb), average maximum air
humidity DYHUDJH PLQLPXP DLU
KXPLGLW\DVZHOODVWKHDPRXQWRI UDLQIDOOSHU\HDUGD\V$QQXDOUDLQIDOO and maximum rainfall are relatively constant.
CV does not relatively change in some years, however, in more than 100 years of geological age, it possibly shows slow changing. In tropical area, geological change is caused by disintegration of bedrock split and decomposition is due to chemical process, and therefore, these lead to the changes of geomorphology and soil nature. These changes provide the foundation for DV measurement. Thus, some years of change even will cause vulnerability of plants, soil, and ecosystem to change.
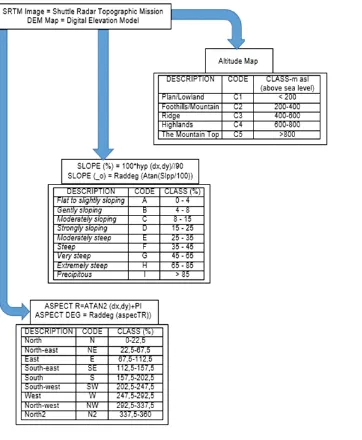
a. Constant Vulnerability (CV)
Figure 2. Flow Chart of Component Calculation CV (Constant Vulnerability): Altitude Place, Slope and Slope Direction (Aspect)
b. Slope
6ORSHLQ%DOXUDQ1DWLRQDO3DUNLVFODVVLÀHG into 8 classes. They are: A (Flat<4%), B (Rather Slope 4-8%), C (Slope 8-15%), D (Very Slope 15- 25%), E (Rather Steep 25-35%), F (Steep *9HU\6WHHS+([WUHPHO\ 6WHHS , $EUXSW ! 7KH PRVW SDUWRIODQGLVÁDWVORSH$ZKLFKFDXVHVWKH land relatively easy to be cultivated and used as grazing land primary in the savanna area (Figure 3). Land with rather steep slope (E) to Abrupt (I) is not too large; however, it is potential as source of erosion disaster when the rain comes down with high intensity (Harjadi, 2004).
Figure 3. Distribution of Slope in TN Baluran, Dominated by Region Plains (A = 0-4%) and Few is
c. Aspect (Slope Direction)
7KH GLVWULEXWLRQV RI DVSHFW DUH HTXLWDEOH into every part of direction from N (North), NE (North East), E (East), SE (South East), S (South), SW (South West), W (West), NW (North West), and N2 (the second North) as presented in Figure 4. The land of Baluran
National Park which is dominated by North GLUHFWLRQH[SHULHQFHGWROLJKWHURVLRQWKHQ in the SE (South East: 14%) and South (13%) experienced heavy erosion, and land in the East (12%) and North East (13%), the sensitivity towards erosion is low (NW, E, NE), medium (W&E), and heavy (SW, S, SE).
Figure 4. Directions of Slope at TN Baluran to all Wind Directions, Most is to the North (N+N2) and Least is to the Southwest (SW).
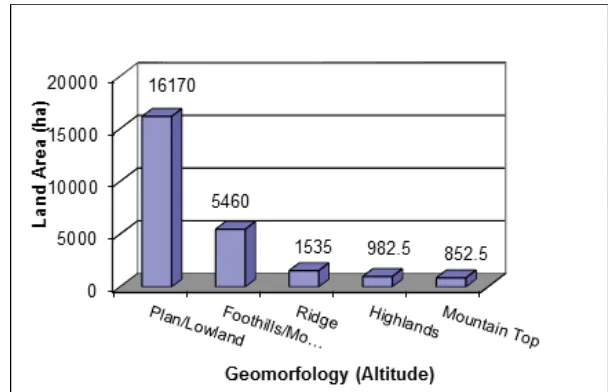
d. Altitude
0RVW RI WKH ODQG LQ %DOXUDQ National Park is lowland (<200 m above sea level) and slopes of mountain (22%), and therefore, the areas are relatively
resistant to any external disturbance. Even though the top of the mountain is not wide enough, it easily experiences erosion and is easily transported or shifted if eruption takes place (Figure 5).
Figure 5. Geomorphology Conditions in TN Baluran, the most is Lowland (16 170 ha) and the least that is Peak of Mount (852 ha).
CV in Baluran National Park is dominated E\ UHVLVWDQW FRQGLWLRQ ZKLFK PHDQV that in terms of its geomorphology and other
Figure 6. Distribution Map of CV in TN Baluran which is Dominated by Resistant Condition (61%) of the changes
based on SRTM Image Analysis
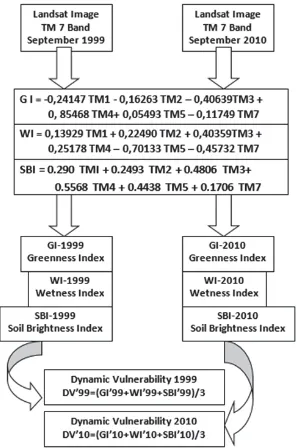
e. Dynamic Vulnerability (DV)
Dynamic vulnerability is the vulnerability of an area or region which changes due to some pressures of external factors. DV is affected by climatic factor (WI/Wetness Index), soil (SBI), and vegetation (GI/Greenness Index) seen RQ )LJXUH ,I GDWD WDNHQ IURP WKH ÀHOG DUH UHTXLUHGHLWKHUWKH\DUHGLIÀFXOWWRSURYLGHRU some are found occasionally missing from the record in the previous years, assistance from the data taken from satellite image recorded once D PRQWK LV YHU\ VLJQLÀFDQW 7R FRPSDUH DQG contrast whether there are changes of dynamic vulnerability, it is necessary to provide those data taken in the same month of different year.
f. GI (Greenness Index)
Transformation greenness index indicates that the closer the vegetation will provide a high index value. Transformation of Greenness Index presents that the denser the vegetation is, the higher the index value will be. The transformation of GI makes use of several channels, among others: TM 1, TM 2, TM 3, TM 4, TM 5, and TM 7. On the other hand, to the level of greenness plummeted (32% to 21%) as seen on Figure 8.
Figure 8. Greenness Rate Changes (Greenness Index = GI) in TN Baluran from 1999 to 2010
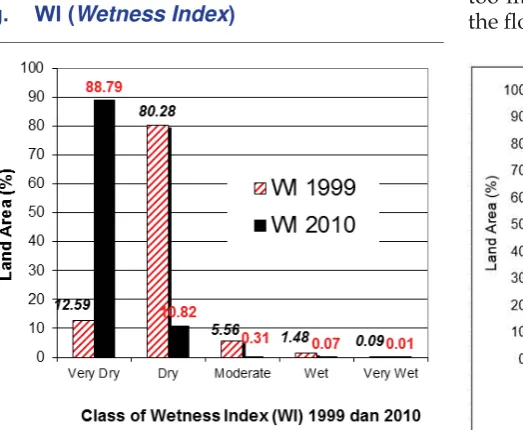
g. WI (Wetness Index)
Figure 9. Changes of Humidity Level (Wetness Index = WI) in TN Baluran from 1999 to 2010
Topographic wetness index (TWI), also known as the compound topographic index (CTI), is a steady state wetness index. It is
FRPPRQO\XVHGWRTXDQWLI\WRSRJUDSKLFFRQWURO on hydrological processes. Fluid contained in leaves will provide index to vegetation. Transformation of WI employs several spectral channels, among others: TM1, TM 2, TM 3, TM 4, TM5, and TM 7. In Landsat image taken in 1999, most of the areas were in the dry condition (80%) and very dry (12%), whereas in 2010, most were very dry (88%) and dry (11%) (attached in Figure 9). The 2010 Landsat image ZDVHLWKHUGRPLQDWHGE\PRGHUDWHDQG dense (21%) land closure, and also sparse land closure (15%).
h. SBI (Soil Brightness Index)
SBI is the soil brightness as a result of sun light, meaning that the wider an open land is, the higher the land brightness can be, and on the other way, when a land is dense, less light UHÁHFWLRQ DQG DEVRUSWLRQ ZLOO RFFXU 'HQVH land closure dominates Baluran National Park, KHQFHWKH6%,EHFRPHVGDUNDOLWWOHUHÁHFWLRQ i.e. 87% in 1999, and 78% in 2010 (Figure 10).
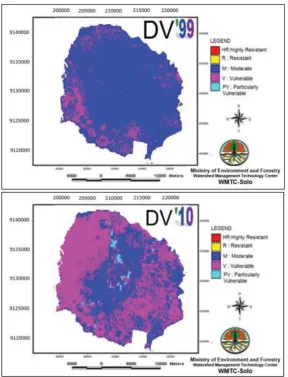
The dynamic vulnerability in Baluran National Park from 1999 to 2010 shifted from PRGHUDWHWRYXOQHUDEOH7KH condition is triggered by a globally extreme climatic change (Figure 10). With the condition of cosntant vulnerability that is resistant or not very vulnerable, climatic change do not give too much negative impact to the ecosystem of WKHÁRUDDQGIDXQDLQ%DOXUDQ1DWLRQDO3DUN
Figure 10. Changes of Brightness Level (SBI) in TN Baluran from 1999 to 2010
extreme change of global climate (Figure 11). With the condition of vulnerability remained resilient and dynamic vulnerability which was
not until very vulnerable, the climate change ZDV QRW WRR EDG IRU WKH HFRV\VWHP ÁRUD DQG fauna in TN Baluran.
Figure 11. Changes of DV in a decade (1999-2010) in TN. Baluran, Situbondo.
4. Conclusion
&9&RQVWDQW9XOQHUDELOLW\LVLQÁXHQFHG E\À[HGIDFWRUVZKLFKDUHYHU\LQÁXHQWLDORQ the vulnerability level of an area, such as in the 71 %DOXUDQ ZKLFK LV LQÁXHQFHG E\ DOWLWXGH slope and slope direction. At TN Baluran (The National Park of Baluran), CV is dominated by LPSHUYLRXVDUHDVVRWKDWWKHSUHVVXUH from outside factors do not cause the area to become vulnerable .
DV (Dynamic Vulnerability) is affected by the climate (WI), soil (SBI) and vegetation (GI) which are the external factors that often change dynamically at any time. CV in TN Baluran shifted from the medium category (85%) into a YXOQHUDEOHFDWHJRU\VRLWLVQHHGHGWREH aware if there is a change due to land clearing, climate change and soil fertility.
Both of these vulnerabilities CV and DV strengthen each other, if both include climate resistant to external factors as it will be resistant to change. Conversely, if both are vulnerable to external factors, it will be seriously affected if there is slightest pressure from the outside.
Formula for calculating the vulnerability of an ecosystem can be done by calculating WKH&9DQG'9&9LVLQÁXHQFHGE\DOWLWXGH slope and direction of the slope, while the DV is determined by climatic factors, soil and vegetation.
At Baluran TN region, the peak areas of the
FDOGHUDLVYHU\GLIÀFXOWWRUHDFKEHFDXVHRIWKH slope > 85% and the whole area is very large that is a total of 25,000 ha.
5. References
Ayres, Matthew, David Karnosky and Ian Thompson. 2009. )RUHVW5HVSRQVHVDQG9XOQHUDELOLWLHVWR
5HFHQW&OLPDWH&KDQJH dalam Adaptation of Forests and People to Climate Change (Risto Seppala, Alexander Buck, Pia Katila, editor). IUFRO World Series Volume 22.
CSSTEAP,2005. Remote Sensing & Geographic Information System, Lecture Notes, Module Ii : RS & GIS Applications In Agriculture & Soils, Post Graduate Course On Centre for Space 6FLHQFH 7HFKQRORJ\(GXFDWLRQ,Q$VLD 7KH3DFLÀFH&667($3,QGLDQ,QVWLWXWHRI 5HPRWH6HQVLQJ1DWLRQDO5HPRWH6HQVLQJ$JHQF\'HKUDGXQ,QGLD$IÀOLDWHGWR7KH United Nations), IIRS Campus, Dehradun, India
Decree of Ministry of Forestry, 1997, SK Menhut : 3HQHWDSDQ /XDVDQ .DZDVDQ 7DPDQ 1DVLRQDO
%DOXUDQ+HNWDU. SK. Menteri Kehutanan No. 279/Kpts.-VI/1997 tanggal 23 Mei 1997,
Jakarta.
Harjadi B., 2004. .DUDNWHULVWLN6XPEHUGD\D/DKDQ6HEDJDL'DVDU3HQJHORODDQ'$6GL6XE'$60HUDZX
'$6 6HUD\X -XUQDO *HRJUDÀ 8QLYHUVLWDV 0XKDPPDGL\DK 6XUDNDUWD )RUXP *HRJUDÀ
Vol.18, No.2, Desember 2004
Harjadi, B. 2007. Aplikasi 3HQJLQGHUDDQ MDXK GDQ 6,* 8QWXN 3HQHWDSDQ 7LQJNDW .HPDPSXDQ
3HQJJXQDDQ /DKDQ (KPL), Studi Kasus di DAS Nawagaon Maskara, Saharanpur-India.
)RUXP*HRJUDÀYRO1R-XOL6XDUDNDUWD3
Harjadi, B., 2005. Deteksi Kekritisan Lahan dengan Penginderaan Jauh dan Sistem Informasi *HRJUDÀ6WXGL.DVXV/DKDQ.ULWLV6XE'$6$ODQJ:RQRJLUL-XUQDO*HRJUDÀ8QLYHUVLWDV 0XKDPPDGL\DK6XUDNDUWD)RUXP*HRJUDÀ9RO1R-XOL
IPCC. 2007. Impact, adaptation and vulnerability. Contribution of Working Group II to the Fourth Assessement Report of the Environmental Panel on Climate Change (IPCC). Parry, M.L., Canziani, O.F., Palutifof, J.P., van der Linden, P.J. and Hanson, C.E. (eds.). Cambridge University Press, Cambridge, UK. 973 p.
Locatelli, Bruno, Markku Kannined, Maria Brockhaus, Carol J.P. Colfer, Daniel Murdiyarso, dan Heru santoso. 2008. Facing an uncertain future. How forests and people can adapt to climate change. Forest Perspectives 5. CIFOR. Indonesia
McMichael. 2003. Climate Change and Human Health: Risks and Responses. WHO. Jenewa. 0HWW]JHU 0- 5RXQVHYHOO 0'$ $FRVWD0LFKOLN / /HHPDQV 5 DQG 6FKURWHU '