An Atlas of
BACK PAIN
THE ENCYCLOPEDIA OF VISUAL MEDICINE SERIES
Scott D. Haldeman
DC, MD, PhD, FRCP(C), FCCS(C)Clinical Professor, Department of Neurology
University of California, Irvine, California, USA
William H. Kirkaldy-Willis
MA, MD, LLD(Hon), FRCS(E and C), FACS, FICC(Hon)Emeritus Professor and Head, Department of Orthopedic Surgery,
University of Saskatchewan College of Medicine, Saskatoon, Saskatchewan, Canada
Thomas N. Bernard, Jr
MDClinical Assistant Professor, Department of Orthopedic Surgery
Tulane University School of Medicine, New Orleans, Louisiana, USA
The Parthenon Publishing Group
International Publishers in Medicine, Science & TechnologyPublished in the USA by The Parthenon Publishing Group 345 Park Avenue South, 10th Floor New York
NY 10010 USA
Published in the UK by The Parthenon Publishing Group 23–25 Blades Court
Deodar Road London SW15 2NU UK
Copyright © 2002 The Parthenon Publishing Group
Library of Congress Cataloging-in-Publication Data Haldeman, Scott.
An atlas of back pain / Scott Haldeman, William H. Kirkaldy-Willis, Thomas N. Bernard, Jr.
p. ; cm. -- (The encyclopedia of visual medicine series) Includes bibliographical references and index.
ISBN 1-84214-076-0 (alk. paper)
1. Backache--Atlases. I. Title: Back pain. II. Kirkaldy-Willis, W. H. III. Bernard, Thomas N. IV. Title. V. Series.
[DNLM: 1. Back Pain--etiology--Atlases. 2. Back Pain--diagnosis--Atlases. 3. Spinal Diseases--pathology--Atlases. WE 17 H159a 2002]
RD771.B217H354 2002
617.5'64'00222--dc21 2001056029
British Library Cataloguing in Publication Data Haldeman, Scott
An atlas of back pain. - (The encyclopedia of visual medicine series) 1. Backache
I. Title II. Kirkaldy-Willis, W. H. III. Bernard, Thomas N. 617.5'64
ISBN 1-84214-076-0
First published in 2002
No part of this book may be reproduced in any form without permission from the publishers except for the quotation of brief passages for the purposes of review
Contents
Preface
1 Introduction
Epidemiology
Work-related back pain
Pathology and back pain
Physiology of back pain
Approaching the patient with back pain
2 Normal spinal anatomy and physiology
The bony vertebrae
The intervertebral disc
The posterior facets
The spinal ligaments and muscles
The nerve roots and spinal cord
3 Spinal degeneration
The intervertebral disc
The facet joints
Imaging of degenerative changes
4 Acute trauma
Disc herniation
Compression fracture
6 Spinal deformity
Spondylolysis
Isthmic spondylolisthesis
Degenerative spondylolisthesis
Scoliosis
Inflammatory diseases
7 Space-occupying and destructive lesions
Spinal tumors
Spinal infections
Arachnoiditis
8 Spinal surgery
Preface
There are few greater challenges to clinicians than the diagnosis and treatment of patients with back pain. The process of making such a diagnosis requires an understanding of the complex anatomy and physiology of the spine and the ability to differ-entiate between structural, functional, congenital and pathological conditions that can occur in the spine and potentially cause or impact upon the symptoms of back pain and decreased functional capacity. The ability to examine and treat patients with back pain is dependent on the ability of a clini-cian to visualize changes that can occur in the normal structure and function of the spine that may result in pain, and to assess the effect of the social, occupational and emotional factors that may impact upon the manner in which a patient responds to pain.
This Atlas of Back Pain is an effort to help the clinician in the visualization of the spine by defining normal and abnormal spinal anatomy and
physiology. This will be attempted by means of diagrams, anatomical and pathological slides as well as the presentation of imaging and physiological tests that are available to the clinician and which can be used to assist in the diagnosis of patients with back pain.
Acknowledgements
We appreciate the permission received from Churchill Livingstone (Saunders) Press to republish figures of pathology from Managing Low Back Pain, 4th edition, edited by W.H. Kirkaldy-Willis and T.N. Bernard Jr.
We acknowledge permission from Dr R.R. Cooper (Iowa City) to publish his electron micro-scope figures of ‘Regeneration of skeletal muscle in the cat’ included in this text.
We thank Dr J.D. Cassidy, Dr K. Yong Hing, Dr J. Reilly and Mr J. Junor for their help in obtaining, preparing and photographing pathological specimens used in this Atlas.
1
Introduction
Back pain, like tooth decay and the common cold, is an affliction that affects a substantial proportion, if not the entire population, at some point in their lives. Nobody is immune to this condition nor its potential disability which does not discriminate by gender, age, race or culture. It has become one of the leading causes of disability in our society and the cost of treatment has been increasing progressively each year, without any obvious effect on the frequency and severity of the condition. The search for a cure and the elimination of back pain does not appear to be a viable option at this point in our understanding of back pain. A reasonable goal, however, is to improve the ability of clinicians to determine the cause of back pain in a substantial proportion of patients, to identify conditions likely to lead to serious disability if not treated promptly, to reduce the symptoms of back pain, to increase functional capacity and to reduce the likelihood of recurrences.
EPIDEMIOLOGY
The prevalence of back pain in the adult population varies with age. There are a number of surveys in multiple countries that reveal a point-prevalence of 17–30%, a 1-month prevalence of 19–43% and a life-time prevalence of 60–80%. The likelihood that an individual will recall on survey that they have expe-rienced back pain in their lifetime reaches 80% by the age of 60 years, and there is some evidence that the remaining 20% have simply forgotten prior episodes of back pain or considered such episodes as a natural part of life and not worth reporting. At the age of 40 years, the prevalence is slightly higher in women, while, after the age of 50, it is slightly higher
in men. The majority of these episodes of back pain are mild and short-lived and have very little impact on daily life. Recurrences are common and one survey found that up to 14% of the adult population had an episode of back pain each year that lasted 30 days or longer and at some point interfered with sleep, routine activities or work. Approximately 1% of the population is permanently disabled by back pain at any given point, with another 1–2% temporarily disabled from their normal occupation. Children and adolescents are not immune from back pain. Surveys reveal that approximately 5% of all children have a history of back pain that interferes with activity, with 27% reporting back pain at some time.
Figure 1.1 The prevalence rates for low back pain in the general population by age
WORK-RELATED BACK PAIN
Back injuries make up one-third of all work-related injuries or almost one million claims in the United States each year. Approximately 150 million work-days are lost each year, affecting 17% of all American workers. Half of the lost workdays are taken by 15% of this population, usually with prolonged periods of time loss, while the other 50% of lost work days are for periods of less than 1 week. The incidence rates for work-related back injuries vary, depending on the type of work performed. The factors that increase the likelihood of back injury are repetitive heavy lifting, prolonged bending and twisting, repetitive heavy pushing and pulling activities and long periods of vibration exposure. Work that requires minimal physically strenuous activity, such as the finance, insurance and service industries, has the lowest back injury rates, whereas work requiring repetitive and strenuous activity such as construction, mining and forestry has the highest injury rates.
PATHOLOGY AND BACK PAIN
There is a strong inclination on the part of clinicians and patients suffering from back pain, especially if it is associated with disability, to relate the symptoms of pain to pathological changes in spinal tissues. For this reason, there is a tendency to look for
anatomi-cal abnormalities to explain the presence of pain, by ordering X-rays, computerized tomography (CT) or magnetic resonance imaging (MRI) studies. It is tempting to point to changes in anatomical structure seen on these studies as the cause of the symptoms. Unfortunately, the assumption that the lesion seen on these studies is the cause of the pain is not always valid. Degenerative changes occur in virtually all patients as part of the normal aging process. At age 20, degenerative changes are noted on X-ray and MRI in less than 10% of the population. By age 40, such changes are seen in 50% of the asymptomatic population and, by age 60, this number reaches over 90%. Disc and joint pathology is noted in 100% of autopsies of persons over the age of 50. These changes can affect multiple levels of the spine and can be severe in the absence of symptoms.
Pathology in the intervertebral disc can also exist in the absence of symptoms. Disc protrusion or herniation can be found in 30–50% of the population in the absence of symptoms. Even large and dramatic disc herniations and extrusions can be found in asymptomatic individuals. Changes in the intervertebral disc seen on discography, including fissures and radial tears, have recently been found to exist in patients without back pain. It is, therefore, not possible to interpret pathology seen on imaging studies as the origin of a person’s back pain without looking for other contributing factors or clinical findings.
Figure 1.3 The incidence of pathology in the normal population
Disc herniations, disc bulging and degenerative changes are very common in the asymptomatic population. Most individuals can anticipate pathological changes on MRI, CT scan or radi-ographs, even in the absence of symptoms. Under certain circumstances, these changes can become symptomatic. Adapted from reference 5, with permission
Incidence of pathology (%)
The more physically stressful and demanding the occupation, the greater the likelihood of disability due to back pain. Adapted from reference 4 with permission
PHYSIOLOGY OF BACK PAIN
There are a number of factors that have been impli-cated in the genesis of back pain and disability that can be used to determine whether a pathological process seen on imaging studies is associated with symptoms experienced by a patient. Certain of these factors are based on epidemiological studies, while others are based on clinical findings and phys-iological tests.
Pain in any structure requires the release of inflammatory agents that stimulate pain receptors and generate a nociceptive response in the tissue. The spine is unique in that it has multiple structures that are innervated by pain fibers. Inflammation of the posterior joints of the spine, the intervertebral disc, the ligaments and muscles, meninges and nerve roots have all been associated with back pain. These tissues respond to injury by releasing a number of chemical agents that include bradykinin, prostaglandins and leukotrienes. These chemical agents activate nerve endings and generate nerve impulses that travel to the spinal cord. The nocicep-tive nerves, in turn, release neuropeptides, the most prominent of which is substance P. These neuropep-tides act on blood vessels, causing extravasation, and stimulate mast cells to release histamine and dilate blood vessels. The mast cells also release leukotrienes and other inflammatory chemicals that
attract polymorphonuclear leukocytes and mono-cytes. These processes result in the classic findings of inflammation with tissue swelling, vascular conges-tion and further stimulaconges-tion of painful nerve endings. The pain impulses generated from injured and inflamed spinal tissues are transmitted via nerve fibers that travel through the anterior (from nerves innervating the extremities) and posterior (from the dorsal musculature) primary divisions of the spinal nerves and through the posterior nerve roots and the dorsal root ganglia to the spinal cord, where they make connections with ascending fibers that trans-mit the pain sensation to the brain. The spinal cord and brain have developed a mechanism of modifying the pain impulses coming from spinal tissues. At the level of the spinal cord , the pain impulses converge on neurons that also receive input from other sensory receptors. This results in changes in the degree of pain sensation that is transmitted to the brain through a process commonly referred to as the ‘gate control’ system. The pain impulses are modi-fied further through a complex process that occurs at multiple levels of the central nervous system. The brain releases chemical agents in response to pain known as endorphins. These function as natural analgesics. The brain can also block or enhance the pain response by means of descending serotonergic modulating pathways that impact with pain
Figure 1.4 Neurophysiology of spinal pain
A simplified diagram of neurophysiological pathways and a few of the neurotransmitters responsible for spinal pain. Injury to the spinal tissues results in the release of inflammatory agents which stimulate nerve endings. Impulses travel to the spinal cord and connect to neurons which send impulses to the brain via the brainstem. There is a spinal cord-modulating system in the spinal cord which inter-acts with other afferent input and descending modulating pathways from the periaqueductal gray matter and other brainstem nuclei
sensations both centrally and at the spinal cord level. The latter mechanism is felt to be responsible for the strong impact of psychosocial factors on the response to pain and the disability associated with back pain. The pain centers in the spinal cord and brain can also change through a process known as plasticity which may explain the observation that many patients develop chronic pain that is more widespread than the pathological lesion and continues after the reso-lution of the peripheral inflammatory process.
APPROACHING THE PATIENT WITH BACK PAIN
The factors that determine the degree of back pain, and especially the amount of disability associated with the pain, are therefore the result of multiple factors. Structural pathology sets the stage and is the origin of the painful stimulus. The natural healing process, in most situations, results in the resolution of back pain within relatively short periods. Physical stress placed on the back through work and leisure activities may slow the healing process or irritate spinal pathology such as degenerative changes or disc protrusion. It is, however, the psychosocial situation
of the patient that determines the level of discomfort and the response of a patient to the painful stimulus. The patient’s psychological state, level of satisfaction with work and personal life as well as his/her social and spiritual life may impact upon the central modu-lation system in the brain and modify the response to pain.
In this volume, a great deal of emphasis is placed on visualization of spinal lesions that can result in spinal pain. To rely on anatomical changes to deter-mine the cause of back pain can, however, be very misleading to the clinician through the mechanisms described above. There are other examples in science that can be used as a model for looking at spinal pain. The Danish pioneer of quantum physics, Niels Bohr, claimed that science does not adequately explain the way the world is but rather only the way we, as observers,interactwith this world. Early in the last century, it was discovered that light could be explained in terms of either waves or particles, depending on the type of experiment that was set up by the observer. Bohr postulated that it was the interactionbetween the scientist, as the observer, and the phenomenon being studied, in this case light, that was important. The same thing can be said for Figure 1.5 A model for spinal disability
This model is one manner of visualizing the interaction of spine pathology, work requirements and psychosocial factors in the genesis of back pain and its resulting disability
the clinician approaching a patient with back pain. The conclusions reached by the clinician regarding the etiology of back pain in a specific case are often dependent on the interaction between the patient and the clinician and the training and experience brought to the decision-making process by both indi-viduals.
There are other ways of looking at back pain. Chaos theory postulates that there is a delicate balance between disorder and order. The origin of the universe is generally explained by the ‘Big Bang’ theory which states that, in the beginning, there was total disorder which was followed by the gradual imposition of order through the creation of galaxies, stars and planets. This process is perceived as occur-ring through a delicate balance between the forces of gravity and the effects of the initial explosion. This process emphasizes that small changes at the begin-ning of a process or reaction can result in large changes over time. If one applies this analogy to the interaction between patients with back pain and their physicians, the outcome of treatment can be perceived as being impacted upon by a number of beneficial influences or ‘little nudges’ and harmful attitudes or ‘little ripples’ (Table 1). The patient’s symptoms can be positively impacted through such processes as listening, caring, laughter, explanation, encouragement, attention to detail and even prayer and negatively impacted by fear, anxiety, anger, uncertainty, boredom and haste. The manner in which a physician uses these nudges and helps the patient avoid the ripples can have a large effect on the impact of back pain on the patient’s life. The most accurate diagnosis possible is dependent on
accurately observing and listening to the patient, the physical examination and the results of all testing in combination with the intuition that is gained from experience from treating multiple similar patients.
The fine balance between different factors impacting on back pain can be illustrated by a few simple examples.
Example 1
A 50-year-old woman presented to her doctor with symptoms and signs of a disc herniation confirmed by CT scan. She was the owner of a small cattle range and was worried about the condition of her animals. She underwent surgery to correct the disc herniation but her convalescence was prolonged for no apparent reason. After several months, the condi-tion of her cattle herd improved and, at the same time, the patient’s symptoms improved. This raises the question as to the link between the patient’s symptoms, the disc herniation and the condition of her cattle.
Example 2
A 45-year-old gentleman in a position with a respon-sible insurance company presented to his doctor with symptoms and signs of severe L4–5 instability confirmed by stress X-rays. The patient underwent a posterolateral fusion. At 3 months, the fusion was solid but the patient’s symptoms did not improve. Further questioning revealed that he felt stressed and was unhappy in his work. At 6 months, he became symptom-free without further treatment. The only evident change in his status was the resolution of his difficulties at work.
Example 3
A 35-year-old gentleman with a wife and two small children was admitted to the hospital on an emer-gency basis with suspected cauda equina syndrome. A psychotherapist assigned to the case discovered that the patient found the presence of his mother-in-law intolerable. Arrangements were made for the mother-in-law to live elsewhere and the patient made an uneventful recovery without the necessity of surgery.
REFERENCES
1. Andersson GBJ. The epidemiology of spinal disor-ders. In Frymoyer JW, ed.The Adult Spine, Principles
and Practice, 2nd edn. Philadelphia:
Lippincott-Raven, 1997
2. Burton AK, Clarke RD, McClune TD, Tillotson KM. The natural history of low back pain in adolescents.
Spine1996;21:2323–8
3. Taimela S, Kujala UM, Salminem JJ, Viljanen T. The prevalence of low back pain among children and adolescents. A nationwide, cohort-based question-naire survey in Finland. Spine1997;22:1132–6 4. Frymoyer JW, ed. The Adult Spine. Principles and
Practice, 2nd edn. Philadelphia: Lippincott-Raven, 1997
5. Boden S, Davis DO, Dina TS, Patronas NJ, Wiesel SW. Abnormal magnetic-resonance scans of the lumbar spine in asymptomatic subjects. J Bone Joint Surg1990;72-A(3):403–8
6. Hartvigsen J, Bakketeig LS, Leboeuf-Y de C, Engberg M, Lauritzen T. The association between physical workload and low back pain clouded by the "healthy worker" effect. Spine2001;26:1788–93
7. Kuslich SD, Ulstrom CL, Michael CJ. The tissue origin of low back pain and sciatica: a report of pain response to tissue stimulation during operations on the lumbar spine using local anesthesia. Orthop Clin N Am1991;22:181
8. Bigos SJ, Battie MC. Risk factors for industrial back problems. Semin Spine Surg1992;4:2
9. Kelsey J, Golden A. Occupational and workplace factors associated with low back pain. Spine1987; 2:7
10. Sanderson PL, Todd BD, Holt GR, et al. Compensation, work status, and disability in low back pain patients. Spine1995;20:554
2
Normal spinal anatomy and physiology
The spine is one of the most complex structures in the body. It is a structure that includes bones, muscles, ligaments, nerves and blood vessels as well as diarthrodial joints. In addition, the structures that make up the spine include the intervertebral discs, the nerve roots and dorsal root ganglia, the spinal cord and the dura mater with its spaces filled with cerebrospinal fluid. Each of these structures has unique responses to trauma, aging and activity.
THE BONY VERTEBRAE
Each of the bony elements of the back consist of a heavy kidney-shaped bony structure known as the vertebral body, a horseshoe-shaped vertebral arch made up of a lamina, pedicles and seven protruding processes. The pedicle attaches to the superior half of the vertebral body and extends backwards to the articular pillar. The articular pillar extends rostrally and caudally to form the superior and inferior facet joints. The transverse processes extend laterally from the posterior aspect of the articular pillar where it connects to a flat broad bony lamina. The laminae extend posteriorly from the left and right articular pillars and join to form the spinous process. Two adjacent vertebrae connect with each other by means of the facet joints on either side. This leaves a space between the bodies of the vertebrae which is filled with the intervertebral disc. The intervertebral foramen for the exiting nerve root is formed by the space between the adjacent pedicles, facet joints and the vertebral body and disc. The integrity of the nerve root canal is therefore dependent on the integrity of the facet joints, the articular pillars, the vertebral body endplates and the intervertebral disc.
The bony vertebrae can be visualized on standard radiographs and on CT scan using X-radiation. The bones can also be visualized on MRI, although with not quite the same definition. The metabolism of the bony vertebra can be visualized by means of a technetium bone scan.
Figure 2.1 Superior view of an isolated lumbar vertebra
THE INTERVERTEBRAL DISC
The intervertebral disc is made up of an outer annulus fibrosis and a central nucleus pulposus. It is attached to the vertebral bodies above and below the disc by the superior and inferior endplates. The nucleus pulposus is a gel-like substance made up of a meshwork of collagen fibrils suspended in a mucopolysaccharide base. It has a high water content in young individuals, which gradually dimin-ishes with degenerative changes and with the natural aging process. The annulus fibrosis is made up of a series of concentric fibrocartilaginous lamellae which run at an oblique angle of about 30º orientation to the plane of the disc. The fibers of adjacent lamellae have similar arrangements, but run in opposite direc-tions. The fibers of the outer annulus lamella attach to the vertebral body and mingle with the periosteal fibers. The fibrocartilaginous endplates are made up of hyaline cartilage and attach to the subchondral bone plate of the vertebral bodies. There are multi-ple small vascular perforations in the endplate, which allow nutrition to pass to the disc.
The intervertebral disc is not seen on standard X-ray, but can be visualized by means of MRI scan and CT scan. The integrity of the inner aspects of the disc is best visualized by injecting a radio-opaque agent into the disc. This material disperses within the nucleus and can be visualized radiologically as a discogram.
THE POSTERIOR FACETS
The facet joints connect the superior facet of a verte-bra to the inferior facet of the adjacent verteverte-bra on each side and are typical synovial joints. The articu-lar surfaces are made of hyaline cartilage which is thicker in the center of the facet and thinner at the edges. A circumferential fibrous capsule, which is continuous with the ligamentum flavum ventrally, joins the two facet surfaces. Fibroadipose vascular tissue extends into the joint space from the capsule, particularly at the proximal and distal poles. This tissue has been referred to as a meniscoid which can become entrapped between the facets.
The posterior facets can be seen on X-ray but only to a limited extent. Degenerative changes and hypertrophy of the facets can be visualized to a greater extent on CT and MRI. Radio-opaque dye can also be injected into the joint and the distribu-tion of the dye measured.
Figure 2.2 Lateral view of the L3 and L4 vertebrae
This projection demonstrates the manner in which the facets join. The space between the vertebral bodies is the location of the cartilaginous intervertebral disc. Courtesy Churchill-Livingstone (Saunders) Press
Figure 2.3 Transverse view of L2 showing normal inter-vertebral disc morphology
Figure 2.4 Longitudinal view of the lumbar spine showing normal disc size and morphology
Courtesy Churchill-Livingstone (Saunders) Press
Figure 2.5 Normal discogram
Lateral view following three-level discography. None of the discs were painful during injection. There is normal contrast dispersal in the nuclear compartment at each level
Figure 2.6 Normal discogram
(a) Lateral radiograph with needle placement in the L4–L5 disc space following contrast injection; (b) post-discography CT scan in the same patient demonstrating normal contrast dispersal pattern in the nucleus
a
THE SPINAL LIGAMENTS AND MUSCLES
The vertebrae are connected by a series of longitudi-nally oriented ligaments. The most important liga-ment from a clinical perspective is the posterior longitudinal ligament, which connects to the verte-bral bodies and posterior aspect of the verteverte-bral disc and forms the anterior wall of the spinal canal. The ligamentum flavum, which has a higher elastin content, attaches between the lamina of the vertebra and extends into the anterior capsule of the zygapophyseal joints; it attaches to the pedicles above and below, forming the posterior wall of the vertebral canal and part of the roof of the lateral foramina through which the nerve roots pass. There are also dense fibrous ligaments connecting the spinous processes and the transverse processes, as well as a number of ligaments attaching the lower lumbar vertebrae to the sacrum and pelvis.
The musculature of the spine is similar in micro-scopic structures to that of other skeletal muscles. The individual muscle cells have small peripherally located nuclei and are filled with the contractile proteins, actin and myosin. The actin and myosin form cross-striations, which are easily visualized on light microscopy of longitudinal sections of muscle. The sarcomeres formed by the actin and myosin fibrils are separated by Z-lines, to which the actin is attached, and are visible on electron microscopy. The nuclei of the muscle cells are thin, elongated and arranged along the periphery of the cells.
The muscles of the back are arranged in three layers. The most superficial, or outer layer, is made
up of large fleshy erector spinae muscles, which attach to the iliac and sacral crests inferiorly and to the spinous processes throughout the spine. In the lower lumbar region, it is a single muscle, but it divides into three distinct columns of muscles, sepa-rated by fibrous tissue. Below the erector spinae muscles is an intermediate muscle group, made up of three layers that collectively form the multifidus muscle. These muscles originate from the sacrum and the mamillary processes that expand backwards from the lumbar pedicles. They extend cranially and medially to insert into the lamina and adjacent spinous processes, one, two or three levels above their origin. The deep muscular layerconsists of small muscles arranged from one level to another between the spinous processes, transverse processes and mamillary processes and the lamina. In the lumbar spine, there are also large anterior and lateral muscles including the quadratus lumborum, psoas and iliacus muscles which attach to the anterior vertebral bodies and transverse processes.
THE NERVE ROOTS AND SPINAL CORD
The spinal canal contains and protects the spinal cord and the spinal nerves. The spinal cord projects distally through the spinal canal from the brain, to taper out at the lower first or upper second lumbar vertebral level. The lower level of the spinal cord is known as the conus medullaris, from which nerve roots descend through the spinal canal to their respective exit points. The spinal cord is ensheathed
Figure 2.7 Transverse section of normal skeletal muscle
Light microscopy. Note the small peripheral nuclei situated at the periphery of the muscle cells Courtesy Churchill-Livingstone (Saunders) Press
Figure 2.8 Longitudinal section of normal skeletal muscle
by the three layers of the meninges. The pia mater invests the conus medullaris and rootlets. The outer layer, or dura mater, is separated by a potential subdural space to the arachnoid meninges. The subarachnoid space, which separates it from the pia mater, is filled with cerebrospinal fluid, which circu-lates up and down the spinal canal. The dura mater and pia mater continue distally, ensheathing the spinal nerves to the exit points. The spinal nerves exit the spinal cord by two nerve roots. The ventral nerve root carries motor fibers which originate in the anterior horn of the spinal cord. These neurons receive direct input from motor centers in the brain and, in turn, innervate the body musculature. The sensory or dorsal nerve root carries impulses from sensory receptors in the skin, muscles and other tissues of the body to the spinal cord and from there to the brain. The cell bodies of these sensory neurons are located within the dorsal root ganglia, which can be seen as an expansion within the dorsal root. The ventral and dorsal roots join to form the spinal nerve which exits the spinal canal and imme-diately divides into an anterior and posterior primary division. The posterior primary division, or ramus, of the nerve root innervates the facet joints and the posterior musculature, as well as the major posterior ligaments. The anterior primary division, or ramus, gives rise to nerves that innervate the intervertebral disc and the anterior longitudinal ligaments, and
sends nerve fibers via the gray ramus communicans to the sympathetic ganglion chain. A small sinu-vertebral, or recurrent nerve of Von Luschka, branches from the mixed spinal nerve to innervate the posterior longitudinal ligament. The anterior primary division then travels laterally or inferiorly, depending on the vertebral level, to form the various plexuses and nerves that innervate muscles
Figure 2.9 Diagram of sarcomere morphology
Note the location of the Z-lines and the interaction between the thin actin filaments and the thicker myosin filaments. Courtesy
Figure 2.10 Normal muscle morphology
throughout the body. Inflammatory processes occur-ring within the disc activate nociceptive nerve endings which send impulses via the sinu-vertebral nerve and gray ramus communicans nerve to the spinal cord. Inflammatory changes occurring in the facet joints or dorsal muscles and ligaments activate
Figure 2.13 Normal thecal sac, S1 nerve root and sacro-iliac joint
Sagittal MRI at the level of the upper border of the sacrum demonstrating normal posterior paraspinal muscle compart-ment, sacroiliac joint and thecal sac
Figure 2.12 Normal muscle anatomy, thecal sac and dorsal root ganglion
Axial lumbar MR T2 weighted image at L4–L5 disc space demonstrating a normal-appearing thecal sac. The dorsal root ganglion of the exiting L5 nerve root is seen (arrow). The posterior paraspinal muscles are seen: multifidus, longissimus thoracis pars lumborum, and iliocostalis lumborum pars lumbo-rum (arrows). The psoas muscle is demonstrated at the antero-lateral aspect of the vertebra
Figure 2.14 Paraspinal and posterior musculature
Coronal MRI reveals details of the posterior paraspinal muscles and their insertion onto the upper border of the sacrum and posterior ilium. The multifidus (m), longissimus thoracis pars lumborum (l), and iliocostalis (i), and gluteus maximum (g) are seen. The sacroiliac joints are visible (s)
Figure 2.11 Normal muscle morphology showing mito-chondria
nociceptive fibers which travel within the dorsal primary division of the spinal nerve.
Injury or entrapment of the neural elements of the spine can result in loss of function of a single motor or sensory nerve root, if the entrapment is within the neural foramen. If the entrapment is due to stenosis or narrowing of the central canal, function within the cauda equina or spinal cord can be affected. Injury to the spinal cord can impact on the reflex centers or the sensory and motor pathways to the central control centers in the brain.
The central canal of the spine can be well visual-ized and measured on either CT or MRI scan. The spinal cord and the nerve roots in the cauda equina can also be visualized using these imaging tech-niques. The nerve roots, as they exit through the foramen, can be best seen on MRI scan and the size of the nerve root canal, which has the potential to entrap these nerves, can be measured. There is, however, marked variation in the size of the central canal and lateral foramina through which the spinal cord and nerve roots pass. The simple measurement
Figure 2.15 Normal-appearing intrathecal rootlets and basivertebral vein channels
Axial T2 weighed MR image at the pedicle level of L4. The rootlets of the cauda equina are seen in the posterior thecal sac, with the sacral rootlets more posterior in position, and the L5 rootlets positioned laterally. The basivertebral vein complex entry into the L4 vertebra (arrows) and the venous channels are visible
Figure 2.16 The innervation of the anterior spinal structures
The nerve root separates into an anterior and posterior primary division. The anterior spinal structures receive their innervation from branches originating from the anterior primary division via the recurrent sinu-vertebral nerve and the gray ramus communicans
Figure 2.17 The innervation of the posterior spinal structures
The posterior spinal structures receive their innervation from the medial, intermediate and lateral branches of the posterior primary division of the nerve root
Anterior primary division
Posterior primary division
Medial branch
Intermediate branch
Lateral branch
Body
Joint
Spinous process
Figure 2.18 Lateral view of the innervation of the spine
The gray ramus communicans connects the primary anterior division of the nerve root with the sympathetic chain. The medial branch of the posterior primary division passes under a small mamillo-accessory ligament before innervating the medial spinal muscles
Anterior longitudinal ligament
Intervertebral disc
Anterior primary division
Sympathetic chain
Gray ramus communicans
Posterior joints Posterior primary division
Medial branch
Figure 2.19 The innervation of the pelvic structures by the lower sacral and pudendal nerves
The S2, S3 and S4 spinal nerves travel through the cauda equina from the sacral spinal cord to provide motor, sensory and autonomic innervation to the pelvic and genital structures
Genitalia Urethra Anus Perineum Bulbo-cavernosus
S2, S3, S4, nerve roots
Branches
Figure 2.20 The recording of H-reflexes
S1 nerve root function can be assessed by measuring the H-reflex from the soleus/gastrocnemius muscle on stimulation of the poste-rior tibial nerve at the popliteal fossa. The latency represents the time it takes for nerve impulses to travel from the point of stimu-lation to the spinal cord. Entrapment or injury to the S1 nerve root or sciatic nerve will either decrease the amplitude and/or prolong the latency of the response
Figure 2.22 The complexity of the sciatic nerve
This diagram illustrates the difficulty in isolating an injury or entrapment of a single nerve root using a single electrodiagnostic test. The peripheral nerves receive input from multiple nerve roots. Electrodiagnostic testing often requires a battery of tests, as noted
Femoral Figure 2.21 The recording of F-responses
Proximal nerve function that includes the nerve root can be assessed by measuring the F-response from distal muscles innervated by a mixed or primary motor nerve. The nerve impulses travel through the spinal cord and connect with a Renshaw interneuron to send impulses back along the motor nerve to the distal muscles. The proximal conduction time represents the time it takes for nerve impulses to travel from the point of stimulation to the spinal cord and back to the point of stimulation. Any entrapment or injury to the nerve root or sciatic nerve will prolong the latency of the response
Figure 2.24 The four divisions of the nervous system that control bowel, bladder and sexual function
The clinical physiological tests that can be used to assess the integrity of these pathways are listed
Central sensory Figure 2.23 Somatosensory evoked responses
Cortical somatosensory evoked potentials (SEP) can be measured over the scalp using surface electrodes and computer averaging on stimulation of most peripheral sensory nerves. This diagram illustrates the response on stimulation of the posterior tibial nerve at the ankle. It is often possible to record a response over the lumbar spine as well as the scalp. The difference in latency between the spinal response and the cortical response is known as the central conduction time (CCT), and represents the time that an impulse requires to travel from the spinal cord to the brain
of the size of the canals does not confirm the pres-ence or abspres-ence of dysfunction within the spinal cord or nerve root. In order to achieve this, it is necessary to conduct a clinical examination and, where neces-sary, electrodiagnostic studies.
The diagnostic field known as clinical neurophys-iology encompasses a series of testing procedures used to detect and quantify nerve function. The primary electrodiagnostic study utilized to docu-ment nerve root entrapdocu-ment or injury is electromyo-graphy, where a needle is inserted into the muscle and the presence of denervation of the muscle can be documented. Nerve root compression results in irri-tability of the cell membranes of a muscle. This can be noted on electromyography as short fibrillation potentials and positive sharp waves, which are not seen in normally innervated muscles. Within a few months following denervation, the remaining intact nerves begin to sprout collateral nerve fibers to innervate those muscles that have lost their nerve supply. This process results in a change in the appearance of the normal muscle activity seen on electromyography, which takes on a polyphasic appearance. S1 nerve root function can also be determined by measuring neural reflexes, which travel to the spinal cord on stimulation of the sciatic nerve in the popliteal fossa, and by recording the motor response generated from these H-reflexes in the gastrocnemius muscles. The F-response is another method of measuring the motor pathway in the nerve roots which travels from a point of stimu-lation over a peripheral nerve to the spinal cord and back to the muscle. A battery of these tests is often necessary to localize the nerve root that is affected, because peripheral nerves and muscles are often
innervated by multiple nerve roots which join within the sciatic and brachial plexuses. The documenta-tion of nerve pathways within the spinal cord is achieved by stimulating a peripheral sensory nerve and recording electrical responses, using computer averaging over the spine and over the brain. Delay or absence of these somatosensory evoked responses or potentials is strongly suggestive of a lesion impact-ing on the sensory pathways within the spinal cord. The differentiation of peripheral nerve lesions or injury distal to the nerve root is achieved by measur-ing nerve conduction in peripheral nerves. The documentation of nerve injury or entrapment, affect-ing bowel, bladder and/or sexual function and numbness in the perineum and genitalia, can be made by stimulating the pudendal nerve and record-ing the bulbocavernosis reflex and cortical evoked potentials. Direct measurement of bladder function using cystometry, bowel function using colonometry and male sexual function using nocturnal penile tumescence and rigidity may also be of value if it is suspected that these functions are being affected by lesions in the cauda equina or spinal cord.
BIBLIOGRAPHY
Bogduk N. The innervation of the lumbar spine. Spine
1983;8:286
Bogduk N, Twomey LT. Clinical Anatomy of the Lumbar Spine, 2nd edn. New York: Churchill Livingstone, 1991
3
Spinal degeneration
Degenerative changes within the spine are the most common pathological finding noted on autopsy and on imaging of the spine. The process of degenerative change occurs in the entire population as it ages and is probably part of the normal aging process. The speed and extent of the degenerative changes appear to be impacted by hereditary factors as well as specific and continuous traumatic events that occur through a person’s life. Even the most severe degen-erative changes can occur in the absence of sympto-matology, but back pain is more common in individ-uals who demonstrate these degenerative changes. It appears that the degenerative changes in the spine make one more vulnerable to the inflammatory effects of trauma.
Degenerative changes are most evident in the intervertebral discs and the facet joints, usually at the same time, but often to varying degrees. It is useful to visualize the vertebral motion-segment as a ‘three-joint complex’ in which degenerative changes in the posterior facets impact the intervertebral disc, and pathological changes within the intervertebral disc will create greater stressors upon the posterior facet joints.
THE INTERVERTEBRAL DISC
Degenerative changes within the intervertebral disc usually start as small circumferential tears in the annulus fibrosus. These annular tears increase in size and coalesce to form radial fissures. The radial fissures then expand and extend into the nucleus pulposus, disrupting the disc structure internally. There is a loss of proteoglycans and water content from the nucleus which results in a loss of the height
Figure 3.1 Early stage of disc degeneration, high signal intensity zone
of the disc. As degeneration continues, the disc collapses, shortening the distance between the two vertebral bodies. This re-absorption can progress to the point where the vertebral bodies are eventually separated only by dense sclerotic fibrous tissue which is all that remains of the original disc struc-ture.
At the same time as the disc is being reabsorbed, the vertebral bodies on either side of the disc become dense and sclerotic. Osteophytes extend from the vertebral bodies around its circumference, presumably in an attempt to stabilize the three-joint complex and reduce motion. Occasionally, the osteophytes may join and fuse, resulting in bony ankylosis of the joint.
THE FACET JOINTS
Degenerative changes within the posterior facet usually begin with an inflammatory synovitis, which
can lead to the formation of a synovial fold, project-ing into the joint between the cartilage surfaces. There is gradual thinning of the cartilage, which starts in the periphery with progressive loss of cartilage tissue. Subperiosteal osteophytes begin to form which enlarge both the inferior and superior facets. This breakdown continues until there is almost total loss of articular cartilage with marked periarticular fibrosis and the formation of subpe-riosteal new bone expanding the volume of the supe-rior and infesupe-rior facets. During the early phases of these degenerative changes, the facet capsule can become very lax, allowing increased movement. It is probably this period of increased mobility of the joint which leads to further degeneration within the posterior facets, and puts further stress on the inter-vertebral discs.
Figure 3.2 Stage-one degeneration of the lumbar three-joint complex
There are two small circumferential tears in the posterior annulus (arrows). This represents stage one of the degenera-tive process in the discs. The posterior facets are enlarged and the facets show degenerative changes. This demonstrates the interaction between the discs and the posterior joints. Courtesy Churchill-Livingstone (Saunders) Press
Figure 3.3 Stage-two degeneration of the three-joint complex
Figure 3.4 Stage-three degeneration of the lumbar intervertebral disc
This cross-section through a lumbar disc shows very marked degenerative changes. There is complete disintegration of the nucleus pulposus. These changes have resulted in instability of the three-joint complex at this level. Courtesy Churchill-Livingstone (Saunders) Press
Figure 3.5 Complete disintegration of the lumbar intervertebral disc
IMAGING OF DEGENERATIVE CHANGES
Degenerative change in the intervertebral disc is best visualized in its early stages on MRI scan. T2 weighted MR images of the lumbar spine measure the hydration status of the disc, which gradually decreases in the presence of degenerative changes. This results in a change in the signal intensity within the disc, which is easily seen. Radial and circumfer-ential tears can also be visualized on MR images. On CT scan imaging, gas formation can be seen within the radial tears and the annulus during the reabsorp-tion phase.
As degenerative changes progress, narrowing of the disc space from disc reabsorption can be noted on standard X-rays, as can the growth of circumfer-ential osteophytes. Sclerotic changes within the facet joints can also be noted on standard X-rays. Better visualization of these changes is achieved by means of CT scan or MR images, which can docu-ment the growth of osteophytic spurs and determine whether they encroach on the spinal canal or neuro-foramina.
Figure 3.6 Intervertebral disc resorption
Longitudinal section through the lumbar spine at L4–L5. There is almost complete resorption of the disc which is seen as a small slit between the vertebral bodies. There is sclerosis of the bone in the vertebral bodies on either side of the disc. Courtesy Churchill-Livingstone (Saunders) Press
Figure 3.7 Multilevel disc disruption
Figure 3.8 Degenerative posterior (apophyseal) joint
Anteroposterior view of the lumbar spine demonstrating increased radiodensity in the right L5–S1 posterior facet (apophyseal) joint (a). On the axial T2 magnetic resonance image, there is increased signal intensity in the right posterior (apophyseal) joint, consistent with increased synovial fluid (arrow) (b)
a
b
Figure 3.9 Degenerative spondylosis on CT scan
Axial (a) and sagittal (b) computed tomography images of degenerative lumbar spondylosis. The intervertebral disc has lost height, and there is gas in the disc space which appears black on CT images (arrow). On the axial image, there is lateral protrusion of the disc margin to the left
b a
Figure 3.10 Degenerative disc disease
Figure 3.11 Early degenerative changes in the posterior joint
This light microscopic cross-sectional view through the facet joint shows very early degenerative changes in the posterior joint. The purple-staining articular cartilage represents normal cartilage. The arrow points to a thin sausage-shaped tag of synovial tissue lying between the articular surfaces. Courtesy Churchill-Livingstone (Saunders) Press
Figure 3.12 Intermediate degeneration of the posterior joint
Figure 3.14 Degeneration and fusion of the posterior joint
Light microscopic section through the posterior joint showing marked degeneration. The joint is almost obliterated and there is carti-lagineous fusion of the two facets of the joint. The arrow points to the remnants of the joint space. This type of change occurs when there has been immobilization of the joint for prolonged periods. Courtesy Churchill-Livingstone (Saunders) Press
Figure 3.13 Advanced degeneration of the posterior joint
Figure 3.16 Degeneration with hypertrophy of the posterior joint
Light microscopic cross-sectional view of a posterior joint showing extensive hypertrophy and enlargement of the bones of the facets. The purple articular cartilage on both sides of the joint is very thin and fragmented. The arrows point to the grossly thickened capsule on both sides of the joint. Courtesy Churchill-Livingstone (Saunders) Press
Figure 3.15 Degeneration and subluxation of the posterior joint
Figure 3.17 Degeneration causing foraminal encroachment
Longitudinal sagittal section through the lumbar spine at the L4–L5 level showing advanced degeneration of the intervertebral disc and the posterior facets. The intervertebral foramen (large arrow) is much reduced in size as the result of impingement by an enlarged superior articular process of the facet of L5 (small arrow). Courtesy Churchill-Livingstone (Saunders) Press
Figure 3.18 Degeneration of the disc and posterior joints causing foraminal narrowing
BIBLIOGRAPHY
Alam F, Moss SG, Schweitzer ME. Imaging of degenerative disease of the lumbar spine and related conditions. Semin Spine Surg1999;11:76
Bernard TN. Using computed tomography and enhanced magnetic resonance imaging to distinguish between scar tissue and recurrent lumbar disc herniation. Spine
1994;19:2826
Kirkaldy-Willis WH, Wedge JH, Yong-Hing K, Reilly J. Pathology and pathogenesis of lumbar spondylosis. Spine
1978;3:319
Modic MT, Steinberg PM, Ross JS, Masaryk TJ, Carter JR. Degenerative disk disease: assessment of changes in verte-bral body marrow with MR imaging. Radiology
1988;166:193
Osti OL, Vernon-Roberts B, Moore R, Fraser RD. Annular tears and disc degeneration in the lumbar spine. J Bone Joint Surg1992;74-B:678
Selby DK, Paris SV. Anatomy of facet joints and its clini-cal correlation with low back pain. Contemp Orthop
1981;3:1097
Figure 3.19 Facet joint cyst
Axial (a) and sagittal (b) T2 weighted MR images of a facet joint cyst originating from the left L4–L5 facet joint (arrow) causing significant mass effect against the thecal sac
a
4
Acute trauma
Acute trauma, either in the form of a direct blow to the spine or the application of excessive rotational or compressive force applied to the spine, can result in injury to virtually any structure. The structures most vulnerable to acute trauma are the annulus fibrosus of the intervertebral discs, the endplates of the inter-vertebral discs and the inter-vertebral bodies.
DISC HERNIATION
When compressive or rotational forces are applied to the spine, the fibers of the annulus fibrosus can be
stretched beyond their elastic capacity and tear. If these tears are oriented in a radial fashion, the nucleus pulposus may migrate through the tear, causing a protrusion of the disc beyond its natural borders. This can occur as an acute process in a healthy disc given sufficient force. Degenerated discs that already have some degree of annular tearing, usually in a circumferential pattern, have less elastic proteoglycans and are less able to withstand these forces. If there is a disruption of the posterior longitudinal ligament, nuclear material can extrude through the annulus, narrowing the diameter of the
Figure 4.1 Central disc herniation
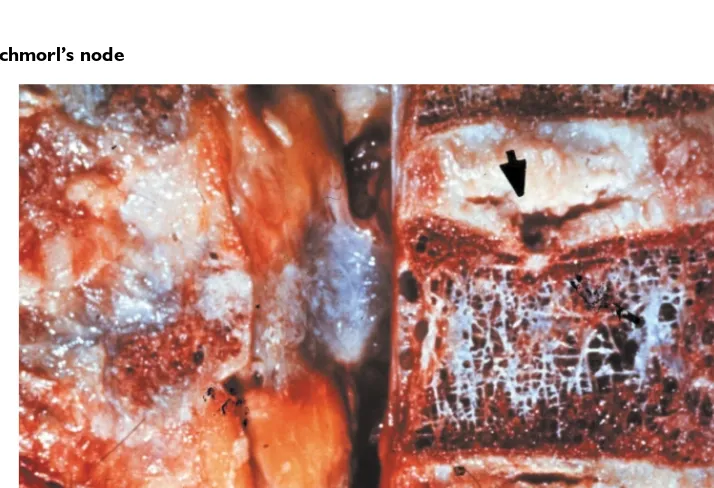
Figure 4.2 Schmorl's node
One variety of vertebral body and endplate defect allowing herniation of the nucleus pulposus into the vertebral body. (a) MRI TI weighted image revealed herniation of the L3–L4 disc into the L3 body, creating a ‘Schmorl's node’ or ‘Geipel hernia’; (b) the same patient's T2 weighed image; (c) post-discogram computed tomography sagittal reformation demonstrating a ‘Schmorl's node’
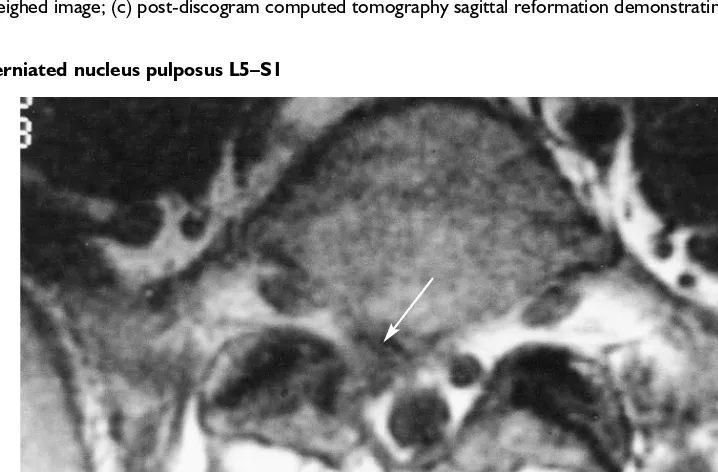
Figure 4.3 Herniated nucleus pulposus L5–S1
Axial MRI demonstrating a right-sided herniated nucleus pulposus displacing the S1 nerve root (arrow)
a c
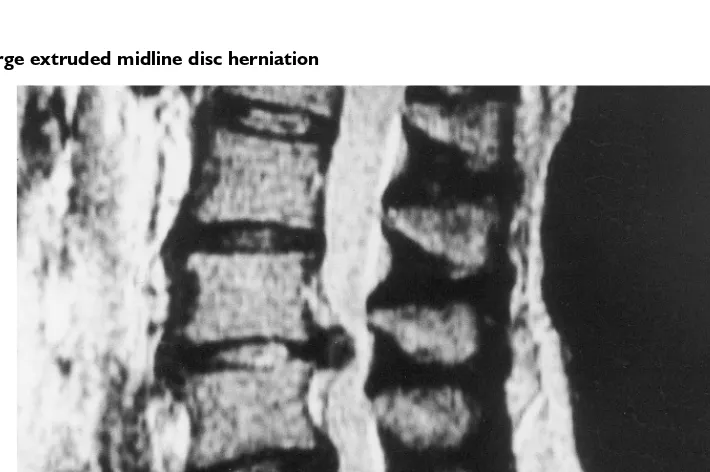
Figure 4.5 Large extruded midline disc herniation
MRI demonstrates a central disc extrusion at L3–L4. Note that the posterior longitudinal ligament has been elevated posteriorly and separated by the disc herniation. There is marked central canal stenosis caused by the disc herniation
Figure 4.4 Lateral lumbar disc herniation
Demonstration of three different imaging techniques. (a) MRI demonstrates a right-sided lateral disc herniation. The disc protrusion effaces the dorsal root ganglion (arrow); (b) non-enhanced computed tomography of the same patient reveals increased signal density of the lateral disc herniation; (c) post-discography computed tomography of the same patient demonstrates contrast enhancement of the lateral disc hernia-tion (arrow)
a
c
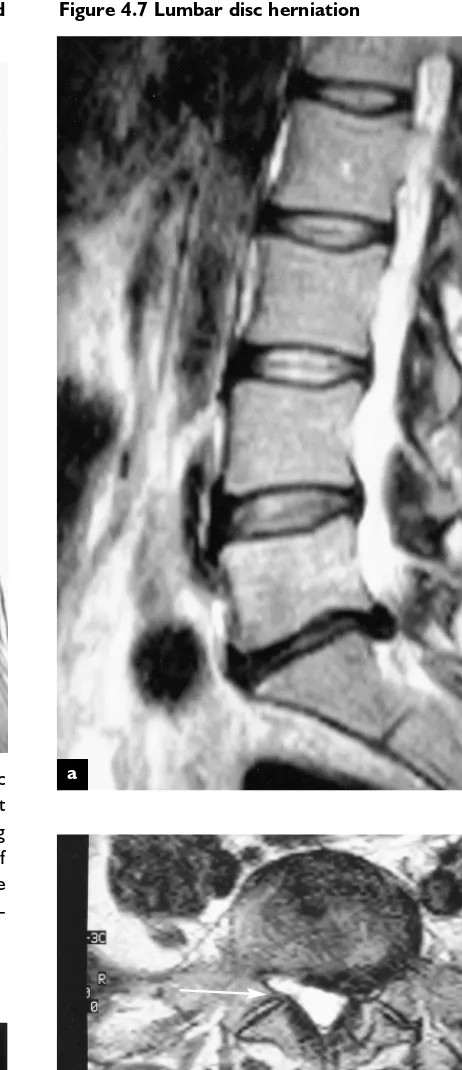
Figure 4.7 Lumbar disc herniation
Sagittal T2 weighted MR image of a lumbar disc herniation at L5–SI (a). Axial MR image demonstrating the L5–SI disc hernia-tion to the left, displacing the SI nerve root (b). The normal-appearing right SI nerve root is seen in the right subarticular recess (arrow)
Figure 4.6 Lateral disc herniation, normal nerve and muscle anatomy
Sagittal T2 weighted MR image demonstrating a lateral disc herniation at L4–L5 displacing the exiting L4 nerve root (arrow). Note the relationship between the normal-appearing nerve roots at L2 and L3 and the pedicle. The attachment of the longissimus thoracic pars lumborum to the transverse process is seen in the posterior paraspinal muscle compart-ment
Figure 4.8 Radial fissure
Post-discography CT demonstrating contrast extending through a confluence of annular tears into a radial fissure, with outer annular contrast enhancement (arrow)
a
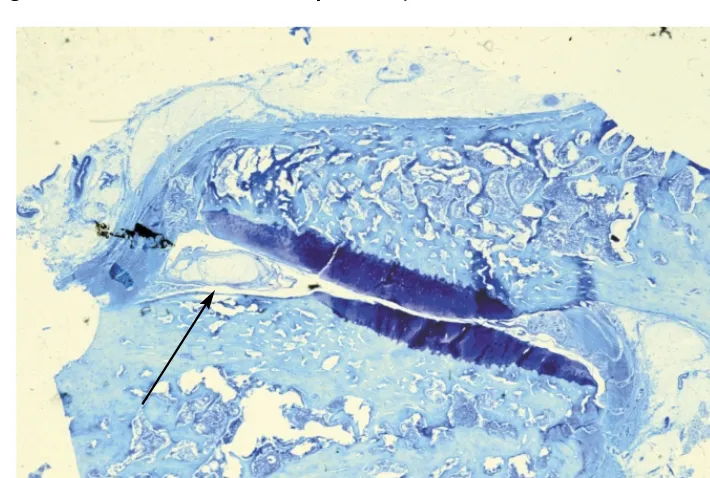
Figure 4.9 Lumbar disc herniation
Longitudinal section through the lumbar spine showing a large disc herniation at L4–L5 (large arrow). The posterior facets show degenerative changes in the form of irregular surfaces (small arrow). Courtesy Churchill-Livingstone (Saunders) Press
Figure 4.10 Schmorl’s node
neural canal. If the disc herniation protrudes poste-riorly in the midline to narrow the central canal of the spine, compression of the cauda equina or spinal cord can occur. If the disc protrudes laterally, it can extend into the lateral foramina, encroaching on the nerve root.
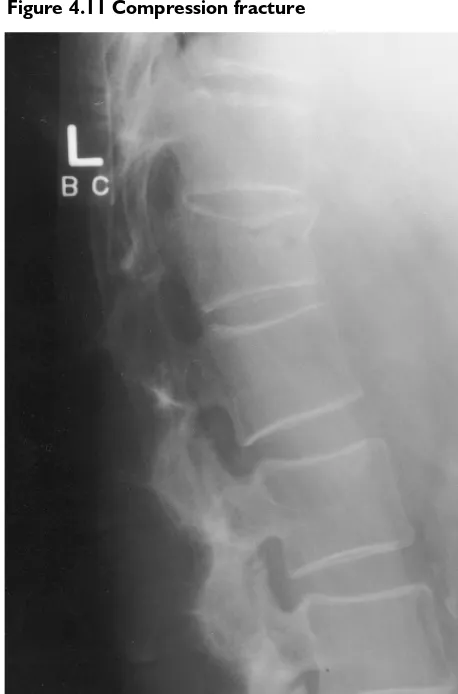
COMPRESSION FRACTURE
A direct axial force applied to the spine, especially in flexion, can result in a collapse of the vertebral body. There is a disruption of the intrinsic bone structure, followed by edema and healing of the bone. If severe, these compression fractures can force spicules of bone or the entire vertebral body to move poste-riorly, encroaching on the central canal or laterally encroaching on the neuroforamen.
As a result of compression forces, the endplate of the vertebral body may collapse, allowing herniation of the nucleus pulposus into the vertebral body. This has become known as a Schmorl’s node.
Bony fractures of the vertebral body are well visu-alized on X-ray and the edema associated with healing is visible on MRI scan. Disc herniation, however, is not seen on standard X-ray and requires either an MRI or CT scan to be visualized. Radial tears and the protrusion of the nucleus into the tear can be visualized by injecting a radio-opaque dye into the disc, which can be visualized on X-ray as a discogram. These changes are more clearly seen on post-discography CT scanning.
Electrodiagnostic evaluation is often used to document injury or encroachment on the nerve roots or the spinal cord which occurs as a result of disc
Figure 4.12 Compression fracture
Sagittal TI weighted MR demonstrating decreased signal inten-sity in the L3 vertebra, indicative of bone edema secondary to a compression fracture
Figure 4.11 Compression fracture
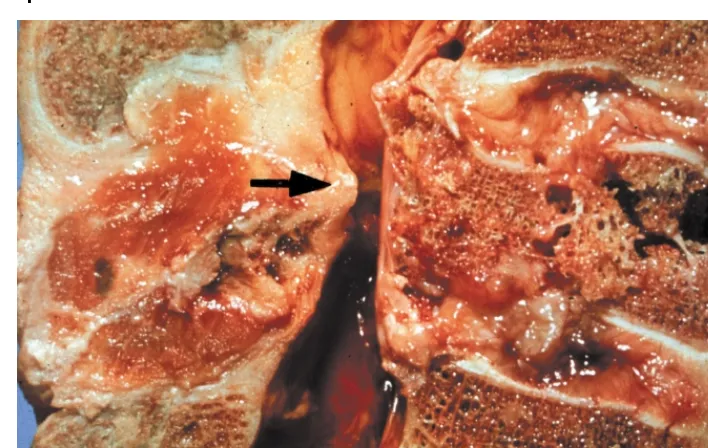
Figure 4.13 Compression fracture
Longitudinal section from L4 to the sacrum. There is a compression fracture of L5 with posterior displacement of the fractured bone, leading to marked narrowing of the central canal (arrow). Courtesy Churchill-Livingstone (Saunders) Press
Figure 4.14 Abnormal electromyography potentials
Figure 4.15 Chronic electromyographic potentials
These EMG potentials were recorded from the gastrocnemius muscle in a patient with a chronic S1 radiculopathy in the left leg. The polyphasic potentials differ from the normal potentials recorded from the normal gastrocnemius muscle in the right leg
Left Right
100 150 200 100 150 200
m/s m/s
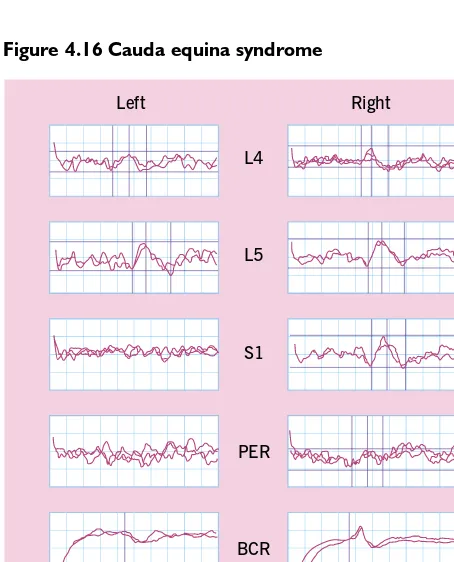
Figure 4.16 Cauda equina syndrome
Electrodiagnostic studies from a patient with unilateral cauda equina injury secondary to a lumbar disc protrusion. The corti-cal somatosensory evoked potentials on stimulation of the S1 dermatome and the pudendal nerve are unobtainable on the symptomatic side, whereas the responses on stimulation of the L4 and L5 dermatomes are normal. There is also an abnormal bulbocavernosus reflex on the left or symptomatic side
Left Right
herniation or fracture. Radiculopathy can be docu-mented by noting denervation on needle elec-tromyography of the muscles served by the involved nerve root. Nerve compression of the S1 nerve root can also result in a delay of the H-reflex on stimula-tion of the tibial nerve in the popliteal fossa. A delay in F-response can be noted in cauda equina syndrome or multiple level radiculopathy. Somatosensory evoked responses will show delayed or absence latency which can occur as a result of compression of the spinal cord or cauda equina.
BIBLIOGRAPHY
Spivak JM, Vaccaro AR, Cotler JM. Thoracolumbar spine trauma. I. Evaluation and classification. J Am Acad Orthopaed Surg1995;3:345
Spivak JM, Vaccaro AR, Cotler JM. Thoracolumbar spine trauma. II. Principles of management. J Am Acad Orthopaed Surg1995;3:353
5
Chronic pathological changes
The effects of acute and cumulative trauma result in progressive degenerative changes that affect both the intervertebral disc and the posterior facets and can be found at multiple levels of the spine. Multilevel degenerative changes can result in decreased mobil-ity of the spine and even fusion between the inter-vertebral bodies. Disc herniation, especially when painful, also results in reduced mobility and dimin-ished levels of activity. These chronic changes
asso-ciated with degenerative changes and disc herniation can have profound effects on the sensitive structures within the spinal canal and the spinal musculature.
SPINAL STENOSIS
The expansion of the facet joints as a result of degen-erative changes can encroach on the central canal and the lateral foramina. This encroachment can
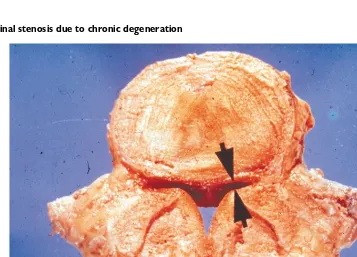
Figure 5.1 Spinal stenosis due to chronic degeneration
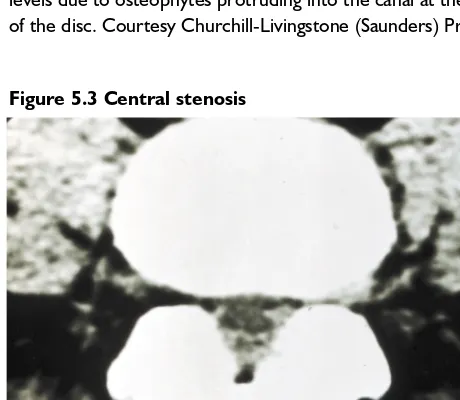
Figure 5.3 Central stenosis
This CT transverse section through the lumbar spine shows marked central canal stenosis. The posterior muscle has been partially replaced by fibrofatty tissue. Courtesy Churchill-Livingstone (Saunders) Press
Figure 5.2 Advanced degeneration and bony fusion
Longitudinal section through the lumbar spine shows marked degeneration and fusion of the bodies of L4–L5 and L5–S1. There is stenosis or narrowing of the central canal at both levels due to osteophytes protruding into the canal at the level of the disc. Courtesy Churchill-Livingstone (Saunders) Press
Figure 5.4 Central canal stenosis
T2 weighted MR sagittal image of the lumbar spine (a), demon-strating high-grade spinal stenosis at L2–L3, L3–L4 and L4–L5. The spinal fluid has a bright signal intensity and the compression of the intrathecal rootlets is apparent. On the axial T2 MR image (b), the central canal stenosis is caused by thickening of the posterior neural arch and ligamentum flavum, and over-growth of the posterior facet joints. This causes significant flat-tening of the normally ovoid-appearing thecal sac
a a
become quite marked, especially in the presence of large osteophytes from the vertebral bodies, and can result in significant stenosis of the central canal and lateral foramina. These changes can be visualized on MRI and CT scanning, and, when severe, can disrupt function within the spinal cord and nerve roots. Such disruption can be intermittent and associated with pain or numbness in the legs on activity and which is relieved with rest, known as neurogenic claudication, or it can become permanent, leading to neurologic deficits as a result of encroachment on the spinal cord or cauda equina.
The degree of spinal stenosis can be measured on CT and MRI imaging. Hypertrophy of the posterior facets encroaching on the neuroforamen is also evident in this type of study. The effect of compres-sion on the spinal cord, cauda equina and/or nerve roots is determined by electrodiagnostic studies.
These images are from the same patient. Anteroposterior (a) and lateral (b) views of the lumbar spine following a myelogram, demon-strating a complete block of the contrast at the L2–L3 level Continued Figure 5.5 Multiple-level degenerative lumbar spondylosis and spinal stenosis
a b
MUSCLE TRAUMA, IMMOBILIZATION AND ATROPHY
Figure 5.5 continuedMultiple-level degenerative lumbar spondylosis and spinal stenosis
These images are from the same patient. Intrathecally enhanced axial computed tomogram reveals central canal stenosis secondary to posterior facet joint hypertrophy and vertebral body osteophyte formation and disc bulging (c). Sagittal proton density MR image (d) demonstrates multiple level spondylotic changes and central canal stenosis at L2–L3 and L3–L4. Axial MR image (e) reveals central canal stenosis
Figure 5.6 Electrodiagnostic studies in spinal cord injury
Somatosensory evoked responses from the posterior tibial and pudendal nerves are blocked as they travel through the spinal cord. The reflex studies from the bulbocavernosus and urethra to the rectal sphincter are intact below the level of the injury. Cystometrogram shows hyperreflexia. The spinal cord injury could be due to fracture, severe central stenosis or tumor encroaching on the neural canal
Figure 5.7 Lumbar disc protrusion
Axial CT image shows a large left-sided disc protrusion (arrow) at the L5–S1 level. The posterior muscle is replaced by fibrofatty tissue due to prolonged inactivity
Figure 5.8 Paraspinal muscle atrophy
Figure 5.10 Muscle atrophy at 7 weeks of immobilization
Light microscopy of muscle fibers following 7 weeks of immobilization. Note the larger spaces between muscle fibers, sparse nuclei and empty muscle sheaths. Courtesy Churchill-Livingstone (Saunders) Press
Figure 5.9 Muscle atrophy at 4 weeks immobilization
Figure 5.11 Muscle regeneration
Light microscopy of muscle fibers (human) showing regeneration. There is extensive replacement of muscle fibers with fibrous tissue. There are multiple thin myoblastic chains and muscle fibers with prominent central myoblastic nuclei. Courtesy Churchill-Livingstone (Saunders) Press
Figure 5.12 Muscle regeneration after direct trauma
Figure 5.14 Muscle 3 months after injury
Light microscopy of muscle (monkey) 3 months after injury. The upper field shows new muscle fibers (red). The lower field shows primarily collagen (yellow) with a few muscle fibers (red). Courtesy Churchill-Livingstone (Saunders) Press
Figure 5.13 Muscle regeneration
Figure 5.15 Muscle 3 months after injury
Light microscopy, longitudinal section of muscle fibers (monkey) 3 months after direct injury. There is a full field of new thin muscle fibers. Courtesy Churchill-Livingstone (Saunders) Press
Figure 5.16 Muscle atrophy, electron microscopy
Figure 5.18 Muscle regeneration, electron microscopy
Electron microscopy of muscle fibers (cat) 4 weeks after activity is renewed following a period of inactivity. The regeneration process can be seen in the development of new Z-lines. The arrow points to a new fiber. Courtesy Churchill-Livingstone (Saunders) Press
Figure 5.17 Muscle regeneration, electron microscopy
Figure 5.19 Muscle regeneration, electron microscopy
Electron microscopy of muscle (cat) showing regeneration. There are two new vertical Z-lines and a few transverse muscle filaments. Courtesy Churchill-Livingstone (Saunders) Press
Figure 5.20 Muscle regeneration, electron microscopy
muscle fiber and the amount of actin and myocin increases. The Z-lines begin to re-form and the nuclei migrate to the periphery of the fiber.
On CT and MR imaging of the spine, it is possi-ble to visualize these changes within the posterior musculature. With immobilization, the posterior muscles are gradually replaced by fibrofatty tissue which increases with prolonged periods of inactivity.
BIBLIOGRAPHY
Cooper RR. Alterations during immobilization and regen-eration of skeletal muscle. J Bone Joint Surg 1972;54A:919
6
Spinal deformity
Traumatic, congenital and degenerative changes can all result in deformity of spinal structures. Many of these abnormalities are of no clinical consequence, but under certain circumstances can predispose a patient to increasing pain. Other deformities such as scoliosis can result in cosmetic and functional diffi-culties.
SPONDYLOLYSIS
The vertebral arch attaches to the vertebral body through the pedicles. The laminae originate from the pedicle at a comparatively weak area known as the pars interarticularis or isthmus. In childhood and adolescence, this area is subject to fatigue fracture, which may not heal properly and can lead to a fibrous union rather than a stable bony union. This can happen unilaterally or bilaterally. If it occurs
Figure 6.1 Spondylolysis
Oblique radiographic view of the lumbar spine with a spondylolysis at L3 (arrow) (a). Axial CT demonstrates the neural arch defect in the pars interarticularis (b)