CHAPTER III
RESEARCH METHOD
In this chapter, the writer explains a research design used in this study. It contains method of study, population and sampling technique, method of the data collection, and data analysis procedure.
A. Research Type
Considering the purposes of the research and the nature of the problems, the type of research was quantitative research using cluster sampling. The researcher took two classes as experimental and control class. Experiment class was sample class that gave treatment which the teaching learning process used crossword puzzle. In the other hand control class was class that the teaching learning process did not use crossword puzzle in teaching.
B. Research Design
This study include quantitative paradigm with quasi experiment research. Quasi-experimental design is not based on random assignment of subjects to experimental and control groups. The experimental group decided by which settings (e.g. schools, classrooms, factories) have volunteered or been selected to be part of the intervention.1
This research is aimed at finding out whether is Crossword Puzzle effective in teaching English vocabulary.
1
C. Variable of the Study
According to Arikunto, variables are the object of the research.2 As the experimental study, there are two variables of the study, they are
1. The independent variable of the study (X) is crossword puzzle that is used in teaching vocabulary for the Eleventh Grade Students of SMA Muhammadiyah 1 Palangka Raya.
2. The dependent variable of the study (Y) is the result of the students’ vocabulary scores of the Eleventh Grade of SMA Muhammadiyah 1 Palangka Raya.
D. Population and Sampling Technique
1. Population
A population is defined as all numbers of any well defined class of people, events, or objects. If someone wants to research all of the elements in research area, his/her research is called population research on census study. 3 The population of the study is the eleventh grade students of SMA Muhammadiyah 1 Palangka Raya.
The writer takes eleventh grade students of SMA Muhammadiyah 1 Palangka Raya, which consisted of four classes, XI-IPA.1 consisted of 30
2
Suharmi, Arikunto, Prosedure Penelitian Suatu Pendekatan dan Praktik, Jakarta: Rineka Cipta, 2006, p.118.
3
students, XI-IPA.2 consisted of 28 students, XI-IPS.1 consisted of 24 students and XI-IPS.2 consisted of 25 students, and the total of them are 107 students.
Table 1.1
The number of the Eleventh Grade Students of SMA Muhammadiyah 1 Palangka Raya
No Grades The Number Of The Students
1 XI IPA 1 30
2 XI IPA 2 28
3 XI IPS 1 24
4 XI IPS 2 25
The Total Number 107
2. Sample
Sample is the population in a research. The samples are chosen from the eleventh grade students of SMA Muhammadiyah 1 Palangka Raya. The writer takes some of them as sample of the study by using cluster sampling. Cluster sampling is used if population is not consist of individual but group or cluster. Therefore, the use of cluster sampling is because the sample of the study should be in group or class, where the class has determined by the school.4 They experimental class was XI IPA 1 (30) and control class was XI IPA 2 (28). So, samplings are 58 students.
4
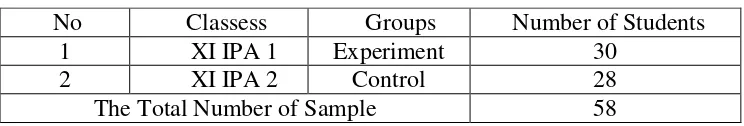
Table 2.1
The Sample of the Study
No Classess Groups Number of Students
1 XI IPA 1 Experiment 30
2 XI IPA 2 Control 28
The Total Number of Sample 58
Based on the table above, there are 30 students in class XI IPA 1 that are taught using Crossword Puzzle, and there are 28 students in class XI IPA 2 that are taught without using crossword puzzle. The control class taught by using communicative approach that usually used by the English teacher at eleventh grade students of SMA Muhammadiyah 1 Palangka Raya.
C. Time and Place of the Study
The study was conducted at SMA Muhammadiyah 1 Palangka Raya of 2014/2015 academic year. The writer started the research from 08 September 2014 - 08 November 2014.
E. Research Instruments
1. Test Type
The instrument is the tool or facility that can be used by researcher in setting the data to make more easily. The instrument used in this research to collect the data is test. 5 Kind of the test is crossword puzzle. The writer obtains the instrument quality consists of instrument validity, instrument reliability, and index of difficulty.
5
2. Research Instruments Try Out
The procedures of the try out were:
a. The writer tried out the test item consisted of 25 items to the students of eleventh grade students of SMA Muhammadiyah 1 Palangka Raya, they were the students of XI IPS 2. Try out was gave on September 06th 2014 and the all item of try out was valid.
b. The writer collected the answer and gives the score to the sheets answer.
c. The writer analyzed the respondents’ scores to find out instrument validity, reliability, and index of difficulty.
To measure the validity of the instrument, the writer used the formulation of Product Moment by Pearson as follows.6
rxy = ___ N∑XY-(∑X)( ∑Y)_______
√
Where:
rxy : Total coefficient of correlation ∑X : Total Value of Score X
∑Y : Total Value of Score Y
∑XY : Multiplication Result between Score X and Y
N : Number of students.
6
Interpretation:
The criteria of interpretation the validity:7 0.800 – 1.000 = very high validity 0.600 – 0.799 = high validity 0.400 – 0.599 = fair validity 0.200 – 0.399 = poor validity 0.00 – 0.199 = very poor validity
Based on the explanation above, in making the test the researcher was try to match each of the items test with the curriculum that is used by SMA Muhammadiyah 1 Palangka Raya. The purpose is to make the test is appropriate with the lesson that the students accept in the moment when the research was done.
3. Research instruments Reliability
Reliability is a necessary of any good test: for to be valid at all, a test must first be reliable as a measuring instrument. If the test is administered to the same candidates on different occasions (with no language practice
7
Ibid,. p. 120
work taking place between these occasions). Then, to extent that it produces differing result, it is not reliable.8
To determine the instrument reliability of the objective form, the writer uses single test single trial method. It only needed a group subject, a kind of instrument test and a test.
The formula of instrument reliability is,9
11 Vt = the standard deviation of all the testers’ score The steps in determining the reliability of the test were: a. Making tabulating of tests scores.
b. Measuring the mean of the tester’s scores with the formula : M=
N Y
c. Measuring the total variants with the formula:10
Vt= Research in Education, 8th ED., USA: Wadsworth Cengage Leraning, 2010, p.148
9
Suharsimi Arikunto, Prosedur Penelitian, p. 108.
10
Where:
Vt = the total variants
∑Y = the total of score
∑Y2
= the square of score total
N = the number of testes
d. Calculating the instrument reliability using KR-21.
e. The last decision is comparing the value of 11 and t
f. Knowing the level of reliability of instrument, the value of 11 was interpret
based on the qualification of reliability as follows:11
0.800- 1.000: Very High Reliability
0.600-0.799 : High Reliability
0.400-0.599 : Fair Reliability
0.200-0.399 : Poor Reliability
0.000-0.199 : Very Poor Reliability
11
Suharsimi Arikunto, Dasar-Dasar Evaluasi Pendidikan, Jakarta: Bumi Aksara, p. 210.
11
> rtable = Reliable
11
From the measurement of instrument try out reliability it is known that the whole numbers of test items are reliable and could be used as the instrument of the study.
4. Research Instruments Validity
Heaton stated that: “the validity of a test that is the extent to which it
measures what is supposed to measure and nothing else”.12
Validity is more important than reliability, because if an instrument does not accurately measure what it is supposed to, there is no reason to use it even if it measure consistently (reliably). The test can be said valid if it able to measure what it is suppose to be measure. In learning foreign language research, there are several types of validity such as follow:
a. Face validity
The types of face validity, if the test items look right to other testers, teacher, indicators and test. The types of test items, which would use in this research, can be suitable to the others at the same level is Islamic Senior High school.
Face validity of the test items as follow:
1) The test uses vocabulary test in crossword puzzle test instruction. 2) The evaluation by crossword puzzle test based on scoring system. 3) Kind of the crossword puzzle test is general noun in Report Text. 4) The Language of items use English
12
5) The crossword puzzle test is suitable with syllabus of English for eleventh grade students at SMA Muhammadiyah 1 Palangka Raya b. Content Validity
This kind of validity depends on a careful analysis of the language being tested being testes and of the particular course objective. The test should be so constructed as to contain a representative sample of the course, the relationship between the test items and the course objective always being apparent.13 The instrument which is using test, the tasting of content validity is done by asking the opinion of the judgment experts about the instrument is able to try out or not.
c. Construct Validity
It is capable of measuring certain specific characteristics in accordance with a theory of language behavior and learning. This type of validity assumes the existence of certain learning theories or constructs underlying the acquisition of abilities and skill.14 After the Instrument finished check by the judgment experts, continued testing of construct validity. It is conducted by field test. In order to find the validity, product moment Correlation will use as the formula to
13
J. B. Heaton, Writing English Language tests, Longman, 1974, p. 154
calculate from the try-out test result. The formula is as follows. To know the validity level of the instrument, the result of the test will interprets to the criteria below:
0.800-1.000 = Very High Validity 0.600-0.799 = High Validity 0.400-0.599 = Fair Validity
0.200-0.399 = poor Validity 0.00-0.199.1 = very Poor Validity
F. Data Collection
To get the data that is needed in this research, the writer used some techniques based on the design of the study:
1. The writer observes to the school and asks to the English teacher in order to find the general information about eleventh grade students of SMA Muhammadiyah 1 Palangka Raya. The activities are done to get the data about the number of class, the number of students, and the teaching learning English process.
2. The writer gave try out to students.
3. The writer divides the class into experiment class and control class. 4. The writer gave pre-test to the both classes.
6. The writer gave treatment to the experiment class by teaching vocabulary using crossword puzzle and taught vocabulary to the control class using communicative approach.
7. The writer gave post-test to the both classes.
8. The writer gave score from the pre-test and post-test done.
9. The writer analyzes the data obtained from pre-test and post-test score into calculation of mean, standard deviation, standard error of mean, and t-test.
10. The writer interpreted and concludes the result of data analysis.
G. Data Analysis
1. Technique of Analyzing Data
Before analyzing data using T-test, the writer fulfills the requirements of T-test. They are Normality test, and Homogeneity test.
a) Normality Test
It is used to know the normality of the data that is going to be analyzed whether both groups have normal distribution or not.
Chi square is used here.15
=
Notice:
= Chi square
15
= frequency from observation
= expected frequency
Calculation result of is compared with x table by 5% degree of
significance. If is lower than x table so the distribution list is normal. In addition, the SPSS program is applied to see the normality.
b) Homogeneity Test
It is used to know whether experimental group and control group, that are decided, come from population that has relatively same variant or not. The formula is:16
F =
Notice:
F : Frequence
The hypotheses in homogeneity:
Fvalue≤ Ftable, means both of variants are homogeneity Fvalue>Ftable, both of variants are homogeneity
If calculations result of F is lower than F table by5% degree of significance so Ho is accepted, it means both groups have same variant. In addition, the SPSS program is applied to see the homogeneity.
c) Index of Difficulty
The index of difficulty is used to know whether the students can accept
16
the test or not, whether the test are too easy, accepted or too difficult for them. To know the level of instrument difficulty, the writer uses formula as follows:17
Where:
F. V = facility value
R = Represent the number of correct answer N = the number of students taking the test
Then the result of the formula above was related to the value of F.V as in the following classification:18
F.V 0.00-0.30 = Difficult F.V 0.30-0.70 = Fair F.V 0.70-1.00 = Easy
2. Data Analysis Procedures
In this research, the researcher applied some steps to analyze the data as follows:
1. Giving the test to the students of eleventh grade students of SMA Muhammadiyah 1 Palangka Raya
17
Suharsimi Arikunto, Dasar-Dasar Evaluasi Pendidikan, Jakarta: Bumi Aksara, p. 210. 18
Ibid, p. 215
2. Collecting the data of the students’ work sheet tests result
3. Giving score to the students’ test result by using the formula:19
Score = x 100
Note, B : Frequency of the correct answers N : Number of test item
4. Tabulating the students’ score into distribution of frequency in the
table, then find out the mean of students’ score, standard deviation, and
standard error of variable X1 ( experimental group ) and X2 ( control group )
5. Analyzing the data by using t-test to test the hypothesis, “t” test formula shown to the following formula20,
Note, : The difference of two means
: The standard error of the difference between two means
a. If t- test ( test value ) ≥ , it means Ha is accepted and Ho is rejected
b. If t- test ( test value ) ≤ , it means Ha is rejected and Ho is accepted
19
Anas Sudijo, Pengantar Statistik Pendidikan, p. 233
20
6. Interpreting the result of t-test. Previously, the researcher accounts the degrees of freedom ( df ) with the formula21 :
df = ( - 2 )
Note,
df : degrees of freedom
N1 : Number of subject group 1
N2: Number of subject group 2
2: Number of variable
7. Making the conclusion of data analysis obtained
8. Using SPSS program to compare the data
9. Making discussion and conclusion the result of data analysis
21