323
THE EFFECTIVENESS OF COASTLINE PROTECTION
STRUCTURE AT ESTUARY OF BATANG KAMBANG, WEST
SUMATRA
Bambang Istijono1*, Ali Musri2, and Rahmad Yuhendra3 1Lecturer of Engineering Faculty of Andalas University
2Head of Provincial Ofice of West Sumatra for Water Resources Management 3Technical Staff of Provincial Ofice of West Sumatra for Water Resources Management
*Email: [email protected]; Phone: +62811664421
Abstract
To observe changes of shoreline and the effectiveness of structural coastline protection require the comparison and responses of the coast itself. To identify and to predict the dynamics of the coastline had been analysed by SMS (Shoreline Modelling System) and has been developed by CERC (Coastal Engineering Research Center), US Army Engineers Waterways Experiment Station. Existing condition simulated to analyse of 10 years record of wave data for the original shoreline and structural to see the effectiveness of protection each year. The original condition of the model had shown the changes of shoreline at estuary affected by the wave and structural designed by groyne and revetment indicated siginiicantly protect of shore erosion. Wave transformation model result for wave direction come from southwest and the wave after transformation at groyne is around 2.5 – 3.0 m height and 5.04 m at sea. Shoreline at northern part of estuary Batang
Kambang River has been eroded and affected by the groyne construction at southern part. If there are no paralel construction for groyne between the old and the new estuary of Batang Kambang River it will give dramatically impact of erosion. The effectiveness of groyne construction give a new treatment for the shoreline and need special maintenance for sand nourishment if the segment of the shore is not comprehensively constructed.
Keywords: shoreline modelling system, erosion, groyne, revetment
INTRODUCTION
General Background
324
at the area. Analysis method for the shoreline alteration is SMS (Shoreline Modelling System) and has been developed by CERC (Coastal Engineering Research Center), US Army Engineers Waterways Experiment Station. Existing condition simulated to analyse of 10 years record of wave data for the original shoreline and structural to see the effectiveness of protection each year.
Literature Study
Final Report Study of Critical of Coastal Area in Pesisir Selatan Sumatera Barat, Balai Wilayah Sungai Sumatera V, 2010, support this paper for identiication and analysis. Some equation for wave mild-slope 2D has been good accepted as one of the method for gravitational wave at shore (Chang HH, 1987; Berkhoff, 1976; Tsay and Liu, 1983). Formula which is used:
...(1)
where :
( )
ˆ x y,
η = surface elevation as complex function σ = wave frequency
corelation of disperse linier :
( )
2
tanh
gk kd
σ = ...(3)
325 where w is friction factor and g are breakwaver parameter. Friction factor which is used by CGWAVE :
(
)
Where a = (H/2) as wave amplitude dan fr is friction coeficient based on Reynolds and basic roughness by Madsen (1976) dan Dalrymple et.al. (1984). The value of fr is the same with the range for Manning coeficient dissipation. The function of fr as (x,y) so that can be formulated as the loss of wave energy. For breakwave parameter γ, used : whereχ is constant and G empiric constant.
Corelation of nonlinear disperse used equation (2) :
326
Methodology of Study
4
Creating Study Area Mesh Grid
Using bathymetry field survey result
Running Hydrodynamic Simulation
January-December, 2007
Calibration
Mathematic Model Solution ≈ Existing Environmental Condition concerning:
Water Surface Elevation from Running Result ≈Water Surface Elevation on Survey Location Determining Study Area Boundary Conditions
BC Water surface elevation BC River flow rate
Input data:
Manning Roughness Coefficient (n) Turbulent Exchange Coefficient () Water Temperature, Model Control, etc
Running Hydrodynamic Simulation for 1 Year
Using Bathymetry from Field Survey Result
Iteration
Running Temperature Simulation
Using - Calibrated Mathematic Model Result Data - Temperature Data
- Bathymetry Data
Current, Water Surface Elevation, Temperature Distribution
First step was hydrodynamics simulation estimated by SMS to make some grid on bahtymetric map and designed by CAD software. Beside that, GFGEN (Geometri File Generation) is a program in SMS to make geometry
327
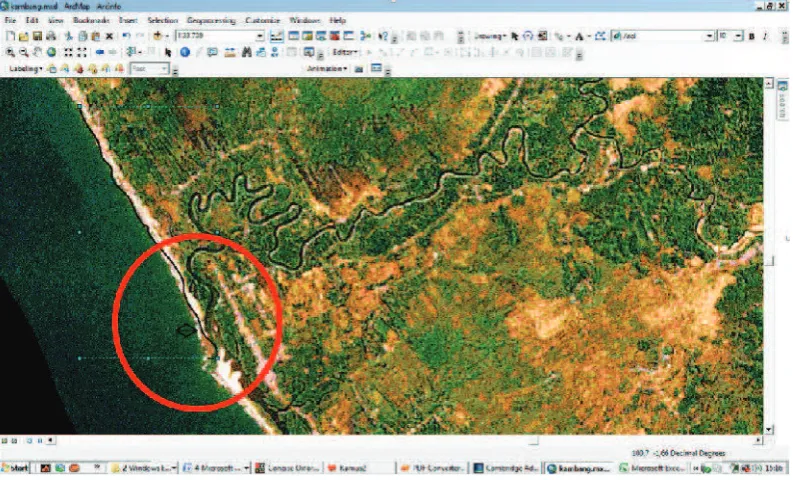
Second step, shoreline analysis compared the two different images (topographical map and satellite image), even the scale of the map is only
1:50,000, but the shoreline and the estruary can be analysed signiicantly,
where the sand of the shore eroded.
RESULTS AND DISCUSSION
Result of Wave Analysis
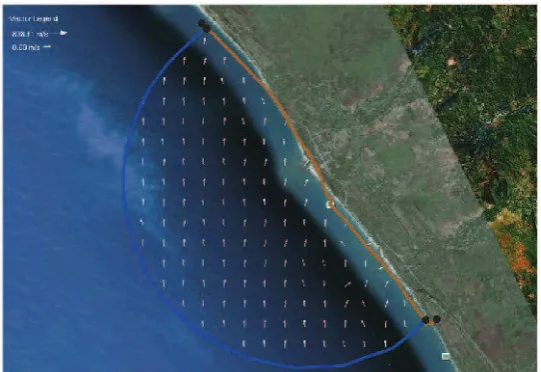
Transformation wave model from south west at study area is shown in Figure 1 and vector direction creeping and vector of the wave are shown in Figure 2 and 3. Based on the model for wave after transformation estimated around 2.5 - 3.0 meters for the height of structural coastline protection and the model for wave height at sea was around 5.04 m.
Figure 1. Mesh Module Wave Height Figure 2. Mesh Area Model Location
328
Result of Shoreline Analysis
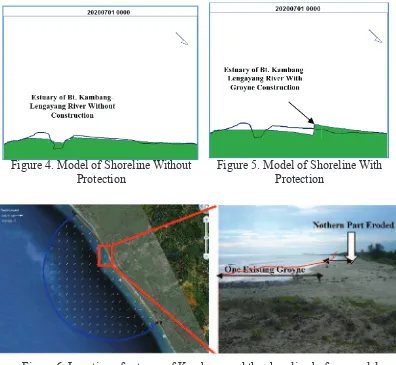
The original condition of the model had shown the changes of shoreline at estuary affected by the wave (Figure 5. Structural designed by groyne indicated siginiicantly eroded.
Figure 4. Model of Shoreline Without Protection
Figure 5. Model of Shoreline With Protection
Figure 6. Location of estuary of Kambang and the shoreline before paralel structural protection at nothern part
329 Figure 7. Topographical Map 1990, Analysis for Shoreline Identiication at
Kambang Before Construction
Figure 8. Satellite Image 2002, Analysis for Shoreline Indentiication at Kambang Before Construction
330
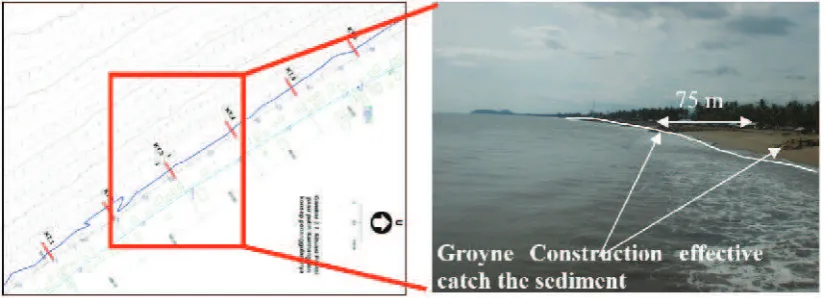
Comparison Shoreline after Structural Construction (Groyne and Revetment) between Model and Real Condition on Field
Figure 9. Model Layout Real Condition Figure 10. Groyne Construction,
30 April 2013
Figure 11. Shoreline Model Figure 12. New Jetty Estuary of Kambang
One year after shoreline protection combination with groyne and revetment have adequate effective, but it is not the same with the model. Incremental of shoreline signiicantly move forward around 75 m to the sea (Figure 10).
CONCLUSION AND RECOMMENDATION
331 for settlements and national road. The writer is still observing the dynamics of the movement of the coast for the next 10 years to see the changes and the impact both at the estuary and the coast.
One year after shoreline protection combination with groyne and revetment have adequate effective, but it is not the same with the model. Incremental of shoreline signiicantly move forward around 75 m to the sea.
ACKNOWLEDGEMENTS
This paper based on inal report study of critical coastal in Pesisir Selatan District of West Sumatra, 2010 funded by APBN through Balai Wilayah Sungai Sumatera V, before the physical construction were build in February - August 2012. In this case the writer would like to know and compare the analysis of model of the wave, the shoreline and the structural approach to the real condition after the groyne and revetment constructed. This paper would like to ind out the effectiveness of structural coastline protection to catch sediment and give more line of the coast forward to the sea for the next time eventhough in decade or century.
REFERENCES
Chang, HH, 1987, Fluvial W.S Kleiner Process in River Engineering, John Wiley & Sons, New York
Cheong H.F and Shen HW, 1983 Statistical Properties of Sediment Movement, J. Hydraulic Eng 109 (12), pp 1577-88
Dalrymple, R.A and Kirby, J.T, 1988. Models for Very Wide-Angle Water Wave and Wave Difraction, J. Fluid Mech, 192 pp 33-50
Liu, P.L-F and Tsay P.L-F, 1984. Refraction-Difraction Model for Weakly Nonlinear Water Wave, J. Fluid Mech, 141, pp. 265-274
Madsen, P.A and Larsen J, 1987. An Eficient Finite-Difference Approach to the Mild-Slope Equation, Coastal Engineering