14
Indonesia
Cascade of HIV testing, care and treatment services, 2014–2015
H I V t e s t i n g, c a r e a n d t r e a t m e n t
Figure 1:
Cascade of diagnosis and treatment for people living with HIV
Country Statistics 2015
Population (million)
(a)Income level
(b)Life expectancy at birth (male/female)
(c)Fertility rate, total (births per woman)
(d)Infant mortality rate per 1000 live births
(e)Maternal deaths per 100,000 births
(d)Proportion of births attended by skilled health personnel
(f)257
Lower-middle-income
66.6/70.7
2.5
22.8
126
88.6%
Estimated
number of
PLHIV
Number
of people
diagnosed
Number
of people
enrolled
in care
Number
of people
on ART
Number of
people who
obtained
viral load
Number of people
who achieved
viral suppression
(<1000 copies/ml)
657 975
160 138
166 975
50 400
NA
NA
395 655
65 657 262 320
94 481
691 076
177 754
200 618
63 066
NA
NA
432 572
258 504
108 430 125 494
69 324 75 124
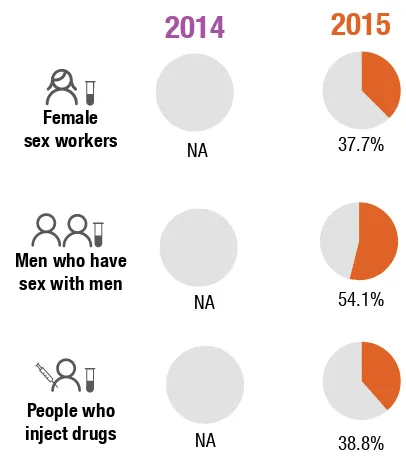
Figure 2:
Percentage of key populations who received
an HIV test and knew their results in past 12 months
2014
2015
Female
sex workers
Men who have
sex with men
People who
inject drugs
NA
2014
2015
NA
NA
38.8%
Figure 3:
Percentage of PLHIV with first CD4
count less than <200 cells/uL during
enrollement into care
PLHIV
NA
52.77%
54.1%
37.7%
Estimated
number of
PLHIV
Number
of people
diagnosed
Number
of people
enrolled
in care
Number
of people
on ART
Number of
people who
obtained
viral load
Number of people
who achieved
viral suppression
(<1000 copies/ml)
31%
receiving ART of diagnosed
26%
of PLHIV diagnosed
24%
of PLHIV diagnosed
35%
receiving ART of diagnosed 62 143
104 832 19 849
30 551
39 007
15
P r e v e n t i o n o f m o t h e r- t o - c h i l d t r a n s m i s s i o n
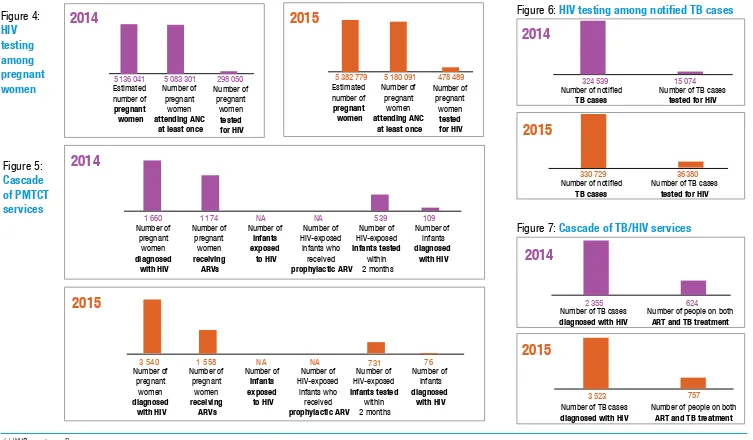
Figure 4:
HIV
testing
among
pregnant
women
Figure 5:
Cascade
of PMTCT
services
T B / H I V c o i n f e c t i o n
Figure 6:
HIV testing among
notified
TB cases
Figure 7:
Cascade of TB/HIV services
Number ofpregnant women
diagnosed with HIV
Number of pregnant
women
receiving ARVs
Number of
infants exposed
to HIV
Number of HIV-exposed
infants who received
prophylactic ARV
Number of HIV-exposed
infants tested
within 2 months
Number of infants
diagnosed with HIV
Estimated number of
pregnant women
Number of pregnant
women
attending ANC at least once
Number of pregnant
women
tested for HIV
Number of notified
TB cases
Number of TB cases
tested for HIV
Number of notified
TB cases
Number of TB cases
tested for HIV
Number of TB cases
diagnosed with HIV
Number of people on both
ART and TB treatment
Number of TB cases
diagnosed with HIV
Number of people on both
ART and TB treatment
2014
2015
2014
2015
2014
2015
2014
2015
Number of pregnant
women
diagnosed with HIV
Number of pregnant
women
receiving ARVs
Number of
infants exposed
to HIV
Number of HIV-exposed
infants who received
prophylactic ARV
Number of HIV-exposed
infants tested
within 2 months
Number of infants
diagnosed with HIV
Estimated number of
pregnant women
Number of pregnant
women
attending ANC at least once
Number of pregnant
women
tested for HIV
330 729
36 380
324 539
15 074
2 355
624
3 523
757
(a) WHO country profile
(b) World Bank,https://datahelpdesk.worldbank.org/knowledgebase/articles/906519,accessed 24 October 2016 (c) United Nations Population Division,World Population Prospects, the 2015 Revision, http://esa.un.org/wpp/ (d) 2016, World population data sheet, http://www.prb.org/pdf16/prb-wpds2016-web-2016.pdf
(e) WHO, UNICEF, UNFPA, World Bank Group, and United Nations Population Division, Maternal Mortality Estimation Inter-Agency Group estimates, 2015
(f) Indonesia Health Profile - Family Health - Maternal Directorate, Ministry of Health
Sources: All data from the databases below unless otherwise stated
- Global AIDS Response Progress Reporting (GARPR) online reporting tool [online database].Geneva:UNAIDS,WHO,UNICEF 2016 - AIDSInfo[website].Geneva: UNAIDS;2016(http://aidsinfo.unaids.org)
- Tuberculosis (TB)[online database].Geneva:WHO;2016 (http://www.who.int/tb/country/data/profiles/en/) - Indonesian Health Profile 2015. Ministry of Health