8
Bangladesh
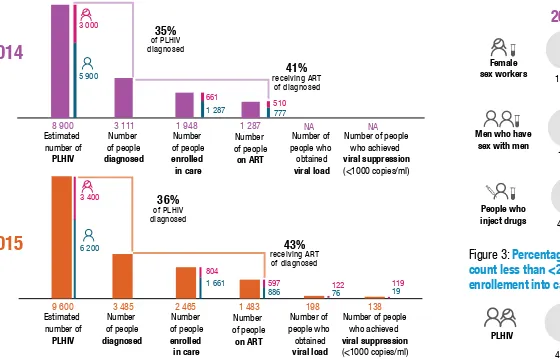
Cascade of HIV testing, care and treatment services, 2014–2015
H I V t e s t i n g, c a r e a n d t r e a t m e n t
Figure 1:
Cascade of diagnosis and treatment for people living with HIV
Country Statistics 2015
Population (million)
(a)Income level
(b)Life expectancy at birth (male/female)
(a)Fertility rate, total (births per woman)
(a)Infant mortality rate per 1000 live births
(c)Maternal deaths per 100,000 births
(d)Proportion of births attended by skilled health personnel
(e)160
Lower-middle-income
69.9/72.3
2.2
31
176
42.1%
Estimated
number of
PLHIV
Number
of people
diagnosed
Number
of people
enrolled
in care
Number
of people
on ART
Number of
people who
obtained
viral load
Number of people
who achieved
viral suppression
(<1000 copies/ml)
8 900
3 111
1 948
1 287
5 900
3 000
1 287 777
661
510
9 600
3 485
2 465
1 483
198
138
804
886
1 661 597
Figure 2:
Percentage of key populations who received
an HIV test and knew their results in past 12 months
2014
2015
Female
sex workers
Men who have
sex with men
People who
inject drugs
17.8%
2014
2015
16%
4.7%
54.4%
Figure 3:
Percentage of PLHIV with first CD4
count less than <200 cells/uL during
enrollement into care
PLHIV
45.8%
47.4%
42%
45.1%
Estimated
number of
PLHIV
Number
of people
diagnosed
Number
of people
enrolled
in care
Number
of people
on ART
Number of
people who
obtained
viral load
Number of people
who achieved
viral suppression
(<1000 copies/ml)
35%
of PLHIV diagnosed
NA
NA
76
122
41%
receiving ART of diagnosed
36%
of PLHIV diagnosed
43%
receiving ART of diagnosed
19
119
6 200
9
P r e v e n t i o n o f m o t h e r- t o - c h i l d t r a n s m i s s i o n
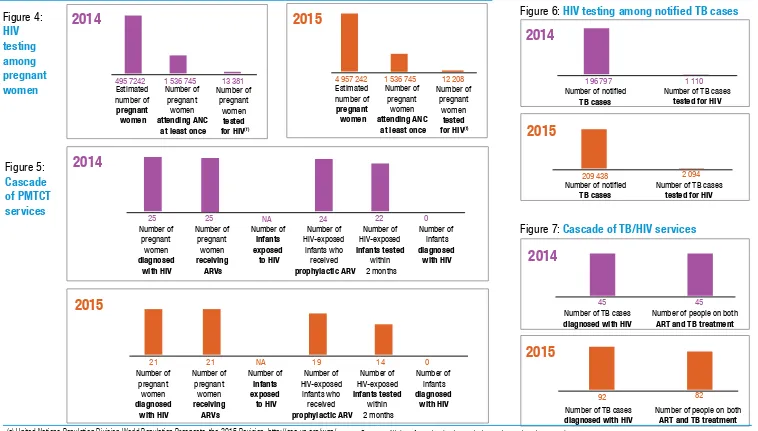
Figure 4:
HIV
testing
among
pregnant
women
Figure 5:
Cascade
of PMTCT
services
T B / H I V c o i n f e c t i o n
Figure 6:
HIV testing among
notified
TB cases
Figure 7:
Cascade of TB/HIV services
Number ofpregnant women
diagnosed with HIV
Number of pregnant
women
receiving ARVs
Number of
infants exposed
to HIV
Number of HIV-exposed
infants who received
prophylactic ARV
Number of HIV-exposed
infants tested
within 2 months
Number of infants
diagnosed with HIV
Estimated number of
pregnant women
Number of pregnant
women
attending ANC at least once
Number of pregnant
women
tested for HIV(f)
Number of notified
TB cases
Number of TB cases
tested for HIV
Number of notified
TB cases
Number of TB cases
tested for HIV
Number of TB cases
diagnosed with HIV
Number of people on both
ART and TB treatment
Number of TB cases
diagnosed with HIV
Number of people on both
ART and TB treatment
2014
2015
2014
2015
2014
2015
2014
2015
Number of pregnant
women
diagnosed with HIV
Number of pregnant
women
receiving ARVs
Number of
infants exposed
to HIV
Number of HIV-exposed
infants who received
prophylactic ARV
Number of HIV-exposed
infants tested
within 2 months
Number of infants
diagnosed with HIV
Estimated number of
pregnant women
Number of pregnant
women
attending ANC at least once
Number of pregnant
women
tested for HIV(f)
196 797
1 110
209 438
2 094
45
45
92
82
495 7242
1 536 745
13 381
4 957 242
1 536 745
12 208
25
25
NA
24
22
0
21
21
NA
19
14
0
(a) United Nations Population Division,World Population Prospects, the 2015 Revision, http://esa.un.org/wpp/ (b) World Bank,https://datahelpdesk.worldbank.org/knowledgebase/articles/906519,accessed 24 October 2016 (c) WHO, UNICEF, UNFPA, World Bank Group, and United Nations Population Division, Maternal Mortality Estimation
Inter-Agency Group estimates, 2015
(d) 2016, World population data sheet, http://www.prb.org/pdf16/prb-wpds2016-web-2016.pdf (e) Millennium Development Goals Indicators. United Nations Statistics Division;2014) http://mdgs.un.org/unsd/mdg/SeriesDetail.aspx?srid=570, accessed 26 October 2016 (f) The data of pregnant women tested for HIV is from 3 hospitals. (Not nationally representative)
Sources: All data from the databases below unless otherwise stated
- Global AIDS Response Progress Reporting (GARPR) online reporting tool [online database].Geneva:UNAIDS,WHO,UNICEF 2016 - AIDSInfo[website].Geneva: UNAIDS;2016(http://aidsinfo.unaids.org)
- Tuberculosis (TB)[online database].Geneva:WHO;2016 (http://www.who.int/tb/country/data/profiles/en/)
- ANC attendance data from DHS Key indicators 2014, Bangladesh.