l Equity Research l Indonesia l Health Care l
10 October 2014
Indonesia hospitals
Siloam’s l
ong-term growth potential is intact
In the recent South East Asia Hospital Development Summit, we spoke to management of six private hospitals in
Greater Jakarta. We also took the opportunity to visit reputed public hospitals and three other private hospitals.
Our key takeaways: (1) there is still pent-up demand for hospital services in Greater Jakarta;
(2) Siloam’s bed tariff
s
appear to be mid-priced despite its premium image; and (3) Siloam is the only Indonesian private hospital player with
the willingness and ability to deliver on an aggressive expansion plan of 6-8 hospitals per year.
High occupancy at mature private hospitals and their bed-tariff premiums over newer hospitals support a strong
long-term growth outlook for Siloam. Bed-tariff differential among hospitals is a fair indicator of price differences for
medical procedures, in our view, given
hospitals’
practice of charging patients based on bed-tiering.
Pent-up demand in Greater Jakarta
At first glance, the hospital market in Jakarta appears mature
with 2.3 beds per 1,000 population, comparable to Singapore
and Thailand
’s
2.0 and 2.2, respectively. Our discussions with
private hospital players indicate that mature hospitals in
Jakarta have an average occupancy of 70-80%. In contrast,
Siloam’s hospitals in Jakarta
averaged just 58% occupancy, as
of 1H14. We see headroom for growth here as
Siloam’s new
hospitals ramp up patient volumes in the next 3-5 years.
Ample scope for bed tariff hikes
Siloam’s bed tariffs are still lower than
tariffs at leading Jakarta
hospitals, despite its premium image. We estimate that
Siloam’s
peers charge a 7-27% premium over Siloam on tariffs
for SVIP, VIP Class I and Class II beds. Our survey reveals
that a heart bypass procedure costs 7-12% less at Siloam than
at the Medistra, Mitra Keluarga and Omni hospitals.
Dominant player in the making
Although there are many new entrants in the private hospitals
market, we believe Siloam is the only player with the ability
and willingness to deliver a rapid expansion of 6-8 hospitals
p.a. We see three key factors distinguishing Siloam from other
players: (1) its asset-light business model, (2) a strong pipeline
of 29 sites at various stages of development, and (3) its
organisational ability to manage/staff these new hospitals.
The bottom line
We maintain our In-Line rating on Siloam; our price target of
IDR 15,100 implies a 5% upside.
While the company’s long
-term outlook is positive, the stock appears fairly valued to us at
current levels. We would wait for a better entry point.
Siloam hospitals’ occupancy in Jakarta
Source: Company
Average bed tariff for SVIP and VIP - 2013
RSPP ~ Rumah Sakit Pusat Pertamina, RSPAD – Rumah Sakit Pusat Angkatan Darat Source: Companies, Asuransi Sinar Mas, Standard Chartered Research
56%
Did you know…
Most Indonesian hospitals have a
differential pricing policy for doctors, medicine and
procedures depending on bed class?
Pent-up demand for hospitals in Jakarta
Seemingly high concentration of beds
We estimate 2.3 beds per 1,000 population in Greater Jakarta, much higher than the
national average of 1.0. This bed ratio in Jakarta is comparable to those for
Singapore and Thailand at 2.2 and 2.0, respectively.
Figure 1: Hospital beds per 1,000 population
Despite high bed per 1,000
population ratio, private hospital
operators in Jakarta have an
average occupancy of 70-80%
Source: Frost & Sullivan, Ministry of Health, Standard Chartered Research
But occupancy indicates pent-up demand
Most hospital managers we met indicate an average occupancy of 70-80% as the
norm for their hospitals. We see this as a confirmation of the strong growth potential
for Siloam’s younger vintage hospitals.
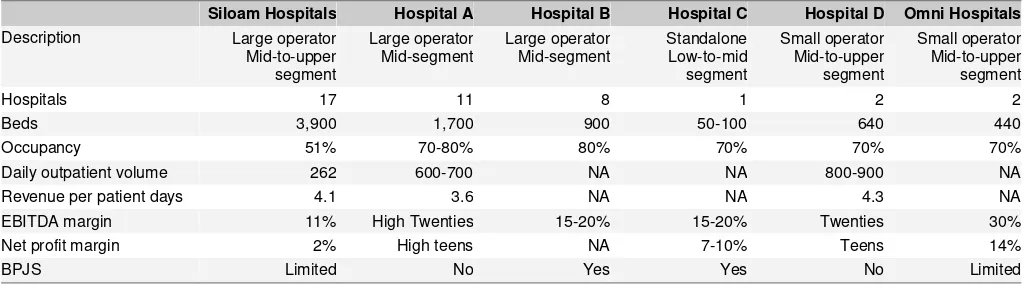
Mature hospitals enjoy double-digit margins
Hospital operators also indicated that their EBITDA margin is at least 15%, with
larger network players and mid-to-upper segment players delivering 20-30%.
Siloam’s
management guided for its new hospitals to achieve an 18-20% EBITDA
margin from year 4. We estimate that
70% of Siloam’s bed capacity is still less
than
four years old in 2014. We think Siloam could potentially deliver similar margins,
comparable to those of mature private hospital operators, in the next 5-10 years.
Figure 2: Key metrics of major private hospitals
Siloam Hospitals
Hospital A
Hospital B
Hospital C
Hospital D Omni Hospitals
Description
Large operator
Note: Private hospital players’ names are not disclosed. Source: Companies, Standard Chartered Research
3.0
China
US
UK
Jakarta Singapore Thailand Malaysia
India
Indonesia
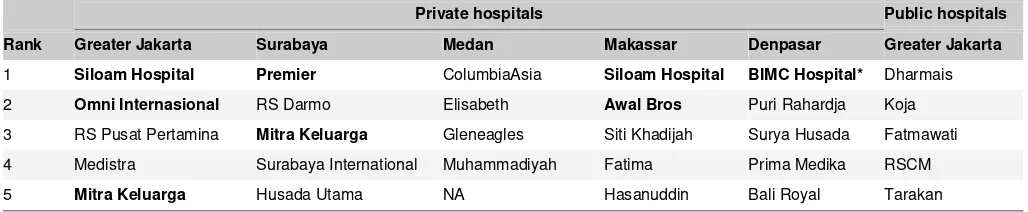
Preferred hospitals in Indonesia
Few leading players
A recent study by
Swa Magazine
, a business publication in Indonesia, named Siloam
as the top hospital brand in Greater Jakarta, Makassar and Surabaya (Siloam
acquired BIMC Hospitals in December 2013). Other network operators that were
named in the survey were Mitra Keluarga, Omni Hospitals (SAME IJ), Awal Bros and
Premier Hospitals.
Figure 3: Top-rated private and public hospitals in Indonesia
Private hospitals
Public hospitals
Rank
Greater Jakarta
Surabaya
Medan
Makassar
Denpasar
Greater Jakarta
1
Siloam Hospital
Premier
ColumbiaAsia
Siloam Hospital
BIMC Hospital*
Dharmais
2
Omni Internasional
RS Darmo
Elisabeth
Awal Bros
Puri Rahardja
Koja
3
RS Pusat Pertamina
Mitra Keluarga
Gleneagles
Siti Khadijah
Surya Husada
Fatmawati
4
Medistra
Surabaya International
Muhammadiyah
Fatima
Prima Medika
RSCM
5
Mitra Keluarga
Husada Utama
NA
Hasanuddin
Bali Royal
Tarakan
Source: Swa Magazine
Potential for strong occupancy ramp-up
We believe Siloam is well positioned to leverage pent-up demand for hospital
services in Greater Jakarta. Siloam’s hospitals in Jakarta had an average occupancy
of 51% in 2013. We believe the 70-80% occupancy at more mature private hospitals
in Jakarta indicates the potential for a strong ramp-
up at Siloam’s new hospitals in
the next five years.
Room for margin expansion
Premium image with mass pricing for Siloam
Despite its
‘premium’ image, our price survey indicates Siloam’s bed and
medical
procedure tariffs are either below or in line with those at leading hospitals in Greater
Jakarta. We surveyed the prices in five hospitals and used the room tariff data
tracked by the website Asuransi Sinar Mas.
Room tariff as a proxy to procedure costs
We view room tariffs as a proxy to procedure prices across hospitals, based on the
practice of Indonesian hospitals in applying differential pricing for procedures,
medical supplies, and nurs
es’
and doctors’ fees based on the patient’s ward
-class
choice
(also known as ‘bed
-
tiering’)
. Hospital CEOs we met at the conference
confirmed that differential pricing is standard practice across both public and private
hospitals in Indonesia.
Siloam’s b
ed tariffs are in the lower range
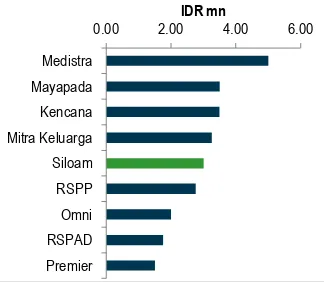
Siloam charges lower prices than most leading hospitals
Our study indicates that
Siloam’s bed tariffs across six different room types are still
in
the lower range of prices at nine leading hospitals in Greater Jakarta.
Siloam’s top
suite ranked fifth, at IDR 3mn per night, while its SVIP/VIP /Class I, II and III beds
ranked fourth or lower. We believe this indicates that there is room for further tariff
hikes given
Siloam’s
premium image.
Figure 6: Top suite tariff
Figure 7: SVIP tariff
Figure 8: VIP tariff
Source: Companies, Standard Chartered Research Source: Companies, Standard Chartered Research Source: Companies, Standard Chartered Research
Figure 9: Class I tariff
Figure 10: Class II tariff
Figure 11: Class III tariff
Source: Companies, Standard Chartered Research Source: Companies, Standard Chartered Research Source: Companies, Standard Chartered Research
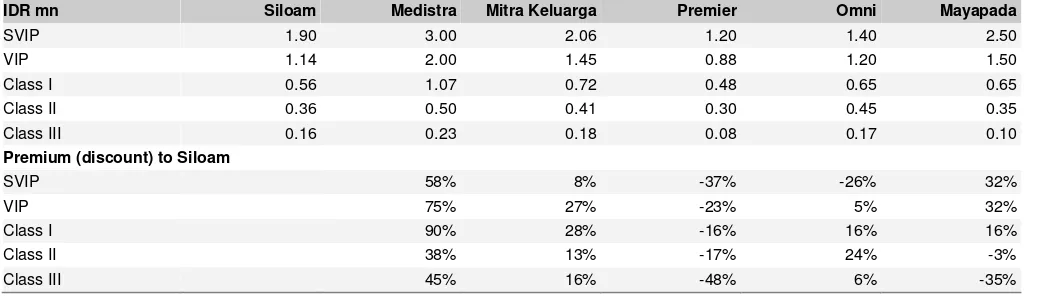
Competitively priced versus other private hospitals
We see Siloam largely as a mid-to-upper segment player with positioning similar to
that of Medistra, Premier, Mitra Keluarga Kelapa Gading (MKKG), Omni and
Mayapada hospitals.
Our analysis shows Siloam’s peers are charging, on average, 7
-27% more for SVIP, VIP Class I and Class II beds.
Cheaper than most mid-to-upper players:
Our study indicates
Medistra’s bed
tariffs are 38-90
% more expensive than Siloam’s bed tariffs. Similarly,
Mitra
Keluarga Kelapa Gading also charges an 8-28% premium over
Siloam’s tariffs
across the five bed classes. We note that MKKG is probably one of the few
hospitals in the Mitra Keluarga network that targets mid-to-upper segment
clientele, given its location in the affluent Kelapa Gading district. Omni and
Maypada largely charge a 5-32% premium over Siloam.
Charging a premium versus Premier:
Siloam is priced at a premium only to
Premier Hospital (affiliated to Ramsay Healthcare) whose rooms are at a 17-48%
discount to Siloam
’s
.
Mixed record for class III beds:
For class III beds, Medistra, MKKG and Omni
still charge a 6-48% premium to Siloam
’s
, while Premier and Mayapada priced a
35-48% discount to Siloam
’s
. However, class III beds make up the smallest
proportion of private hospitals’ bed capacity at 10
-15%.
Figure 12: Hospital bed tariff comparison for leading private hospitals
IDR mn
Siloam
Medistra
Mitra Keluarga
Premier
Omni
Mayapada
SVIP
1.90
3.00
2.06
1.20
1.40
2.50
Source: Companies, Standard Chartered Research
Figure 13: Medistra and Mitra Keluarga
–
Above Siloam
Figure 14: Premier, Mayapada and Omni
–
Mixed record
Source: Companies, Standard Chartered Research Source: Companies, Standard Chartered Research
58%
Siloam’s p
rocedure prices lower than competitors
’
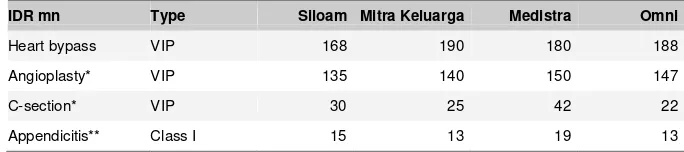
Cheaper on more complex surgeries
We believe Siloam prices more complex procedures at lower rates than its peers.
Siloam’s heart
bypass surgery is 7-12% cheaper than that at Mitra Keluarga,
Medistra and Omni hospitals. Its angioplasty procedure is also 4-10% cheaper than
at its peers.
Still competitive on simpler procedures
In simpler procedures like C-sections and appendectomies
, Siloam’s pricing remains
24-29% below Medistra
’s
, which seems to be the most premium-priced player in the
market. We believe Siloam’s image
as a premium player could be due to its higher
pricing for high-volume procedures.
Figure 15: Comparison of procedure prices
Siloam’s
heart bypass procedure is
7-12% cheaper than its private
hospital peers
Source: Companies, Detik Health, Standard Chartered Research estimates
Figure 16: Procedure cost for C-section
Figure 17: Procedure cost for appendectomy
Source: Companies, Detik Health Source: Companies, Detik Health
Procedure price hikes could boost
Siloam’s
margins
We see three drivers of
Siloam’s lower margins: (1) its relatively lower pricing
; (2)
Siloam’s gross profit and EBIT margins
of 26% and 3%, respectively, in 2013 are still
the lowest among ASEAN hospital players.
Omni Hospital’s (SAME IJ) gross profit
margin of 49% and EBIT margin of 22% indicate
Siloam’s long
-term margin potential,
once the younger
‘
vintage
’
(under 4 years old) hospitals in its portfolio mature. Both
of Omni’s
hospitals are mature, with over 10 years
’
operating history.
Figure 18: Gross profit margin, 2013
Figure 19: EBIT margin, 2013
Source: Companies, Standard Chartered Research Source: Companies, Standard Chartered Research
Higher doctor fee-sharing policy
Siloam’s total expense
s-to-sales ratio was high at 97% in 2013, compared with 78%
for Omni. While start-up losses at its younger vintage hospitals are the primary
reason behind this,
we believe Siloam’s aggressive fee
-sharing arrangement for
doctors at 90-97% also plays a part. Most private hospitals we surveyed during the
conference indicated an 80-85% fee-
sharing arrangement. We see Siloam’s
aggressive offer as part of its bid to attract sufficient quality specialists for its
hospitals. We expect this to taper over time, closer to the market average of 85%.
Figure 20: Total expense to sales ratio, 2013
Figure 21: Total expenses breakdown, 2013
Source: Companies Source: Companies
We expect faster
‘
revenue intensity
’
growth in the long term
We believe Siloam could still increase its tariffs in the longer term, especially as its
hospitals mature. Management is guiding for a revenue intensity
(we define ‘intensity’
as revenue per patient) growth of 5-6% for its younger vintage hospitals and up to 8%
for its mature hospitals in the next 3-5 years. We believe this is conservative
compared with revenue intensity growth of 14% for KPJ Healthcare and 18% for
Bangkok Dusit Medical Services (Figure 22).
49%
Figure 22: Revenue intensity growth
Source: Companies, Standard Chartered Research
18%
14%
7%
6%
6%
0%
2%
4%
6%
8%
10%
12%
14%
16%
18%
20%
Bangkok Dusit
KPJ Healthcare
Bumrungrad
Hospital
Siloam Hospitals
Parkway Holding
Siloam
–
A dominant player in the making
Based on our conversations with major hospital operators during the conference, find
Siloam to be the only operator among the Indonesian private hospitals with the
willingness and ability to expand rapidly in the market today. We gauge willingness
based on the different players’ expansion
plans over the next few years, and ability
to
expand based on their capacity to fund and staff these new hospitals.
Most aggressive player in the market
During the conference, we noted that most hospital operators are not pursuing the
same scale of growth like Siloam. Siloam is planning to open 6-8 hospitals p.a. in
2015-17. In contrast, other network operators such as Mitra Keluarga, Awal Bros,
Ciputra Hospital and Eka Hospital are only aiming up to two hospitals p.a, according
to management. While Mitra Keluarga and Awal Bros both have sizeable operations
of 11 and eight hospitals, respectively, neither has expressed any plans to match
Siloam’s expansion
scale.
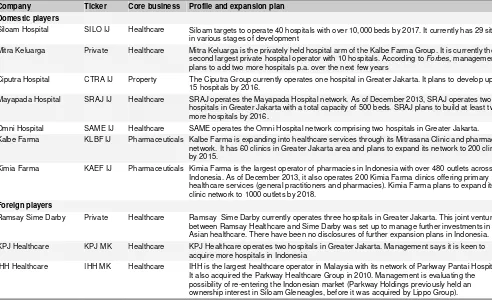
Figure 23: Expansion plans by major private hospital players
Company Ticker Core business Profile and expansion plan Domestic players
Siloam Hospital SILO IJ Healthcare Siloam targets to operate 40 hospitals with over 10,000 beds by 2017. It currently has 29 sites
in various stages of development
Mitra Keluarga Private Healthcare Mitra Keluarga is the privately held hospital arm of the Kalbe Farma Group. It is currently the
second largest private hospital operator with 10 hospitals. According to Forbes, management
plans to add two more hospitals p.a. over the next few years
Ciputra Hospital CTRA IJ Property The Ciputra Group currently operates one hospital in Greater Jakarta. It plans to develop up to
15 hospitals by 2016.
Mayapada Hospital SRAJ IJ Healthcare SRAJ operates the Mayapada Hospital network. As of December 2013, SRAJ operates two
hospitals in Greater Jakarta with a total capacity of 500 beds. SRAJ plans to build at least two more hospitals by 2016.
Omni Hospital SAME IJ Healthcare SAME operates the Omni Hospital network comprising two hospitals in Greater Jakarta.
Kalbe Farma KLBF IJ Pharmaceuticals Kalbe Farma is expanding into healthcare services through its Mitrasana Clinic and pharmacy
network. It has 60 clinics in Greater Jakarta area and plans to expand its network to 200 clinics by 2015.
Kimia Farma KAEF IJ Pharmaceuticals Kimia Farma is the largest operator of pharmacies in Indonesia with over 480 outlets across
Indonesia. As of December 2013, it also operates 200 Kimia Farma clinics offering primary healthcare services (general practitioners and pharmacies). Kimia Farma plans to expand its clinic network to 1000 outlets by 2018.
Foreign players
Ramsay Sime Darby Private Healthcare Ramsay Sime Darby currently operates three hospitals in Greater Jakarta. This joint venture
between Ramsay Healthcare and Sime Darby was set up to manage further investments in Asian healthcare. There have been no disclosures of further expansion plans in Indonesia.
KPJ Healthcare KPJ MK Healthcare KPJ Healthcare operates two hospitals in Greater Jakarta. Management says it is keen to
acquire more hospitals in Indonesia
IHH Healthcare IHH MK Healthcare IHH is the largest healthcare operator in Malaysia with its network of Parkway Pantai Hospitals.
It also acquired the Parkway Healthcare Group in 2010. Management is evaluating the possibility of re-entering the Indonesian market (Parkway Holdings previously held an ownership interest in Siloam Gleneagles, before it was acquired by Lippo Group).
Source: Companies, multiple news sources, Standard Chartered Research
An asset-light business model
Favourable asset-light model:
While some investors find this to be an
unorthodox business model for Asia hospitals, we believe Siloam’s asset
-light
Largely long-term turnover leases:
We find comfort in
Siloam’s
long-term lease
agreements between Siloam and its hospital land and building owners. These
lease agreements are locked for 15 years and operate largely on a turnover-rent
basis at a 1-3% progressive rate from year 1/year 2/year 3 onwards.
Figure 24: Siloam
’s
lease agreements
Hospital Owner
SH Lippo Cikarang First REIT 2025 (12 years) 12+15 Aggregate of a base rent and a variable rent determined by
hospital GOR
SH Sriwijaya Metropolis Propertindo Utama 2022 (9 years) 10+18 IDR 3bn for the first three years, IDR 3.5bn for 4th to 6th years and
IDR 4bn for 7th to 10th years
SH Cinere Anadi Sarana Tatahusada 2018 (5 years) 13+5 IDR 6.5bn p.a
SH Bali* First REIT 2028 (15 years) 15+15 1% of annual GOR in year 1, 2% in year 2 and 3% thereafter
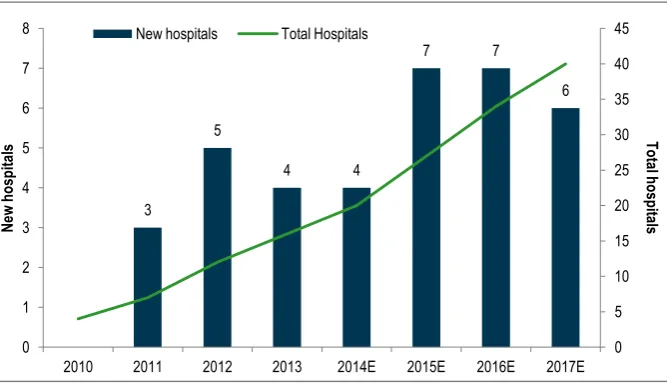
Siloam has a strong pipeline through 2017
Siloam management said it would complete four hospitals in 2014 versus its initial
target to complete 4-5 hospitals. Its Purwakarta hospital was opened in June, and it
plans to open two greenfield hospitals in Medan and Kupang in 4Q14. We believe the
company will potentially acquire one hospital in 2014. It has 29 sites in various stages
of development.
Figure 25:
Siloam’s pipeline
through 2017
Siloam is on track to expand its
network to 40 hospitals in 2017
from 17 hospitals currently. It has
29 sites in various stages of
development
Source: Company, Standard Chartered Research estimates
3
Is there a capital raising risk?
We note that Siloam will continue to report a negative FCF of IDR 408-626bn, as it
remains in an aggressive expansion mode until 2017. Assuming a 4-5 year ramp-up
per new hospital, we expect Siloam to begin delivering a positive FCF from 2018, as
more than half of its bed capacity is mature (year 4 and year 5) and achieves an
EBITDA margin of 17-18%.
Management indicated that capex could be funded by the following means: (1) a
shareholder loan from its parent, Lippo Karawaci; (2) divestment of existing
company-owned hospitals to First REIT; and (3) equity raising. Management
confirmed that there are still no plans for further equity raising from the market to
support its expansion plans.
Figure 26: Leverage and cash flow outlook
We believe net gearing could peak
in 2017, when the rapid expansion
phase is completed
Source: Company, Standard Chartered Research estimates
-60%
-40%
-20%
0%
20%
40%
60%
80%
100%
-1000
-500
0
500
1000
1500
2000
2500
2010
2011
2012
2013
2014E
2015E
2016E
2017E
2018E
N
et
g
ea
rin
g
ID
R
b
n
Maintain our In-Line rating on Siloam
While we continue to like Siloam’s long
-term outlook, we believe the stock is fairly
valued at current levels. Our DCF-based price target offers only a 5% potential
upside and implies 23x EV/EBITDA on 2015E. The stock trades at a 28% premium to
regional peers due to its market leadership and strong earnings growth outlook. We
would wait for a better entry point into Siloam.
Key potential downside risks could be: (1) slippage in delivering 6-8 hospitals p.a.;
and (2) slower-than-expected ramp-up at its younger vintage hospitals. We think
Siloam should be a core portfolio holding for Indonesia healthcare exposure, but we
recognise that its short listing history could be an issue for investors.
Figure 27: Asia hospitals
–
Peer comparison
Share prices as of 9 October 2014; Bloomberg consensus estimates for NR stocks Source: Bloomberg, Standard Chartered Research estimates
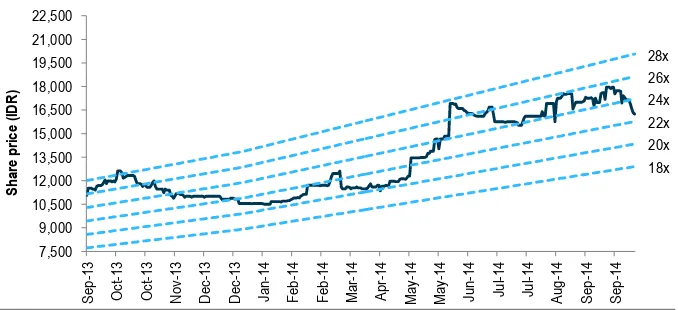
Strong valuation gain YTD
Siloam’s share price
has risen 52% YTD, making it one of the top performers within
our healthcare coverage universe (with Bumrungrad Hospital and Bangkok Dusit
Medical). The stock re-rated strongly in May after its inclusion in the Indonesia MSCI
Index.
Figure 28: Forward 12-month EV/EBITDA
Source: Bloomberg, Standard Chartered Research estimates
Positive longer-term outlook intact
While on a 12-month basis Siloam offers only a limited 6% potential upside, we
reiterate our positive view on its long-term potential. Over three years, we believe
Siloam could offer an average return of 13% p.a. assuming it trades at 15x
EV/EBITDA in 2017E. Meanwhile, over five years, we believe Siloam could deliver an
average return of 17% p.a., assuming it trades at 12x EV/EBITDA in 2019E. We
believe the next stage of re-rating could take place when Siloam proves its track
record in executing its plan to expand its hospital network to 40 hospitals in 2017
from 17 hospitals currently.
Figure 29: Siloam
–
3-year potential returns
Figure 30: Siloam
–
5-year potential returns
IDR bn
Enterprise value
24,534
Net debt
(1,378)
Minorities
(105)
Equity value
23,051
Outstanding shares
1.2
2017E fair value
19,938
2017E EV / EBITDA
15
Current share price
14,300
Share price return
39%
Share price return p.a.
12%
Cumulative dividend return p.a.
0%
Total return p.a.
12%
IDR bn
Enterprise value
36,597
Net debt
(1,378)
Minorities
(105)
Equity value
35,114
Outstanding shares (bn)
1.2
2019E fair value (IDR)
30,373
2019E EV / EBITDA
12
Current share price (IDR)
14,300
Share price return
112%
Share price return p.a.
16%
Cumulative dividend return p.a.
1%
Total return p.a.
17%
Siloam Hospitals Internasional
Income statement (IDR bn) Cash flow statement (IDR bn)
Year-end: Dec 2012 2013 2014E 2015E 2016E Year-end: Dec 2012 2013 2014E 2015E 2016E
Sales 1,788 2,504 3,421 4,995 7,273 EBIT 91 79 184 325 558
Gross profit 445 659 924 1,374 2,037 Depreciation & amortisation 120 202 288 429 582
SG&A (368) (583) (740) (1,049) (1,478) Net interest (14) (7) (27) (77) (141)
Other income 15 3 9 12 18 Tax paid (33) (27) (41) (64) (109)
Other expenses 0 0 0 0 0 Changes in working capital (45) (67) (88) (115) (167)
EBIT 91 79 184 325 558 Others 84 10 (10) (15) (22)
Net interest (5) (0) (27) (77) (141) Cash flow from operations 203 189 307 483 701
Associates 0 0 0 0 0
Other non-operational (9) (7) (10) (15) (22) Capex (523) (598) (716) (1,109) (1,221)
Exceptional items 0 0 0 0 0 Acquisitions & Investments (53) (163) 0 0 0
Pre-tax profit 77 72 147 233 395 Disposals 0 1 0 0 0
Taxation (25) (22) (41) (64) (109) Others 61 0 0 0 0
Minority interests (1) (0) (3) (5) (8) Cash flow from investing (515) (761) (716) (1,109) (1,221)
Exceptional items after tax 0 0 0 0 0
Net profit 50 50 104 164 278 Dividends 0 0 (10) (25) (56)
Issue of shares 0 0 0 0 0
Net profit adj. 50 50 104 164 278 Change in debt 320 (423) 500 500 500
EBITDA 212 281 473 754 1,140 Other financing cash flow 0 1,326 (200) (100) (50)
Cash flow from financing 320 904 290 375 394
EPS (IDR) 50 48 90 142 241
EPS adj. (IDR) 50 48 90 142 241 Change in cash 9 333 (119) (250) (125)
DPS (IDR) 0 5 9 21 48 Exchange rate effect 0 0 0 0 0
Avg fully diluted shares (mn) 1,000 1,047 1,156 1,156 1,156 Free cash flow (320) (409) (408) (626) (520)
Balance sheet (IDR bn) Financial ratios and other
Year-end: Dec 2012 2013 2014E 2015E 2016E Year-end: Dec 2012 2013 2014E 2015E 2016E
Cash 169 515 397 146 21 Operating ratios
Short-term investments 0 0 0 0 0 Gross margin (%) 24.9 26.3 27.0 27.5 28.0
Accounts receivable 187 271 375 547 797 EBITDA margin (%) 11.8 11.2 13.8 15.1 15.7
Inventory 75 95 137 198 287 EBIT margin (%) 5.1 3.1 5.4 6.5 7.7
Other current assets 26 26 50 72 103 Net margin adj. (%) 2.8 2.0 3.0 3.3 3.8
Total current assets 457 907 958 964 1,208 Effective tax rate (%) 32.5 30.1 27.5 27.5 27.5
Sales growth (%) 42.0 40.0 36.6 46.0 45.6 PP&E 865 1,402 1,834 2,518 3,161 Net income growth (%) 15.4 -1.2 107.7 58.1 70.0
Intangible assets 61 188 184 179 175 EPS growth (%) 15.4 -5.6 88.2 58.1 70.0
Associates and JVs 0 0 0 0 0 EPS growth adj. (%) 15.4 -5.6 88.2 58.1 70.0
Other long-term assets 203 103 103 103 103 DPS growth (%) - nm 88.2 137.1 126.7
Total long-term assets 1,129 1,693 2,120 2,800 3,439
Efficiency ratios
Total assets 1,586 2,601 3,079 3,763 4,647 ROE (%) 23.8 5.3 6.1 9.1 14.0
ROCE (%) 8.2 4.3 7.4 10.9 15.6
Short-term debt 16 17 17 17 17 Asset turnover (x) 1.3 1.2 1.2 1.5 1.7
Accounts payable 156 164 222 322 465 Op. cash/EBIT (x) 2.2 2.4 1.7 1.5 1.3
Other current liabilities 96 115 139 180 238 Depreciation/capex (x) 0.2 0.3 0.4 0.4 0.5
Total current liabilities 268 296 378 518 720 Inventory days 16.2 16.8 16.9 16.9 16.9
Accounts receivable days 31.8 33.4 34.4 33.7 33.7 Long-term debt 55 43 543 1,043 1,543 Accounts payable days 36.6 31.6 28.2 27.4 27.4
Convertible bonds 0 0 0 0 0
Deferred tax 0 0 0 0 0 Leverage ratios
Other long-term liabilities 1,019 623 423 323 273 Net gearing (%) -40.0 -27.8 9.4 48.6 72.9
Total long-term liabilities 1,074 666 966 1,366 1,816 Debt/capital (%) 5.4 2.6 20.7 32.7 39.7
Interest cover (x) 10.7 6.5 4.8 3.5 3.7
Total liabilities 1,342 962 1,343 1,884 2,536 Debt/EBITDA (x) 0.4 0.2 0.7 1.1 1.1
Current ratio (x) 1.7 3.1 2.5 1.9 1.7
Shareholders’ funds 245 1,639 1,735 1,879 2,110
Minority interests 0 0 0 0 0 Valuation
EV/sales (x) - 4.1 4.9 3.5 2.5
Total equity 245 1,639 1,735 1,879 2,110 EV/EBITDA (x) - 36.1 35.5 23.2 15.9
EV/EBIT (x) - 129.0 91.1 54.0 32.5
Total liabilities and equity 1,586 2,601 3,079 3,763 4,647 PER (x) - 209.2 160.4 101.5 59.7
PER adj. (x) - 209.2 160.4 101.5 59.7
Net debt (cash) (98) (456) 163 913 1,539 PBR (x) - 6.1 9.6 8.8 7.9
Disclosures appendix
The information and opinions in this report were prepared by Standard Chartered Bank (Hong Kong) Limited, Standard Chartered Bank Singapore Branch, Standard Chartered Securities (India) Limited, Standard Chartered Securities Korea Limited and/or one or more of its affiliates (together with its group of companies, ”SCB”) and the research analyst(s) named in this report. THIS RESEARCH HAS NOT BEEN PRODUCED IN THE UNITED STATES.
Analyst Certification Disclosure: The research analyst or analysts responsible for the content of this research report certify that: (1) the views expressed and attributed to the research analyst or analysts in the research report accurately reflect their personal opinion(s) about the subject securities and issuers and/or other subject matter as appropriate; and (2) no part of his or her compensation was, is or will be directly or indirectly related to the specific recommendations or views contained in this research report. On a general basis, the efficacy of recommendations is a factor in the performance appraisals of analysts.
Where “disclosure date” appears below, this means the day prior to the report date. All share prices quoted are the closing price for the business day prior to the date of the report, unless otherwise stated.
9,400
10,700
12,000
13,300
14,600
15,900
Oct-13
Jan-14
Apr-14
Jul-14
Oct-14
IDR
Recommendation and price target history for Siloam Hospital Internasional
1 2 3
Date Recommendation Price target Date Recommendation Price target Date Recommendation Price target
1 8 Apr 14 OUTPERFORM 13,982 2 25 Jun 14 IN-LINE 15,137 3 31 Jul 14 IN-LINE 15,100 Source: FactSet prices, SCB recommendations and price targets
2,325
2,810
3,295
3,780
4,265
4,750
Nov-11
Feb-12
May-12
Aug-12
Nov-12
Feb-13
May-13
Aug-13
Nov-13
Feb-14
May-14
Aug-14
Nov-14
IDR
Recommendation and price target history for Tempo Scan Pacific
1
Date Recommendation Price target Date Recommendation Price target Date Recommendation Price target
1 8 Apr 14 OUTPERFORM 3,878 Source: FactSet prices, SCB recommendations and price targets
Recommendation Distribution and Investment Banking Relationships
% of covered companies currently assigned this rating
% of companies assigned this rating with which SCB has provided investment banking services over the past 12 months
OUTPERFORM 55.6% 10.8%
IN-LINE 33.6% 9.4%
UNDERPERFORM 10.8% 9.7%
As of 30 September 2014
Research Recommendation
Terminology Definitions
OUTPERFORM (OP) The total return on the security is expected to outperform the relevant market index by 5% or more over the next 12 months IN-LINE (IL) The total return on the security is not expected to outperform or underperform the relevant market index by 5% or more over the next
12 months
UNDERPERFORM (UP) The total return on the security is expected to underperform the relevant market index by 5% or more over the next 12 months SCB uses an investment horizon of 12 months for its price targets.
Additional information, including disclosures, with respect to any securities referred to herein will be available upon request. Requests should be sent to [email protected].
any particular person. Any investments discussed may not be suitable for all investors. Users of this document should seek professional advice regarding the appropriateness of investing in any securities, financial instruments or investment strategies referred to in this document and should understand that statements regarding future prospects may not be realised. Opinions, forecasts, assumptions, estimates, derived valuations, projections, and price target(s), if any, contained in this document are as of the date indicated and are subject to change at any time without prior notice. Our recommendations are under constant review. The value and income of any of the securities or financial instruments mentioned in this document can fall as well as rise and an investor may get back less than invested. Future returns are not guaranteed, and a loss of original capital may be incurred. Foreign-currency denominated securities and financial instruments are subject to fluctuation in exchange rates that could have a positive or adverse effect on the value, price or income of such securities and financial instruments. Past performance is not indicative of comparable future results and no representation or warranty is made regarding future performance. While we endeavour to update on a reasonable basis the information and opinions contained herein, there may be regulatory, compliance or other reasons that prevent us from doing so. Accordingly, information may be available to us which is not reflected in this material, and we may have acted upon or used the information prior to or immediately following its publication. SCB is not a legal or tax adviser, and is not purporting to provide legal or tax advice. Independent legal and/or tax advice should be sought for any queries relating to the legal or tax implications of any investment. SCB and/or its affiliates may have a position in any of the securities, instruments or currencies mentioned in this document. SCB and/or its affiliates or its respective officers, directors, employee benefit programmes or employees, including persons involved in the preparation or issuance of this document may at any time, to the extent permitted by applicable law and/or regulation, be long or short any securities or financial instruments referred to in this document and on the SCB Research website or have a material interest in any such securities or related investments, or may be the only market maker in relation to such investments, or provide, or have provided advice, investment banking or other services, to issuers of such investments. SCB has in place policies and procedures and physical information walls between its Research Department and differing public and private business
functions to help ensure confidential information, including ‘inside’ information is not disclosed unless in line with its policies and procedures and the rules of its regulators. Data, opinions and other information appearing herein may have been obtained from public sources. SCB makes no representation or warranty as to the accuracy or completeness of such information obtained from public sources. SCB also makes no representation or warranty as to the accuracy nor responsible for
any information or data contains on any third party’s website. You are advised to make your own independent judgment (with the advice of your professional advisers as necessary) with respect to any matter contained herein and not rely on this document as the basis for making any trading, hedging or investment decision. SCB accepts no liability and will not be liable for any loss or damage arising directly or indirectly (including special, incidental, consequential, punitive or exemplary damages) from the use of this document, howsoever arising, and including any loss, damage or expense arising from, but not limited to, any defect, error, imperfection, fault, mistake or inaccuracy with this document, its contents or associated services, or due to any unavailability of the document or any part thereof or any contents or associated services. This material is for the use of intended recipients only and in any jurisdiction in which distribution to private/retail customers would require registration or licensing of the distributor which the distributor does not currently have, this document is intended solely for distribution to professional and institutional investors.
Country-Specific Disclosures - If you are receiving this document in any of the countries listed below, please note the following:
United Kingdom and European Economic Area: SCB is authorised in the United Kingdom by the Prudential Regulation Authority and regulated by the Financial Conduct Authority and the Prudential Regulation Authority. This communication is not directed at Retail Clients in the European Economic Area as defined by Directive 2004/39/EC. Nothing in this document constitutes a personal recommendation or investment advice as defined by Directive 2004/39/EC. Australia: The Australian Financial Services Licence for Standard Chartered Bank is Licence No: 246833 with the following Australian Registered Business Number (ARBN: 097571778). Australian investors should note that this communication was prepared for “wholesale clients” only and is not directed at persons who are “retail clients”
as those terms are defined in sections 761G and 761GA of the Corporations Act 2001 (Cth). Bangladesh: This research has not been produced in Bangladesh. The report has been prepared by the research analyst(s) in an autonomous and independent way, including in relation to SCB. THE SECURITIES MENTIONED IN THIS REPORT HAVE NOT BEEN AND WILL NOT BE REGISTERED IN BANGLADESH AND MAY NOT BE OFFERED OR SOLD IN BANGLADESH WITHOUT PRIOR APPROVAL OF THE REGULATORY AUTHORITIES IN BANGLADESH. Botswana: This document is being distributed in Botswana by, and is attributable to, Standard Chartered Bank Botswana Limited which is a financial institution licensed under the Section 6 of the Banking Act CAP 46.04 and is listed in the Botswana Stock Exchange. Brazil:SCB disclosures pursuant to the Securities and Exchange Commission of Brazil (“CVM”) Instruction 483/10: This research has not been produced in Brazil. The report has been prepared by the research analyst(s) in an autonomous and independent way, including in relation to SCB. THE SECURITIES MENTIONED IN THIS DOCUMENT HAVE NOT BEEN AND WILL NOT BE REGISTERED PURSUANT TO THE REQUIREMENTS OF THE SECURITIES AND EXCHANGE COMMISSION OF BRAZIL AND MAY NOT BE OFFERED OR SOLD IN BRAZIL EXCEPT PURSUANT TO AN APPLICABLE EXEMPTION FROM THE REGISTRATION REQUIREMENTS AND IN COMPLIANCE WITH THE SECURITIES LAWS OF BRAZIL. Germany: In Germany, this document is being distributed by Standard Chartered Bank Germany Branch which is also regulated by the Bundesanstalt für Finanzdienstleistungsaufsicht (BaFin).
Hong Kong: This document, except for any portion advising on or facilitating any decision on futures contracts trading, is being distributed in Hong Kong by, and is attributable to, Standard Chartered Bank (Hong Kong) Limited 渣打銀行 香港 有限公司 which is regulated by the Hong Kong Monetary Authority. India: This document is being distributed in India by Standard Chartered Securities (India) Limited, which is a SEBI-registered broker and a member of the Bombay Stock Exchange Limited and The National Stock Exchange of India Limited. Registered Address: 2nd Floor, 23-25 M. G. Road, Fort, Mumbai - 400 001. India | Telephone No: 022 - 6135 5999 | Fax No: 022 - 6135 5900| http://www.standardcharteredtrade.co.in | Email: [email protected]. | CIN: U65990MH1994PLC079263.
Indonesia: The information in this document is provided for information purposes only. It does not constitute any offer, recommendation or solicitation to any person to enter into any transaction or adopt any hedging, trading or investment strategy, nor does it constitute any prediction of likely future movements in rates or prices or represent that any such future movements will not exceed those shown in any illustration. Kenya: Standard Chartered Bank Kenya Limited is regulated by the Central Bank of Kenya. This document is intended for use only by Professional Clients and should not be relied upon by or be distributed to Retail Clients. Korea: