Postsecondary Employment Experiences Among Young Adults
With an Autism Spectrum Disorder RH: Employment in Young
Adults With Autism
Anne M. Roux, M.P.H., Paul T. Shattuck, M.S.S.W., Ph.D., Benjamin P. Cooper, M.P.H., Kristy A. Anderson, M.S.W., Mary Wagner, Ph.D., and Sarah C. Narendorf, Ph.D.
Ms. Roux, Dr. Shattuck, and Mr. Cooper are with the George Warren Brown School of Social Work at Washington University in St. Louis. Ms. Anderson is with the Waisman Center at the University of Wisconsin–Madison. Dr. Wagner is with SRI International. Dr. Narendorf is with the Graduate College of Social Work at the University of Houston.
Abstract
Objective—We examined postsecondary employment experiences of young adults with an autism spectrum disorder (ASD) and compared these outcomes with those of young adults with different disabilities.
Method—Data were from Wave 5 of the National Longitudinal Transition Study 2 (NLTS2), a nationally representative survey of young adults who had received special education services during high school. We examined the prevalence of ever having had—and currently having—a paid job at 21–25 years of age. We analyzed rates of full employment, wages earned, number of jobs held since high school, and job types.
Results—About half (53.4%) of young adults with an ASD had ever worked for pay outside the home since leaving high school, the lowest rate among disability groups. Young adults with an ASD earned an average of $8.10 per hour, significantly lower than average wages for young adults in the comparison groups, and held jobs that clustered within fewer occupational types. Odds of ever having had a paid job were higher for those who were older, from higher-income households, and with better conversational abilities or functional skills.
Conclusions—Findings of worse employment outcomes for young adults with an ASD suggest this population is experiencing particular difficulty in successfully transitioning into employment. Research is needed to determine strategies for improving outcomes as these young adults
transition into adulthood.
© 2013 American Academy of Child & Adolescent Psychiatry. Published by Elsevier Inc. All rights reserved.
Correspondence to Anne M. Roux, M.P.H., Washington University in St. Louis, One Brookings Dr., Campus Box 1196, St. Louis, MO 63130; [email protected].
Publisher's Disclaimer: This is a PDF file of an unedited manuscript that has been accepted for publication. As a service to our customers we are providing this early version of the manuscript. The manuscript will undergo copyediting, typesetting, and review of the resulting proof before it is published in its final citable form. Please note that during the production process errors may be discovered which could affect the content, and all legal disclaimers that apply to the journal pertain.
This article is discussed in an editorial by Dr. Patricia Howlin on page xxx. Clinical guidance is available at the end of this article.
Mr. Cooper and Drs. Shattuck and Wagner served as the statistical experts for this research.
NIH Public Access
Author Manuscript
J Am Acad Child Adolesc Psychiatry
. Author manuscript; available in PMC 2014 September 01.Published in final edited form as:
J Am Acad Child Adolesc Psychiatry. 2013 September ; 52(9): 931–939. doi:10.1016/j.jaac.2013.05.019.
NIH-PA Author Manuscript
NIH-PA Author Manuscript
Keywords
adolescent; autism; employment; outcomes; young adult
INTRODUCTION
A growing population of adolescents diagnosed with an autism spectrum disorder (ASD) is aging toward adulthood. An estimated 50,000 youth with an ASD turn 18 years old each
year in the United States.1 However, research about the adult stage of life for those with an
ASD remains extremely underdeveloped relative to research on young children with an
ASD.2,3 The 2011 Strategic Plan for Autism Spectrum Disorder Research of the Interagency
Autism Coordinating Committee emphasized the critical need for longitudinal studies of
adult outcomes, such as employment, as a basis for policy recommendations.4
Parents of youth with an ASD need information about employment prospects and often turn
to medical providers for anticipatory guidance regarding the transition to adulthood.5 The
Society for Adolescent Medicine affirms the importance of family–professional partnerships in planning for the transitional care needs of youth and specifies “vocational progress” as a
developmental area that must be addressed.6 For psychiatrists and mental health
practitioners, participation in transition planning is especially important given that the onset of many commonly co-occurring psychiatric disorders occurs during adolescence and
persists into early adulthood.7,8
Employment is a socially normative activity that often occupies the majority of adult lives
and is a key component of passage into adulthood.9 Employment for wages contributes to
individual economic and social wellbeing, is linked to positive health outcomes, is a gateway to health insurance, and is a factor in quality of life. For youth with disabilities, achieving employment through an effective transition process is a primary intended outcome
of special education per federal law.10 Yet, historically, employment has not been easily
achieved or maintained for young adults with developmental disabilities.11 There are few
nationally representative findings characterizing the employment experiences of young adults with an ASD.
A cross-sectional study of young adults ages 18 to 24 conducted in the United States found
that 54% were employed in 2011.12 A separate national survey of adults ages 26 to 31 asked
participants if they ever had at least 1 job between ages 18 to 25—98.6% replied yes.13
Similarly, the vast majority (91%) of young adults with disabilities find some form of paid
employment outside the home within the first 8 years after high school.14
Young adults with an ASD appear to fare worse in employment outcomes when compared with young adults with other types of disabilities. Shattuck et al. (2012) found that 55% of young adults with an ASD had ever worked outside the home for pay at least once in the
first six years after high school—the lowest rate across comparison disability groups.1
Very few details about the characteristics of employment experiences of young adults with
an ASD have been published.15,16 Prior research suggests that few who are employed work
independently or in competitive employment, and most are employed in sheltered workshop
settings.17 Difficulty securing and maintaining employment also extends to individuals with
autism who have average to above average intellectual ability.18,19 Factors related to
employment and other outcomes in adults with an ASD include intelligence, communication abilities, adaptive functioning level, co-occurring mental health and medical issues, and
family socioeconomic status.2,3 Evidence about employment of young adults with an ASD is
NIH-PA Author Manuscript
NIH-PA Author Manuscript
largely derived from samples that are small or not population-based, and studies of those who are already engaged with the Vocational Rehabilitation (VR) system, thereby limiting the generalizability of findings.
This study characterizes employment experiences among postsecondary young adults with an ASD using data collected in 2009 as part of a nationally representative, cohort study of young adults with disabilities who had been receiving special education services when in high school at the start of the study in 2000. We describe rates of employment, wages earned, types of jobs held, and covariate-adjusted group comparisons. Our study compares findings for the ASD group with those of young adults who had been previously served in the special education enrollment categories of mental retardation (MR), learning disability (LD), emotional disturbance (ED), and speech/language impairment (SLI).
METHOD
Study Participants
We used secondary data from wave 5 (collected in 2009) of the National Longitudinal Transition Study-2 (NLTS2), a 10-year prospective study of youth who were receiving special education services at the start of the study NLTS2 has ended and it is not possible to contact study participants to collect additional data. Use of these data is governed by an agreement with the U.S. Department of Education (USDE) and was deemed exempt by the Washington University Institutional Review Board. Unweighted sample sizes were rounded to the nearest 10 as required by the USDE.
Sampling and Generalizability
This study used special education classifications for determining groups. Determination of special education eligibility and specific classification within the autism category was made
by each student’s school district as per federal law.10 Independent, clinical validation of
ASD diagnosis by our team was not an option. The USDE does not require use of diagnostic criteria from the Diagnostic and Statistical Manual of Mental Disorders (DSM-IV-TR) in special education eligibility determination. Each state is allowed to operationalize its own eligibility criteria for the special educational category of autism within broad boundaries
established in federal law.20 The federal definition of autism in special education law is
consistent with DSM-IV-TR criteria, but much less specific. Prior research has indicated that 99% of students eligible for special education under the category of autism also meet
DSM-IV–derived case criteria for an ASD.21,22 The autism special education category tends
to be highly specific and moderately sensitive. Some youth with an ASD might receive special education services under a disability category other than autism and some might not receive special education. We excluded youth from comparison groups if parents reported their youth had ever received an autism spectrum diagnosis. Youth with an ASD who are not receiving special education services would also not be included in this study’s estimates.
NLTS2 findings generalize to the population of youth who were ages 13 through 16 as of December 1, 2000, and receiving special education services. A multistage process was used to sample by school district and then by students within the districts stratified by disability category. A total of 500 districts provided student rosters from which the student sample was selected; approximately 11,280 students were sampled and 81.9% participated in the first wave of data collection. Large national surveys often use a weighting strategy to ensure that point estimates generalize to the population from which the sample was drawn. NLTS2 survey weights were rigorously calculated at each wave of data collection to ensure that point estimates were representative of the target population. Further, each of the four follow-up waves of NLTS2 data was subject to bias analysis to ascertain the extent of difference
NIH-PA Author Manuscript
NIH-PA Author Manuscript
between the weighted respondent sample for a given wave and both the wave 1 weighted sample and extant data from other sources on the characteristics of the population NLTS2
was designed to represent.23,24 The U.S. Office of Management and Budget approved
release of the data after rigorous review of the sampling and adjustment procedures. Detailed information on the NLTS2 sampling strategy, survey weighting, and questionnaire
design has been previously published.25
Data Collection
The NLTS2 survey instruments incorporated items from several other national, long-standing longitudinal surveys of youth (e.g., The National Longitudinal Study of Adolescent Health, the National Longitudinal Survey of Youth) and involved field testing with parents
of youth in several disability categories and with youth themselves.26 NLTS2 telephone
interviews were conducted by a professional contract research firm whose telephone interview staff were rigorously trained and continually monitored. If the parent or guardian had earlier reported that the young adult was capable of answering questions independently, repeated attempts were made to interview both the young adult and the parent or guardian most knowledgeable about the young adult.
The focus of this study was 620 young adults who had previously received special education services in secondary school under the autism eligibility category. The retention rate at wave 5 was 67% of the 920 who participated in wave 1. This response rate exceeded the estimated sample size (n=452) required to provide data that would achieve an acceptable level of
statistical precision.27
Young adults previously served in the special education enrollment categories of mental retardation (MR), learning disability (LD), emotional disturbance (ED), or speech/language impairment (SLI) were chosen for comparison because they often share some, but not all, disability features with those who have an ASD and might reasonably be expected to encounter similar challenges with employment. Group labels reported in this study, such as “mental retardation,” reflect the NLTS2 survey terminology and federally designated category labels in use at the time of the study. We wish to emphasize that the term
“intellectual disability” is currently the preferred term recommended for practice.28
Measures
Employment Outcomes—Data on employment were gathered through a sequence of survey questions that first asked, “At any time since high school did [YOUTH] work for pay other than work around the house?” Participants were also asked “Does [YOUTH] have a paid job now, other than work around the house?” Job type was coded using the U.S. Bureau of Labor’s Standardized Occupational Classification (SOC) system for classifying work for pay or profit, excluding volunteer work. The SOC codes utilize 23 major occupational
categories further classified by specific (minor) job types.29
Covariates—Demographic variables included age, sex, race, ethnicity, and household income. Overall health status was reported using a 4-point scale ranging from fair/poor to excellent. Conversational impairment was assessed with a question asked of parents: “How well does [YOUTH] carry on a conversation?” Ordinal responses included “Has no trouble,” “Has a little trouble,” “Has a lot of trouble,” or “Doesn’t carry on a conversation at all,” in which a higher score indicated greater conversational impairment.
A functional skills scale was constructed by summing responses to eight questions (each with 4-point responses ranging from “not at all well” to “very well”), measured at wave 4 in 2006–2007, which assessed ability to tell time, read and understand common signs, count
NIH-PA Author Manuscript
NIH-PA Author Manuscript
change, find phone numbers and use a phone, navigate to places outside home, use public transportation, purchase clothing at a store, and arrange out-of-town travel. The range of possible scores was 8–32, with higher scores indicating greater functional skills. This scale was used as a continuous variable in regressions. Categories representing the upper and lower quartiles of the scale scores were used to create Figure 1. Of note, this functional skills scale was not intended to be a proxy for IQ. There was no assessment of IQ in the NLTS2. Functional skills and IQ are distinct constructs.
The rate of missing data for covariates ranged from 0% to 21%. Two variables had more than 10% missing: household income (21%), and the functional skills scale (20%). We used IVEware (version 0.1) to impute 50 implicates through sequential regression for all
covariates to prevent bias associated with listwise deletion.30 We did not impute the
employment dependent variables.
Data Analyses
All analyses were conducted with Stata 12, using survey weighting and appropriate variance
adjustment for the complex survey design.31 Descriptive statistics were estimated for
covariates and select employment outcomes for the ASD group (Table 1).We then tested for significant differences in the odds of employment between each group and the ASD group using logistic regression and adjusting for covariates (Table 2). The highest frequency job types for each disability group were tabulated and rank ordered (Table 3). We used logistic regression to examine the odds of ever having paid employment for the ASD group only (Table 4).
To visually depict the impact of both socioeconomic status and functional abilities, we calculated the estimated percentage of ever having a job for 4 subgroups of youth with an ASD defined by parental household income below $25,000 or above $75,000 and the highest or lowest quartiles of functional skills (Figure 1). This was done using the margins
postestimation procedure in Stata after fitting a logistic regression model.32
RESULTS
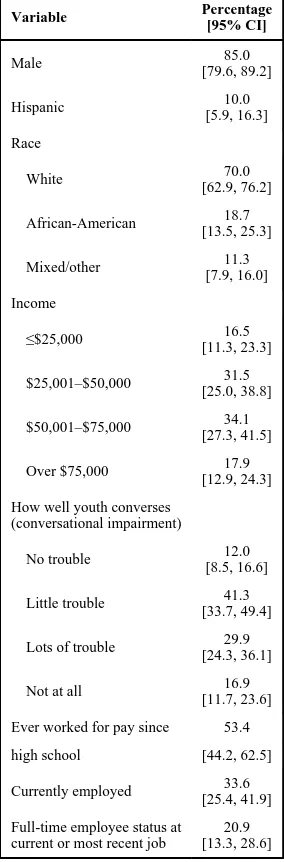
Youth with an ASD were primarily male (85.0%) and White (70.0%) with a mean age of 23.2 (range 21–25 years) (Table 1). Most (87.1%) had been out of high school for more than 2 years. According to parent report, 16.9% could not converse at all.
The probability of employment was independently associated with both higher household income and better functional skills (Figure 1). Most young adults (85%) in the highest income/highest skill group had worked for pay since leaving high school, compared with 12% of those in the lowest income/lowest skill group.
About half (53.4%, 95% CI 44.2–62.5) of young adults with an ASD had ever worked for pay outside the home since leaving high school. A significantly higher (p<.001) percentage of young adults in the ED (88.2%, 95% CI 83.7–92.7), LD (89.8%, 95% CI 84.8–94.7), and SLI (88.2%, 95% CI 80.8–95.6) disability categories had ever been employed over the same time span (not in tables). There was no significant difference in ever having worked between the ASD and the MR (62.8%, 95% CI 56.7–69.0) groups. The stratified rate of employment among those with no trouble conversing was 81.9% (95% CI 68.2–90.6) and was 18.8% (94% CI 8.6–36.2) for those with no conversation ability.
One-third (33.6%, 95% CI 25.4–41.9) of young adults with an ASD were currently employed at the time of the interview. Among young adults with an ASD who had ever worked for pay since high school, the average number of jobs held was 2.5 (95% CI 2.1–
NIH-PA Author Manuscript
NIH-PA Author Manuscript
3.0), significantly fewer (p<.001) than for young adults with ED (mean=4.1, 95% CI 3.7– 4.6), LD (mean=4.0, 95% CI 3.6–4.4), or SLI (mean=3.6, 95% CI 3.2–4.0) (p<.001). There was no significant difference in the average number of jobs between the ASD and the MR (mean=2.8, 95% CI 2.4–3.1) groups.
About 1 in 5 youth with an ASD (20.9%, 95% CI 13.3-28.6) worked full time (>35 hours per week) at their current or most recent job—about half the rate of the MR group (39.7%, 95% CI 32.0–47.4, p<.01) and about one-third the rate of the ED (61.3%, 95% CI 54.3–68.2, p<.001), LD (73.3%, 95% CI 67.5– 79.0, p<.001), and SLI (62.8%, 95% CI 56.4–69.2, p<. 001) disability groups. Young adults with an ASD earned a mean wage of $8.10 U.S. dollars/hour (95% CI 6.20–9.90) at their full-time jobs, significantly lower (p<.01) than members of the ED ($11.90, 95% CI 10.60–13.10), LD ($11.20, 95% CI 10.40–12.00), and SLI ($12.00, 95% CI 10.70–13.20) groups. There was no significant difference in mean wages between the ASD and the MR ($9.20, 95% CI 8.10–10.30) groups. Additional analysis revealed no significant differences across disability groups in receipt of job-related health insurance benefits.
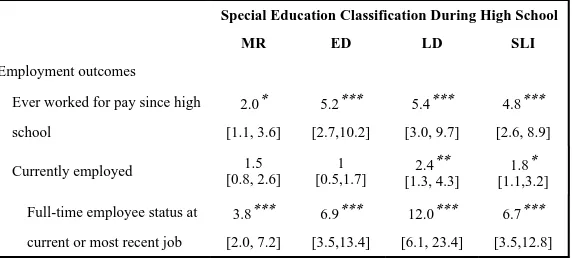
After adjusting for covariates (including functional skills and conversational ability) the odds of ever having worked for pay since high school were significantly higher for each group compared with the ASD group (Table 2). The adjusted odds of having full-time employment at a current or most recent job were nearly 4 times higher for young adults with MR (p<.001), and 6 to 12 times higher for young adults with ED, LD, and SLI (p<.001).
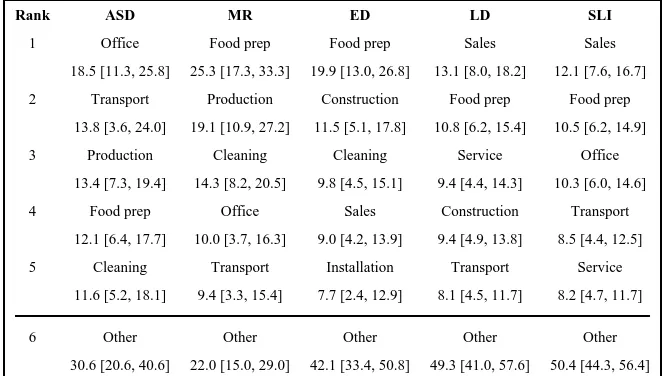
The top 5 occupational classifications for young adults with an ASD or MR accounted for about 70% to 80% of all employment at the current or most recent job (Table 3). Young adults with an ASD were most frequently employed in office and administrative support occupations, which most often involved material recording, scheduling, dispatching, and distributing. Transportation and materials moving jobs also were common, as was
production work involving assembly, food processing, or work in factories. Other frequent job types included food preparation and serving, and building or grounds cleaning and maintenance. Job types within the ED, LD, and SLI groups were more variable and were less clustered within each group’s top five occupational classifications.
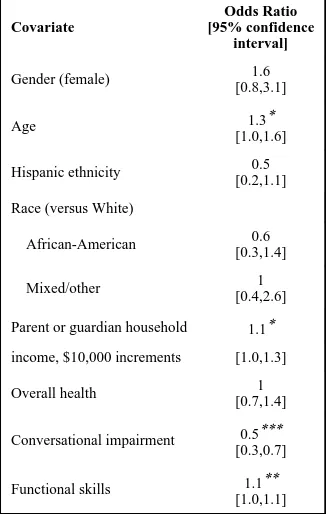
Young adults with an ASD had higher odds of ever having had a paid job if they were older (OR=1.3, 95% CI 1.0–1.6; p<.05), from higher income households (OR=1.1, 95% CI 1.0– 1.3; p<.05), or had higher functional skills (OR=1.1, 95% CI 1.0–1.1; p<.01) (Table 4). Greater conversational impairment was associated with lower odds of ever having had a paid job (OR .5, 95% CI 0.3–0.7; p<.001).
DISCUSSION
We examined key characteristics of postsecondary employment for young adults with an ASD during the first decade after high school and compared these outcomes with those of young adults with different disabilities. A little over half of young adults with an ASD had ever had a paid job outside the home since high school, roughly equivalent to recently
published rates.1,3 However, the covariate-adjusted odds of ever having worked for pay
since high school were significantly higher for young adults in the MR, ED, LD, and SLI comparison groups. Better outcomes for young adults from comparison disability types with similar demographic and disability characteristics highlight the achievement gap facing youth with ASDs.
In their current or most recent jobs, the vast majority of young adults with an ASD were working less than full-time, with average earnings of about $8.00 per hour, significantly lower than average wages for young adults in the comparison groups. Our findings also
NIH-PA Author Manuscript
NIH-PA Author Manuscript
suggested that young adults with an ASD had fewer jobs and less variation in types of jobs than young adults in comparison groups.
Young adults with an ASD who had higher functional skills, better conversational abilities, and higher household incomes were more likely to achieve employment. Higher household
income in this population also corresponds to higher rates of service use,33 and is a marker
for social capital—a construct that entails resources to which an individual has access
through a network of social relations.34,35 Social capital is associated with higher rates of
employment in the general population.36
Even among those with an ASD who had the most impaired conversational abilities, about one-fifth did become employed. This highlights that employment is potentially feasible even among those with high levels of impairment.
This study had some notable limitations. The age range of participants creates variation in the length of time that young adults had been out of school. Thus, data on variables like “number of jobs held,” which is partly a function of time since high school, need to be interpreted with caution. An additional limitation was the absence of measures of IQ or psychiatric symptoms in the NLTS2. This made it impossible to identify comorbid conditions or establish their influence on outcomes. The functional skills and conversation impairment survey questions provided some measure of disability severity with high face validity, yet have not been validated with the rigor of normed clinical measures.
The results of this study generalize to young adults who were ages 13–16 and receiving special education under the autism category in 2000. It is impossible to precisely estimate the degree to which results generalize to the entire population of young adults with an ASD. To the best of our knowledge, there have been no U.S. studies of young adults with an ASD that are perfectly representative of the entire ASD population. Indeed, devising a sampling procedure that would result in a perfectly representative sample of the entire autism spectrum in young adulthood is difficult to conceive. However, the characteristics of the population represented by our sample approximated the male:female ratio, race, and
ethnicity distributions of other recent population-based research on autism.37,38 The wide
range of conversational and functional skills impairments in the NLTS2 ASD population is
consistent with the spectrum of diagnostic features that characterize ASD diagnosis.39
We excluded cases from comparison groups if a parent reported the youth had ever received an ASD diagnosis. However, it is still possible that some youth in comparison groups would also meet diagnostic criteria for an ASD if clinically assessed. If this were the case then it is possible that observed group differences might actually underestimate the true magnitude of group differences. As this study was based on secondary survey data, we had no way to go back and contact participants for additional data collection using more rigorous clinical measures.
This study also has several strengths. First, it used nationally representative estimates from a large and recent sample of young adults with an ASD at 21–25 years of age. Second, comparison with young adults with other types of disabilities helps contextualize the findings for ASDs. Third, this study provided results stratified by income and functional skills, providing baseline data on employment in vulnerable subpopulations of young adults with an ASD. Awareness and monitoring of these vulnerable subgroups is critical, as they may be in need of additional services and supports to successfully transition into
postsecondary employment. Last, NLTS2 incorporated rigorous methods for developing, field testing, and administering survey protocols and extensively analyzed and adjusted for nonresponse bias in the sample at each wave of data collection.
NIH-PA Author Manuscript
NIH-PA Author Manuscript
Our findings of consistently poorer outcomes for young adults with an ASD relative to other disability groups suggest that this population is experiencing particular difficulty in
successfully transitioning to employment in the first years after high school. Overall, patterns of low employment rates, hours worked, and wages, in conjunction with limited job types, appear insufficient for supporting independent living for young adults with an ASD. Thus, families are likely bearing increased financial burden for continued dependent support.
This study confirms that employment can occur for many young adults with an ASD over the initial years after school, even for those with severe levels of impairment. Strategies for improving employment outcomes might include providing work experiences during high
school,40 deliberate matching of capabilities to job types during transition planning,41
attention to the vulnerabilities of disadvantaged youth with ASD during and beyond
transition,2 and increased flexibility of institutional supports provided over the occupational
life course.19 Given expectations for continued growth in the number of young adults with
an ASD entering adulthood, urgent consideration should be given to employment
preparation that is consistent with the current labor market in order to facilitate employment and minimize costs to society. Future research is needed to determine how training provided during secondary school, in addition to postsecondary vocational education and
rehabilitation services, contributes to future employment.
Acknowledgments
This work was supported by funding to Dr. Shattuck from the Emch Foundation, Autism Speaks and the National Institute of Mental Health (NIMH; R01 MH086489). Its contents are solely the responsibility of the authors and do not represent the views of NIMH or other funders.
References
1. Shattuck PT, Narendorf SC, Cooper B, Sterzing PR, Wagner M, Taylor JL. Postsecondary education and employment among youth with an autism spectrum disorder. Pediatrics. 2012; 129(6):1042– 1049. [PubMed: 22585766]
2. Shattuck PT, Roux AM, Hudson LE, Lounds Taylor J, Maenner MJ, Trani J-F. Services for Adults With an Autism Spectrum Disorder. Can J Psychiat. 2012; 57(5):284–291.
3. Howlin P, Moss P. Adults with autism spectrum disorders. Can J Psychiat. 2012; 57(5):275–283. 4. Carbone PS, Behl DD, Azor V, Murphy NA. The medical home for children with autism spectrum
disorders: Parent and pediatrician perspectives. Journal of Autism and Developmental Disorders. 2010; 40(3):317–324. [PubMed: 19768528]
5. American Academy of Pediatrics; American Academy of Family Physicians; American College of Physicians-American Society of Internal Medicine. A consensus statement on health care transitions for young adults with special health care needs. Pediatrics (Evanston). 2002; 110(6):1304–1306. 6. Rosen DS, Blum RW, Britto M, Sawyer SM, Siegel DM. Transition to adult health care for
adolescents and young adults with chronic conditions: position paper of the Society for Adolescent Medicine. J Adolescent Health. 2003; 33(4):309–311.
7. Kessler RC, Berglund P, Demier O, Jin R, Merikangas KR, Walters EE. Lifetime prevalence and age-of-onset distributions of DSM-IV disorders in the National Comorbidity Survey Replication. Arch Gen Psychiat. 2005; 62(6):593–602. [PubMed: 15939837]
8. Costello EJ, Mustillo S, Erkanli A, Keeler G, Angold A. Prevalence and development of psychiatric disorders in childhood and adolescence. Arch Gen Psychiat. 2003; 60(8):837–844. [PubMed: 12912767]
9. Fussell, E.; Furstenberg, FJ. The Transition to Adulthood during the Twentieth Century: Race, nativity, and gender. In: Setterson, RA., Jr.; Furstenberg, FF., Jr.; Rumbaut, RG., editors. On the Frontier to Adulthood: theory, research, and public policy. University of Chicago Press; Chicago: 2005. p. 29-75.
NIH-PA Author Manuscript
NIH-PA Author Manuscript
10. U. S. Department of Education. Individuals with Disabilities Education Act. 2004; (14) PL 108-446, Section 1400(c).
11. Wehman PH. Employment for persons with disabilities: Where are we now and where do we need to go? J Vocat Rehabil. 2011; 35(3):145–151.
12. Taylor, P.; Parker, K.; Kochhar, R., et al. Young, Underemployed, and Optimistic: Coming of age, slowly, in a tough economy. Pew Research Center; Washington, DC: Available at:
www.pewsocialtrends.org.
13. Bureau of Labor Statistics. America’s young adults at 25: School enrollment, number of jobs held and labor market activity: Results from a longitudinal survey. U.S. Department of Labor; Washington DC: 2013. Available at: www.bls.gov/nls
14. Newman, L.; Wagner, M.; Knokey, A-M., et al. A Report from the National Longitudinal Transition Study-2 (NLTS2) (NCSER 2011-3005). SRI International; Menlo Park, CA: 2011. The Post-High School Outcomes of Young Adults with Disabilities up to 8 Years After High School. 15. Eaves LC, Ho HH. Young adult outcome of autism spectrum disorders. J Autism Dev Disord.
2008; 38(4):739–747. [PubMed: 17764027]
16. Taylor JL, Seltzer MM. Employment and post-secondary educational activities for young adults with autism spectrum disorders during the transition to adulthood. J Autism Dev Disord. 2011; 41(5):566–574. [PubMed: 20640591]
17. Taylor JL, Seltzer MM. A Systematic Review of Vocational Interventions for Young Adults With Autism Spectrum Disorders. Pediatrics (Evanston). 2012; 130(3):531–538.
18. Howlin P, Alcock J, Burkin C. An 8 year follow-up of a specialist supported employment service for high-ability adults with autism or Asperger syndrome. Autism : The International Journal of Research and Practice. 2005; 9(5):533–49. [PubMed: 16287704]
19. Barnhill GP. Outcomes in adults with asperger syndrome. Focus on Autism and Other Developmental Disabilities. 2007; 22(2):116–126.
20. American Psychiatric Association. Diagnostic and Statistical Manual of Mental Disorders. 4th. Washington DC: 2000. Text
21. Yeargin-Allsopp M, Rice C, Karapurkar T, Doernberg N, Boyle C, Murphy C. Prevalence of autism in a US metropolitan area. J Am Med Assoc. 2003; 289(1):49–55.
22. Bertrand J, Mars A, Boyle C, Bove F, Yeargin-Allsopp M, Decoufle P. Prevalence of autism in a United States population: the Brick Township, New Jersey, investigation. Pediatrics (Evanston). 2001; 108(5):1155–1161.
23. Javitz, H.; Wagner, M. SRI International for Office of Special Education Programs. U.S.
Department of Education; Menlo Park, CA: 2003. Analysis of potential bias in the sample of local education agencies (LEAs) in the national longitudinal transition study-2 (NLTS2) sample; p. 54 24. Javitz, H.; Wagner, M. SRI International for Office of Special Education Programs. U.S.
Department of Education; Menlo Park, CA: 2005. Analysis of potential bias in the wave 1 and wave 2 respondents to the National Longitudinal Transition Study-2 (NLTS2) sample. 25. Wagner M, Kutash K, Duchnowski AJ, Epstein MH. The Special Education Elementary
Longitudinal Study (SEELS) and the National Longitudinal Transition Study (NLTS2): Study designs and implications for children and youth with emotional disturbances. J Emo Behav Disord. 2005; 13:25–41.
26. Cameto, R.; Wagner, M.; Newman, L.; Blackorby, J.; Javitz, H. National Longitudinal Transition Study II (NLTS2) study design, timeline, and data collection. SRI International; Menlo Park, CA: 2000b. p. 20Available at: http://nlts2.org/studymeth/nlts2_sampling_plan2.pdf
27. Cameto, R.; Wagner, M.; Newman, L.; Blackorby, J.; Javitz, H. National Longitudinal Transition Study II (NLTS2) sampling plan. SRI International; Menlo Park, CA: 2000a. p. 20Available at: http://nlts2.org/studymeth/nlts2_sampling_plan2.pdf
28. Schalock RL, Luckasson RA, Shogren KA. The renaming of mental retardation: understanding the change to the term intellectual disability. Intellectual and developmental disabilities. 2007; 45(2): 116–124. [PubMed: 17428134]
29. Bureau of Labor Statistics. Standard occupational classification (SOC) User Guide. U.S. Department of Labor; Washington DC: 2000. Available at: www.bls.gov
NIH-PA Author Manuscript
NIH-PA Author Manuscript
30. Raghunathan, TE.; Solenberger, PW.; Van Hoewyk, J. Survey Methodology Program, Survey Research Center, Institute for Social Research. University of Michigan; Ann Arbor, MI: 2002. IVEware: Imputation and variance estimation software.
31. StataCorp. Stata: Release 12. Statistical Software. StataCorp LP; College Station, TX: 2011. 32. StataCorp. Stata Base Reference Manual. Release 12. Vol. Volume 2. Stata Press; 2011. G-M 33. Shattuck PT, Wagner M, Narendorf SC, Sterzing PR, Hensley M. Post-high school service use
among young adults with an autism spectrum disorder. Arch Pediat Adol Med. 2011; 165(2):141– 146.
34. Coleman JS. Social Capital in the Creation of Human Capital. Am J Sociol. 1994; 94(supple):S95– S120.
35. Adler PS, Kwon S-W. Social Capital: Prospects for a new concept. The Academy of Management Review. 2002; 27(1):17–40.
36. Granovetter, M. Getting a Job: A Study of Contacts and Careers. University of Chicago Press; Chicago: 1995.
37. Levy SE, Giarelli E, Lee L-C, et al. Autism spectrum disorder and co-occurring developmental, psychiatric, and medical conditions among children in multiple populations of the United States. J Dev Behav Pediatr. 2010; 31(4):267–275. [PubMed: 20431403]
38. Schieve LA, Rice C, Yeargin-Allsopp M, et al. Parent-Reported Prevalence of Autism Spectrum Disorders in US-Born Children: An Assessment of Changes within Birth Cohorts from the 2003 to the 2007 National Survey of Children’s Health. Maternal and Child Health Journal. 2012; 16(S1): 151–157.
39. Johnson CP, Myers SM. Identification and evaluation of children with autism spectrum disorders. Pediatrics. 2007; 120(5):1183–1215. [PubMed: 17967920]
40. Hendricks DR, Wehman PH. Transition from school to adulthood for youth with autism spectrum disorders. Focus on Autism and Other Developmental Disabilities. 2009; 24(2):77–88.
41. McDonough JT, Revell G. Accessing employment supports in the adult system for transitioning youth with autism spectrum disorders. J Vocat Rehabil. 2010; 32:89–100.
NIH-PA Author Manuscript
NIH-PA Author Manuscript
CLINICAL GUIDANCE
• • About half of young adults with an autism spectrum disorder (ASD) work for
pay within the first 8 years following high school.
• • The postsecondary employment rate for young adults with an ASD is lower
than the rate seen in other disability groups even after controlling for income, severity and other factors.
• • Odds of ever having worked for pay were higher for young adults with an
ASD who were from higher-income households, who had better conversational abilities or functional skills.
NIH-PA Author Manuscript
NIH-PA Author Manuscript
Figure 1.
Marginal estimates of the rate of ever having employment since high school among youth with an autism spectrum disorder, stratified by the high and low levels of income and functional skills.
NIH-PA Author Manuscript
NIH-PA Author Manuscript
NIH-PA Author Manuscript
NIH-PA Author Manuscript
NIH-PA Author Manuscript
Table 1
Descriptive Statistics and 95% CI for Covariates and Employment Outcomes Among Young Adults With an Autism Spectrum Disorder.
Ever worked for pay since 53.4
high school [44.2, 62.5]
NIH-PA Author Manuscript
NIH-PA Author Manuscript
NIH-PA Author Manuscript
Table 2
Adjusted Odds Ratios (95% CI) of Employment Experiences Among Young Adults With Other Disabilities Compared to Those With Autism, Controlling for Covariates.
Special Education Classification During High School
MR ED LD SLI
Employment outcomes
Ever worked for pay since high 2.0* 5.2*** 5.4*** 4.8***
school [1.1, 3.6] [2.7,10.2] [3.0, 9.7] [2.6, 8.9]
Currently employed 1.5
[0.8, 2.6] 1
[0.5,1.7] [1.3, 4.3]2.4**
1.8* [1.1,3.2]
Full-time employee status at 3.8*** 6.9*** 12.0*** 6.7***
current or most recent job [2.0, 7.2] [3.5,13.4] [6.1, 23.4] [3.5,12.8]
Note: Covariates: gender, age, race, ethnicity, income, overall health, how well youth converses, functional skills. National Longitudinal Transition Study-2 (NLTS2), Wave 5, 2009. Weighted to population levels. Variances adjusted for sampling method. ASD=autism spectrum disorder; ED=emotional disturbance; LD=learning disability; MR=mental retardation; SLI=speech/language impairment.
* p<.05,
** p<.01,
NIH-PA Author Manuscript
NIH-PA Author Manuscript
NIH-PA Author Manuscript
Table 3
Rank Ordered Major Standard Occupational Classifications Among Postsecondary Young Adults at Their Current or Most Recent Job by Disability Group, % [95% CI].
Rank ASD MR ED LD SLI
1 Office Food prep Food prep Sales Sales
18.5 [11.3, 25.8] 25.3 [17.3, 33.3] 19.9 [13.0, 26.8] 13.1 [8.0, 18.2] 12.1 [7.6, 16.7]
2 Transport Production Construction Food prep Food prep
13.8 [3.6, 24.0] 19.1 [10.9, 27.2] 11.5 [5.1, 17.8] 10.8 [6.2, 15.4] 10.5 [6.2, 14.9]
3 Production Cleaning Cleaning Service Office
13.4 [7.3, 19.4] 14.3 [8.2, 20.5] 9.8 [4.5, 15.1] 9.4 [4.4, 14.3] 10.3 [6.0, 14.6]
4 Food prep Office Sales Construction Transport
12.1 [6.4, 17.7] 10.0 [3.7, 16.3] 9.0 [4.2, 13.9] 9.4 [4.9, 13.8] 8.5 [4.4, 12.5]
5 Cleaning Transport Installation Transport Service
11.6 [5.2, 18.1] 9.4 [3.3, 15.4] 7.7 [2.4, 12.9] 8.1 [4.5, 11.7] 8.2 [4.7, 11.7]
6 Other Other Other Other Other
30.6 [20.6, 40.6] 22.0 [15.0, 29.0] 42.1 [33.4, 50.8] 49.3 [41.0, 57.6] 50.4 [44.3, 56.4]
NIH-PA Author Manuscript
NIH-PA Author Manuscript
NIH-PA Author Manuscript
Table 4
Logistic Regression Model of Having Ever Worked for Pay Since High School Among Young Adults With an Autism Spectrum Disorder.
Covariate
Odds Ratio [95% confidence
interval]
Gender (female) 1.6
[0.8,3.1]
Age 1.3*
[1.0,1.6]
Hispanic ethnicity 0.5
[0.2,1.1]
Race (versus White)
African-American 0.6
[0.3,1.4]
Mixed/other 1
[0.4,2.6]
Parent or guardian household 1.1*
income, $10,000 increments [1.0,1.3]
Overall health 1
[0.7,1.4]
Conversational impairment 0.5*** [0.3,0.7]
Functional skills 1.1**
[1.0,1.1]
Note: National Longitudinal Transition Study-2 (NLTS2), Wave 5, 2009. Variances adjusted for sampling method. Number of multiply imputed data sets = 50.
* p<.05,
** p<.01,