STUDY ON ROAD-SIDE CARBON DIOXIDE CONCENTRATION IN AN
INTEGRATED BUSINESS PARK IN SINGAPORE
Nedyomukti Imam Syafii, Steve Kardinal Jusuf, and Wong Nyuk Hien Department of Building, School of Design and Environment, National University of Singapore, 4
Architecture Drive, Singapore 117566, Singapore Email: [email protected], [email protected]
ABSTRACT
As an industrialized country at the crossroads of Asian shipping lanes, Singapore is not spared from the threat of increasing CO2 emissions. In an effort to document the existence of this phenomenon, field measurements were conducted
to study and quantify the spatial variability of CO2 levels in the near-surface air of an integrated business park: One-North,
Singapore. The result, a weekday-weekend comparison analysis, showed that traffic volumes influenced CO2
concentration predominantly. However, suburban vegetation moderated the CO2 concentration during the daytime. The
magnitude of morning peaks and evening build-up were largely dependent on the traffic within the source area at the time of the measurement. All zones showed that the lowest mean CO2 concentration over One-North area is at the weekend,
due to the drop on vehicular traffic and human activities. In particular, the present of lush greenery are notably able to further moderate the low-atmosphere CO2 concentration.
Keywords: Road-side CO2 emission, field measurement, integrated business park, singapore
INTRODUCTION
There is an emergent concern that the planet Earth is in the midst of a climatic change – a global warming - because of human activities on a global scale. While this global warming has not been demonstrated clearly, the scientific evidence from ice cores showed a convincing correlation between temperature changes and levels of carbon dioxide (CO2)1. CO2 and other gases (water vapor, methane,
N2O, ozone) have been increasing in the atmosphere
at an unprecedented rate over the past century due to human activities2. Continuous increase in the anthropogenic (caused by human) emissions of these chemicals could, over the next century, have implications on the earth’s fragile atmosphere and create a threat of air pollution.
It has been known since the end of the last century that these gases have radiative effects and lead to a general rise in air temperature. These gasses allow sunlight to enter the atmosphere almost unhindered, but obstruct the heat emitted by the earth’s surface into the space, a phenomenon often called the greenhouse effect2. It can be foreseen that with the increasing global air temperature and air pollution, serious problems that could threat on
1 J.R. Petit, et al., Climate and atmospheric history of the past
420.000 years from the Vostok ice core, Antarctica Nature 399 (1999) 429–436
2 H. Le Treut, et al., Climate Change 2007: The Physical Science
Basis. Contribution of Working Group I to the Fourth Assessment Report of the Intergovernmental Panel on Climate Change, Cambridge, United Kingdom and New York, NY, USA, Cambridge University Press, 2007
human lives will arise in the near future if nothing is done. In many large urban centers around the world, especially in developing countries, deteriorating urban air quality is a serious environmental problem.
Human activities produce carbon dioxide (CO2), primarily through the combustion of fossil
fuels and its concentration in the earth's atmosphere has risen by more than 31% since the Industrial
Revolution. The concentration of CO2 in the
atmosphere has risen from close to 280ppm (parts per million) in 1800 to a value of 367ppm in 1999, echoing the increasing pace of global agricultural
and industrial development. Atmospheric CO2
concentrations have been measured directly in high precision since 1957 and show a continuation of the increasing trend up to the present3.
As an industrialized country at the crossroads of Asian shipping lanes, Singapore is not spared from the threat of these problems. Several studies in this area have documented a number of human activities with an influence on climate in urban areas, perhaps the most well known of which is the Urban Heat Island in Singapore456.
3 R. Dave, et al., Encyclopedia of Earth, Washington, D.C.:
Environmental Information Coalition, National Council for Science and the Environment, 2006
4 N.H. Wong, Study of Urban Heat Island in Singapore,
National University of Singapore, Singapore, 2004
5 N.H. Wong, et al., Environmental study of the impact of
greenery in an institutional campus in the tropic, Building Environment, vol.42, 2007, 2949-2970.
6 Y. Chen, N.H. Wong, Thermal benefits of city parks,
Syafii, Jusuf, and Wong
Due to its geographical constraints and limited natural resources, adoption of alternative energy outside oil and gas seems unlikely. There is lack of natural benefaction to use hydropower or geothermal energy. Low wind speed limits the current technology available. The forms of renewable energy, such as solar energy and bio-fuels, are not yet cost-competitive with conventional fossil fuels. Hence, Singapore still relies on fossil fuels to meet its energy needs. With an ever growing population would mean more demands on energy, and growth on car population bringing with it problems of air pollution, particularly CO2. Throughout the course
of these studies, however, much less attention has been paid to the influence of intensive urbanization on the local concentration of atmospheric CO2,
although it is logical to assume that urbanization
may have significant effect on local CO2
concentration.
Therefore, in an effort to document the existence of this phenomenon, field measurements were conducted to study and quantify the spatial variability of CO2 levels in the near surface air of an
Integrated Business Park, One-North, Singapore. One-North is a 200-hectare development located next to Singapore's acclaimed Science Parks and close to the National University of Singapore (NUS), the National University Hospital (NUH), Singapore Polytechnic and Holland Village.
The main objective of this study is to find out the level of CO2 concentration subjected to different
environments and how these different environmental conditions correlate with the CO2 concentration.
Currently One-North area is under extensive development. Base on the new master plan, many building are going to be built and many trees are going to be cut. The study may help the planner, by able to provide some additional information from the view of urban climate, particularly CO2 concentration.
However, this study is only for initialization. Detail comparisons with other parameter affecting the CO2 concentration are not applied because the
aim of this study is for the purpose of displaying the nature of the spatial and temporal CO2 concentration
variability of an urban environment subject to different land-use and human activity.The fact, that CO2 concentration is significantly affected by the
vehicle volumes, the vehicle type, technology and fuel used, the operating mode of the vehicle (e.g. speed, acceleration and engine temperature) or the type of specific tree or vegetation, are just beyond of this study. Nevertheless, the general traffic and greenery condition are presented.
METHODOLOGY
Object of Study
To characterize the spatial variability of CO2,
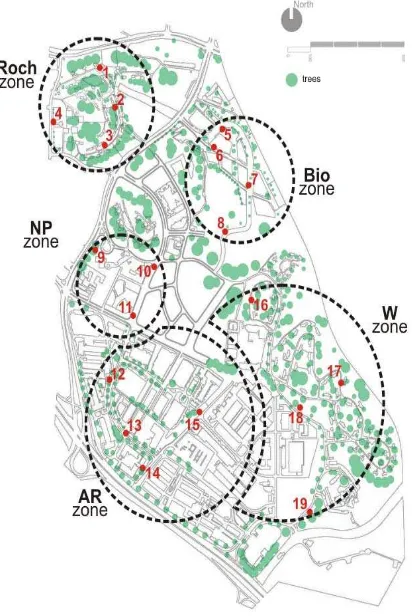
field measurements were conducted in five different
areas in an Integrated Business Park, named as One-North in Singapore. The areas include Rochester Park, Biopolis, Nepal Park, Ayer Rajah Industrial Estate and Wessex Estate. One-North is a very interesting urban area in which to investigate the local climate because various land-use exist in rather small area
• Rochester Park (ROCH zone) is a green
residential estate near North Buona Vista Road. With the winding road amidst the greenery and trees, Rochester Park is indeed a showcase of a tropical garden.
• Biopolis (BIO zone) was created by JTC with the aim of building up the biomedical sciences industry in Singapore. It consists of seven buildings, which are named as Chromos, Helios, Centros, Genome, Matrix, Nanos and Proteos. The seven high-rise building state-of-the-art infrastructure of this business area provides a full spectrum of research and training.
• Nepal Park (NP zone), located in the heart of One-North, was planned to accommodate the research and development complex. It houses various research organizations, high-tech companies, government agencies, retail outlets, and serviced apartments in one location. The area is under development, with a complex in near completion, named as Fusionopolis phase 1 and the development of Fusionopolis phase II has already been started.
• Ayer Rajah Industrial Estate (AR zone) located at the very south of the area, houses many flat factories and high tech corporations, such as the headquarters of StarHub Telecommunication. However, many mature trees still can be spotted over the area.
• The characteristics of Wessex Estate (W zone) are similar to Rochester Park. With dense greenery and a surrounding residential area. Except, Wessex Estate houses other building function such as cafés, school, military camp, and club house, which seems to have more human activities, especially during nighttime.
Field Measurements Method
Field measurements were conducted to record the CO2 concentration levels of the above-mentioned
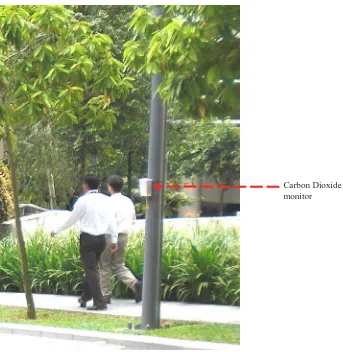
areas. The sensors were attached to the lamp-posts in various locations in One-North. The measuring units were programmed to record measurements at a 1-minute interval throughout the measurement period. CO2 concentration data is obtained by sampling the
Syafii, Jusuf, and Wong
The measurement period is from 6 March 2008 to 14 April 2008, a total of 29 days measurement is conducted. Assuming that One-North weekday traffic is greater than weekend traffic, a weekday (high vehicular traffic and human activity) and weekend (low vehicular traffic and human activity) analyses are conducted to get a better understanding of CO2 spatial and temporal patterns in the area.
Instrumentation
The main instrumentations in this study are a
Telaire7001 monitor and HOBO data logger. The Telaire7001 monitor measures Carbon-Dioxide and
Temperature. The monitors are connected to HOBO data loggers to record the readings. The data loggers and the CO2 monitor are then sealed inside a plastic
box with openings at the bottom of the box to allow the air to flow. The calibration is done in a controlled environment room before the measurements are started.
DATA FINDINGS
The data analyses are focused on reasonably clear and hot weather conditions, selected by analyzing the temperature and solar radiation data from a nearby weather station. The selected dates for weekday and weekend analysis are shown in the Table 1.
Table 1. Selected day for data analysis
March 2008 April 2008 Weekdays 6, 7, 10, 13, 14,
17, 20, 21, 24, 27, 28, 31
3, 4, 7, 17, 18
Weekend 8, 9, 15, 16, 22, 23, 29, 30
5, 6, 19, 20
Basically, the diurnal patterns of CO2
concentration are governed by that in the atmospheric mixing, but it is notably influenced by
Carbon Dioxide monitor
greenery, human activities and vehicle exhaust7. Assuming these are the major sources of the CO2
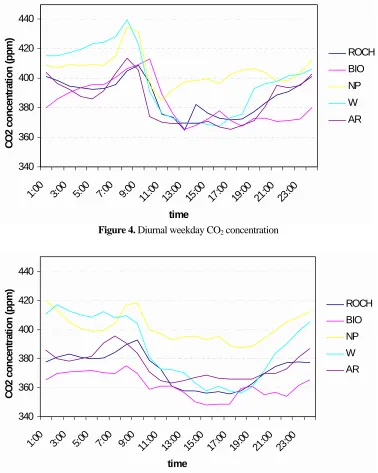
concentration on the low boundary layer atmosphere and weekday traffic is almost always greater than weekend traffic, the data are divided into weekday and weekend graph. Figure 4 and figure 5 below illustrate the nature of spatial and temporal CO2
7 M.C. Couts, J. Beringer, N.J. Tapper, Characteristics
influencing the variability of urban CO2 fluxes in Melbourne,
Australia, Atmospheric Environment, vol.41, 2007, 51-62
concentration in terms of hourly means for each of zones at One-North. The data presented is obtained by calculating the mean of the mean for each individual sampling point on each zone for the diurnal weekday and weekend set of data.
Examining the diurnal weekday trend in average CO2 concentration at the One-North area
from figure 4, the average diurnal CO2
concentrations are found more than 360ppm during the daytime and more than 380ppm at night. A maximum concentration occur during daytime, at
approximately 8 AM with average peak CO2
340 360 380 400 420 440
1:00 3:00 5:00 7:00 9:00 11:00 13:00 15:00 17:00 19:00 21:00 23:00
time
C
O
2
co
n
cen
tr
at
io
n
(
p
p
m
)
ROCH
BIO
NP
W
AR
Figure 4. Diurnal weekday CO2 concentration
340 360 380 400 420 440
1:00 3:00 5:00 7:00 9:00 11:00 13:00 15:00 17:00 19:00 21:00 23:00
time
C
O
2 con
c
en
tr
a
ti
o
n
(
p
p
m
)
ROCH
BIO
NP
W
AR
Syafii, Jusuf, and Wong
concentration of 439 ppm in the W zone and the lowest CO2 concentration is 364ppm in the ROCH
zone. However, the diurnal weekday trends for all of the zones seem to be similar, with an early morning peak, low afternoon concentration and slowly increasing CO2 concentration at nighttime.
During the weekend, the maximum average CO2 concentration was not as high as the average
CO2 concentration during the weekdays. However,
the diurnal patterns seem to be similar. A gentle decline occurs at 9AM and night time increases start at 6PM. The maximum average CO2 concentration
occurred at 9AM with a peak of 418ppm in the NP zone, and the lowest occurred at BIO zone with 348 ppm as shown in figure 5.
ANALYSIS
As shown in figure 4 and figure 5 CO2
concentration between zones more or less are at the same level during afternoon hour, except NP zone, when enhanced atmosphere vertical mixing reduced the CO2 concentration in the low-atmosphere air
nearly everywhere during daytime. The mean
daytime CO2 concentrations are found below
385ppm, which is lower than global CO2
concentration8 on the weekday and below 370ppm on the weekend. As it was expected, due to less vegetation cover and under high human activities for construction works, the mean CO2 concentration at
NP zone are found higher than the other zones during these hours. It illustrates, although each zone has different morning-peak mean CO2 concentration,
that the present of more greenery notably able to keep low the CO2 concentration. The near identical
mean CO2 atmospheric concentrations during the
afternoon, further suggest that some of the surrounding residential-zones may not have been totally outside the influence of the center-more-active zones.
Interestingly, move toward nighttime, the weekday and weekend graphical data show similar behavior for all zones, which show an increase in the near sunset hour and persist throughout the nighttime until in before-sunrise when the nearby traffic flow lead to higher mean CO2 atmospheric
concentrations. The night gradual increase is attributed to not only from the “off office” traffic flows, but also due to domestic-related activities such as cooking, etc., particularly through the
8 K.W. Thoning, P.P. Tans, and W.D. Komhyr, Atmospheric
carbon dioxide at Mauna Loa Observatory 2, Analysis of the NOAA GMCC data, 1974-1985, J. Geophys. Research, vol.94, 1989, 8549-8565
combustion of natural gas, nearby military activities and construction works. The condition further provoke by the ending of photosynthesis process by surrounding vegetation near sunset, which reduced the uptake of CO2. As a result, it allows these
nighttime CO2 sources to dominate, adding up the
atmosphere CO2 concentration. These CO2 sources
also contributed to the high morning peak, as a shallow atmosphere mixing depth and modest atmosphere vertical mixing overnight favor the build-up of CO2, which was then transported away
from the surface in the morning as atmospheric mixing increased. Similar findings were found in Melbourne, Australia during the summer9.
The diurnal patterns of average CO2
concentrations during the weekend, however, remain steady, with modest drop in the morning peak trend. This is due to variation in sensor area, influenced by the amount of vegetation uptake as well low traffic condition during the weekend, as the magnitude of the morning peaks and evening build-up were significantly depended on the traffic condition and human activities within the source area10. Although the weekend pattern does not vary significantly, it still has the similar pattern as the weekday pattern. The drop on vehicular traffic and human activities between weekdays and weekend basically are not only reducing the CO2 concentration but it also
exposes the role of greenery. The patterns are likely illustrating the cyclic photosynthesis-respiration process.
Further analysis shows, in terms of morning mean CO2 concentration drop, although it is mainly
because of increased atmosphere vertical mixing, the present of lush greenery are notably further moderate the low-atmosphere CO2 concentration.
Assuming that NP zone and W zone have the likely high activities and high traffic flow, less-greenery NP zone show reduction of morning mean peak CO2
concentration of 11.5% for weekday and 4.5% for weekend, while dense-greenery W zone show reduction of CO2 concentration of 14.5% and 9% for
weekday and weekend respectively. Regardless the peak mean CO2 concentration value of both zone,
the presence of more greenery in a high activities
area are notably able to moderate more CO2
concentration.
9 M.C. Couts, J. Beringer, N.J. Tapper, Characteristics
influencing the variability of urban CO2 fluxes in Melbourne,
Australia, Atmospheric Environment, vol.41, 2007, 51-62.
10 B. Koerner, J. Klopatek, Anthropogenic and natural CO 2
CONCLUSION
The first result from this continuous CO2
concentration measurement in One-North area has illustrated an important picture of patterns of variability, contributing to the growing worldwide database of CO2 concentration. Basically, CO2
concentration was influenced predominantly by traffic condition and human activities, but was moderated by suburban vegetation, which can help lessen the daytime CO2 concentration.
One-North (Singapore) is classified as an equatorial (tropic) climate characterized by having uniform high temperature, humidity and rainfall throughout the year, yet the climatic condition in March-April is at the beginning of the dry season. As a result, a strong inversion often develops overnight; allowing early morning traffic emissions to accumulate in the surface and causes the morning peak. Only once the sun rose and vertical mixing began, the average CO2 concentration began to
disperse from the surface and the peak concentration started to decay. In addition, at this particular time, the vegetation around the area starts the photosynthesis process, resulting in uptake of CO2 in
the surrounding area. This is essentially a flushing process of the urban surface dominated by human activities.
All zones showed that the lowest mean CO2
concentration over One-North area is at the weekend, due to the least vehicular traffic and human activities. However, the observed rates were overall higher during the nighttime due to the reduced vegetative uptake and atmospheric mixing, thereby providing a generally higher background CO2 emission on which the traffic emissions were
superimposed. In particular, the study suggests that high human activities-less greenery NP zone have fewer reduction of CO2 concentration of 11.5% for
weekday and 4.5% for weekend compare to high human activities-dense greenery W zone with 14.5% and 9% for weekday and weekend respectively.
REFERENCE
1. Koerner, B., J. Klopatek, (2002) Anthropogenic and natural CO2 emission sources in an arid
urban environment, Environmental Pollution, vol.116, S45-S51.
2. H. Le Treut, R. Somerville, U. Cubasch, Y. Ding, C. Mauritzen, A. Mokssit, et al, (2007) Historical Overview of Climate Change, in: S. Solomon, D. Qin, M. Manning, Z. Chen, M. Marquis, K.B. Averyt, M. Tignor and H. L. Miller (Eds),
Climate Change 2007: The Physical Science Basis. Contribution of Working Group I to the Fourth Assessment Report of the Intergovern-mental Panel on Climate Change, Cambridge,
United Kingdom and New York, NY, USA, Cambridge University Press.
3. Petit, J.R., J. Jouzel, D. Raynaud, N.I. Barkov, J.M. Barnola, I. Basile, et al, (1999) Climate and atmospheric history of the past 420.000 years from the Vostok ice core, Antarctica Nature 399, 429–436.
4. Thoning, K.W., P.P. Tans, and W.D. Komhyr,
(1989) Atmospheric carbon dioxide at Mauna Loa Observatory 2, Analysis of the NOAA GMCC data, 1974-1985, J. Geophys. Research, vol.94, 8549-8565.
5. Couts, M.C., J. Beringer, N.J. Tapper, (2007) Characteristics influencing the variability of
urban CO2 fluxes in Melbourne, Australia,
Atmospheric Environment, vol.41, 51-62.
6. Wong, N.H., (2004) Study of Urban Heat Island
in Singapore, National University of Singapore,
Singapore.
7. Wong, N.H., S.K. Jusuf, A.A. La Win, H.K. Thu, T.S. Negara, X. Wu, (2007) Environmental study of the impact of greenery in an institutional campus in the tropic, Building Environment, vol.42, 2949-2970.
8. Dave, R., M. Pidwirny (Lead Authors); J.
Gulledge and S. Draggan (Topic Editors), Carbon dioxide, in: Cutler J, Cleveland (Eds), (2008) Encyclopedia of Earth, Washington, D.C.: Environmental Information Coalition, National Council for Science and the Environment, 2006 [First published in the Encyclopedia of Earth September 27, 2006; Last revised October 13, 2006; Retrieved April 24.