LOCATION DISTRIBUTION OPTIMIZATION OF PHOTOGRAPHING SITES FOR
INDOOR PANORAMA MODELING
ZHANG Shuminga, Wu Jiamana, ZHANG Yueyaoa, ZHANG Xinyuea, XIN Zhejunb, LIU Jingbinc,d,∗
a
School of Remote Sensing and Information Engineering, Wuhan University, China b
Computer School of Wuhan University, Wuhan, China
cState Key Laboratory of Information Engineering in Surveying, Mapping and Remote Sensing, Wuhan University d
Collaborative Innovation Center of Geospatial Technology, Wuhan University Wuhan, China - [email protected]
KEY WORDS:Indoor Panorama Modeling, Location of Panorama Site, Image Clarity, Panorama Distortion, Panorama System Eval-uation
ABSTRACT:
Generally, panoramas image modeling is costly and time-consuming because of photographing continuously to capture enough photos along the routes, especially in complicated indoor environment. Thus, difficulty follows for a wider applications of panoramic image modeling for business. It is indispensable to make a feasible arrangement of panorama sites locations because the locations influence the clarity, coverage and the amount of panoramic images under the condition of certain device. This paper is aim to propose a standard procedure to generate the specific location and total amount of panorama sites in indoor panoramas modeling. Firstly, establish the functional relationship between one panorama site and its objectives. Then, apply the relationship to panorama sites network. We propose the Distance Clarity function (FCandFe) manifesting the mathematical relationship between panoramas and objectives
distance or obstacle distance. The Distance Buffer function (FB)is modified from traditional buffer method to generate the coverage
of panorama site. Secondly, transverse every point in possible area to locate possible panorama site, calculate the clarity and coverage synthetically. Finally select as little points as possible to satiate clarity requirement preferentially and then the coverage requirement. In the experiments, detailed parameters of camera lens are given. Still, more experiments parameters need trying out given that relationship between clarity and distance is device dependent. In short, through the functionFC,FeandFB, locations of panorama sites can be
generated automatically and accurately.
1. INTRODUCTION
1.1 Indoor Panoramic Image Modeling
Recently, Indoor 3D modeling has been a hot spot in many re-search field such as smart city and Location Based Service (LB-S) for the favorable experience to present the indoor scenes. Commercial protential like Google Street View also boosts the widespread adaption and research on this issue. Methods are mainly divided into three part: traditional manual modeling, real 3D modeling based on images or laser point cloud data (Liu et al., 2005, Yinbao Zhang, 2014, Yinan Shi, 2016).
Manual modeling methods are those using algorithm or software to reform the structure and shape of objects. One successful application is 3D animation and computer game. These meth-ods require large amount of manual operation which is time-consuming, and the models are elaborate enough to present lively figures with precise geometry. Similarly, methods 3D modeling based on laser point clouds or depth images are accurate to record the position and geometry information. Particularly, laser point clouds and depth images are favorable to combine with manu-al modeling so that the 3D model can be vivid. Among these, indoor panoramic image modeling has aroused much concern s-ince the virtual reality technology develops rapidly. It is a pseudo 3D modeling method because panoramas are still plane pictures. Compared with other indoor modeling methods, it is a fast model-ing method with high degree of reduction and wealth information
∗Corresponding author
though geometry might in a low level (Sandnes, 2016). General-ly, panoramic images are reprojected onto a sphere which makes depth available when viewing the images (Zheng and Shi, 2008).
Shuai Liu has summaried the applications of panoramic model-ing and four main factors includmodel-ing stitchmodel-ing algorithm, acquire methods, image projection and deformation correction are men-tioned to be important (Shuai et al., 2012). Lee and Tsai has make some respectful efforts in proposing a prove-of-concept in interi-or 3D modeling with paninteri-orama. They attached much significance to parameters of camera (Lee, 2015). In 2012, Google compa-ny put forward a combination of iterative vision-based pose esti-mation with user guided optimization enabling photographers to build street view outdoor, it take whole street into account (Col-bert et al., 2012). In addition, there is plenty of research on image stitching, pyramid mulitiscale segmentation and image transition which requires accurate geometry information.
the expense of panorama acquisition because of the secondary collection in need.
To solve these problems, this paper is aimed to propose a standard procedure to generate the specific location of panorama sites in indoor panorama modeling. To arrange the location of panorama sites, it is important to make a balance between the panoramic im-age quality and the number of panoramas, given that the more the panorama sites are, the more images are available and they con-tribute to a higher quality and clarity of panorama modeling. The quality of panorama modeling is dependent on not only image processing driven by software but also image acquiring driven by hardware such as laser scanners and high precision GPS de-vices. Generally, to guarantee the quality of panorama images, more picture than the necessary amount were acquired during photographing by continuously capturing photos along the fixed roaming routes without any design. Besides, owing to the cum-bersome hardware demanded to accurately locate the imagery site, such as high precision GPS devices (Colbert et al., 2012) Huang and Klette have derived formulas suitable for various sorts of stereo panorama imaging technologies by means of determin-ing optimum parameters not only for high-accuracy panoramic image shooting and displaying with a special focus on automatic image disparity enhancement (Huang and Klette, 2010).
1.2 Evaluation of Indoor Panorama Modeling
On the basis of Huang and Klette’s research, we determine the evaluation parameters capable to apply to balance the quality and quantity of panoramic images.
The quality of panorama modeling is dependent on not only the image processing with software but also the image shooting hard-ware. The image quality, such as clarity and distortion, affects the visual experience of users greatly. In many panoramic projects, more pictures beyond necessary were acquired during continu-ously photographing along the fixed routes without any design so as to guarantee the quality of panorama images. Meantime, if researchers collect panorama images in few sites the low cover-age of neighboring panorama will give users a bad impact. The procedure of developing a panorama system without design is costly and time-consuming, which keep panorama modeling from widely applying (The application of panorama modeling is main-ly limited in touring services such as street view because of high input in panoramic images acquisition, which slows the large ex-pansion and fast development of panorama modeling in different business such as shopping mall).
The purpose of our study is to select as less points as possible to cover as much area as possible, meanwhile, making the image visual effect the best, which contributes a better effect of indoor panorama image modeling. In order to be able to carry out the optimization plan research, we first need to know the various fac-tors that affect the indoor panoramic modeling system. Integrated a large number of previous research, surveys and experiments, we summarize three evaluation indexes as follows.
1. The Cost of Collecting Panoramic Images
The cost includes time cost and monetary cost. The layout and sequence of panorama sites are decisive to the amount of cost. In short, where to locate and in what turns to locate the panorama sites are crucial to be designed. The more sites in use, the more cost will need.
2. The Experience of Browsing Panoramic Images
The experience includes image clarity, image distortion, the overall stitching effect, interactivity, the brightness and saturation of panoramic images, the speed of scrolling images and the block of images at top or bottom owing to the limits of fisheye lens. The clarity reflects the resolution of panoramic images. We expect a high clarity able to distinguishing the details of interested objec-tives under the extreme condition that the panoramic image is at 100% zooming in or out. Obviously, the clarity and distortion are much related to the shooting distance while the overall stitching effect and interactivity are distance independent .
3. The Effect of Indoor Panoramic Navigation
The superiority of indoor panoramic navigation is the sense of reality and the intuitive. As the routes are linked to the panorama sites, the connectivity of panorama sites is required. Besides, the routes should be optimal to reduce the cost which signifies the importance of the location of panorama sites.
In conclusion, the location distribution optimization of pho-tographing sites is based on the evalution above. Specifical-ly, the coverage and clarity are two fundamental factors influ-encing quality and quantity of panoramic images for modeling. The Distance-Clarity function and the Distance-Buffer function are employed to make sure of the connectivity among the pho-tographing panorama sites. Finally it is practical to obtain high quality panoramic images with less panorama sites and lower cost by means of an automatic location distribution system.
2. MATERIALS AND METHODS
2.1 Distance Clarity Function
Divide the whole indoor area into accessible area (target) and u-naccessible area (obstacle), and study the relationship between panorama quality and shooting distance.
2.1.1 Target-Oriented Distance Clarity Function The Target-Oriented Distance Clarity function FC determines the
optimal distance range between the panoramic site and the object by considering the clarity and distortion of images, depth of field and effective pixels. The clarity of panoramic images greatly affects the user experience. Under particular condition and application, we ought to ensure that the interested objects are recognizable even at the extremum of zooming.
We propose the following four factors to generate the relationship between the photographing distance and imaging effect from the aspect of collecting images.
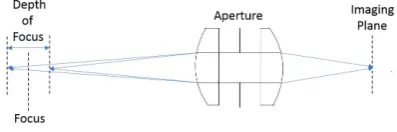
1. Depth of field (DOF)
It can ensure the image clarity with DOF ranging from 0.5m to infinity when using fisheye lens. Nonetheless, shooting distance should be within DOF if fisheye lens is not available.
2. Resolution
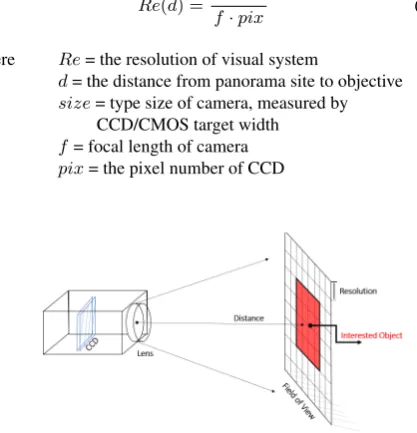
The resolution of images should meet the requirement of iden-tifying objects interested by users. The vast majority of the visual system in accordance with the ratio of the field of view and the number of CCD pixels to determine the resolution. Integrating the calculating of field of view, the equation of visual system res-olution is determined as follows:
Re(d) =d·size
f·pix (1)
where Re= the resolution of visual system
d= the distance from panorama site to objective size= type size of camera, measured by
CCD/CMOS target width f= focal length of camera pix= the pixel number of CCD
Figure 2. Resolution of visual system
3. Distortion:
Distortion of the edge of panoramic image is inevitable. Though users may be accustomed to the distortion, it is still ad-verse to view distorted images. Thus, we are supposed to mini-mize the distortion in the application of panorama modeling, we expect to minimize the distortion panoramic images and adopt the maximum distortion angle ratio relative to the real image as the distortion coefficient. Meantime, given that the distortion influ-ence on panoramic image browsing greatly, parameterγis used to adjust and exaggerate the weight of distortion.
Figure 3. The explanation of distortion
4. Effective pixels
The pixel ratio of the feature image zooming in 100% on the panoramic image on the whole screen. It describes the recogni-tion of the feature image as far as users concerned.
rpix= epix
dpix (2)
where rpix= ratio of effective pixel to device pixel
epix= the effective pixel with 100% zooming dpix= the device pixel
Figure 4. The example of effective pixel
Finally, determine the Distance Clarity function as below:
FC =Re(d)·rpix·(1−α−γ) (3)
where α= the coefficient of distortion γ= accommodation coefficient
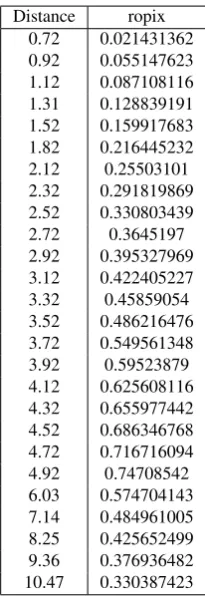
2.1.2 Obstacle-Oriented Distance Effect Function Obvi-ously, the location of the panorama should be as far away as pos-sible from the obstacle, because it will block a lot of information on the panorama. At different distances, the percentage of ob-stacle pixels occupying the device screen is used to measure how serious obstacle affects the panorama effect.
ropix= opix
dpix (4)
where ropix= ratio of obstacle pixel to device pixel epix= the obstacle pixel with 100% zooming dpix= the device pixel
Fe=βdo (5)
where Fe=ropixof different distance
do= distance away from obstacle
β= relationship parameter ofropixand distance
2.2 Distance Buffer Function
Coverage is the visible area from one panorama site. Limited by complicated indoor structure and the varying objective tance, the display of panorama images will be affected. The dis-tance impacts to coverage of panorama site can be demonstrated as Distance-Buffer functionFB(a segmentation function), which
is dependent on Distance Clarity functionFC.
To visualize the coverage area of one certain panorama site, we adopt the concept of buffer. With distance from panorama site to objective increasing, buffers are classified into different fitness value with different colors. The fitness value of buffer, deter-mined by Distance-Clarity function, represents the ability of be-ing a panorama site. The buffer can be generated from the point of interest (POI, inside of accessible area) or the point of obstacle (POO, the center of inaccessible area).
1. Area division
Divide the whole test area into three categories, namely, inside interested area such as rooms, inaccessible area like the columns and accessible area available for panorama sites, which is outside the rooms such as aisles. Then rasterize the test area to adopt raster algebra method.
Figure 5. Original area (up) and the rasterized area (down)
2. Compute accessible buffer (AB)
Accessible buffer is generate with POI as buffer center, insid-e thinsid-e buffinsid-er is thinsid-e arinsid-ea with favourablinsid-e and comprinsid-ehinsid-ensivinsid-e viinsid-ew for shooting panorama images. The color saturation is used to illustrate the fitness value of buffer. As for AB, the fittest value marked with previous result ofFC, describing the ability of
be-ing a panorama site. A favourable panorama site should have a relative high fitness value and cover a larger area.
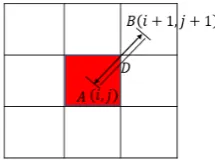
FBA(D) =FC (6)
where D= the distance between certain point and POI FBA= a fitness matrix of the buffer center POI
The function above is to compute the fitness value of accessible buffer of certain POI. The size ofFBAis equivalent to the area
of the buffer. The value of element in matrixFBAis calculated
withDbyFC.
Figure 6. The calculation of fitness value with POI Dis the distance between certain point and POI, the fitness value of the certain point is calculated according to equation 4,
related to the distanceD.
3. Compute inaccessible buffer (IB)
Inaccessible buffer is generate with POO as buffer center, where observation would be impeded if panorama site locates. Obstacles are adverse for us to control the total number of panora-ma sites in test area and moreover, blocks weaken the experience for users browsing the panorama image. In other word, the IB is the area to avoid the panorama sites. The color saturation illus-tration of IB is similar to the AB. The value of IB describes the inadequacy of being a panorama site. A favourable panorama site should escape the impacts of IB as much as possible.
FBI= −
Fe
max(FC)−min(Fe)
(7)
where max(Fe)= the maximum value ofFe
min(Fe)= the minimum value ofFe
FBI= a fitness matrix of the buffer center POO
Figure 7. The calculation of fitness value with POI
4. Superpose AB with IB
To obtain the final fitness evaluation of points in accessible area, we superpose the result of AB with the result of IB. The su-perposed fitness value is the final result of Distance Buffer func-tion. Notice, every point has a fitness value.
Figure 8. The superposition of AB layers and IB layer
FBi(r, c) =F i
BA(r, c) +F i
BI(r, c) (8)
where FB= the final fitness matrix
i = the AB layer or the IB layer
(r,c) = the row and column location of points in layers
2.3 Selection of Panorama Site
1. Locate seed point
Regard all the points in test area as a alternative point setCP0.
Take the point with largest fitness value into the result point set CP, so as to start with the growth of result point.
2. Growth of the result point set
Considering the point with largest fitness value in the rest points ofCP0, take the point with largest fitness value into the
result point setCP likewise. Use raster algebra calculate the
cov-erage of the points inCP and the average value of fitness matrix
of the coverage area. To ensure that the coverage and clarity, a threshold is used to assess the point setCP. Besides, the
cover-age area of points inCP should be equivalent to the area of the
whole test area.
FP =ave(P n
i=1FB(Di)) fPi>T
(9)
where Di= the distance between pointiand POI
FP = the fitness matrix of the point setCP
fPi= the element of fitness matrix
T= the threshold fitness value ave= calculation to average
3. Generate the result point set
When the coverage of point setCP is equivalent to the test
area, and every element satisfy the threshold, the generation of result point setCP
3. EXPERIMENT
3.1 Data
The data we used in the paper is collected by camera Nikon D800 with SIGMA fisheye lens in the panorama test field on April14th
, 2017. In the field, mark the window of interest with red symbol.
3.2 Distance Clarity Experiment
Through the experiment, take general window as the POI and obtain the resolution, distance relationship and the actual image display as shown in the table (select only four values). More experiment data available in APPENDIX.
Dis(m) Re α epix Image
0.566 0.70 75682352 0.122
0.936 1.16 3092460 0.089
2.196 2.71 733806 0.022
4.066 5.02 215140 0
Table 1. Experiment data of Distance Clarity
Equipments are SIGMA fisheye fixation lens and camera Nikon D800. CMOS target width 35.9mm, CCD pixel number 36350000, window size and general indoor construction window size similarity, comparable. Assume that the number of pixel-s of the pixel-screen device upixel-sed by the upixel-ser ipixel-s the more common 1280×720.
Plot the result of experiment, the distance clarity curve is obtained as follows. At the maximum peak is the optimum distance clarity requirement where distance value in X axis is approximately 5.8 meters, in the range of 5 to 6 meters.
Figure 9. Curve of Distance Clarity function
With linear fitting method, we have the fitting equation below, with anSSE= 0.01901, R−square= 0.9846, AdjustedR− square= 0.9752, RM SE= 0.03824.
FC(x) =
9
X
i=1
pix9−i (10)
Estimation 95% confidence bounds p1 −2.15×10⁻⁷ (−3.68×10⁻⁷,−6.14×10⁻⁸) p2 1.54×10−
5
(4.62×10−6,2.61×10−5) p3 −4.46×10−
4
(−7.56×10⁻⁴,−1.36×10⁻⁴)
p4 0.0067 (0.0019, 0.0115)
p5 -0.0550 (-0.0968, -0.0132)
p6 0.2393 (0.0281, 0.4506)
p7 -0.5154 (-1.096, 0.0653)
p8 0.6611 (-0.0957, 1.418)
p9 -0.2612 (-0.5921, 0.0697)
Table 2. Experiment parameters in Distance Clarity function
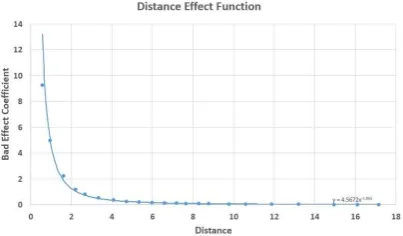
Plot the function ofFelikewise.
Figure 10. Curve of Distance Effect function (−Fe)
obtained by numerical fitting.
Fe(do) = 4.5672·d−o1.865 (11)
Notice that the result is derived from one single image with three independent experiments, so we conclude a distance range of 5 to 6 meters provided that the panoramic images are in the best viewing quality with favourable target recognition. The maxi-mum value of distance is appropriately 5.8 meter.
3.3 Distance Buffer Function
Above all we stimulate a test data with the three categories area. The stimulation result is shown as below.
Figure 11. Division of test area
The circles represent the interested area, the square represents the inaccessible area while the rest area is accessible area
available to locate panorama sites.
Figure 12. The accessible buffer of POI (left), inaccessible buffer of one POO (right)
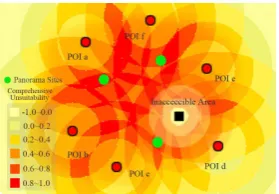
The final buffer result superposed with the result of AB and the result of IB is shown as follows, where the highlight green points are the panorama sites of result.
Figure 13. Final result of panorama sites distribution
4. DISCUSSION
1. Evaluation standard has impacts on the Distance Clarity function
Considering that the Distance Clarity function is established on the basis of evaluation standard, it can be largely influenced by the changes of evaluation parameters. Besides, the researches
on indoor panoramic modeling is not mature enough to carry out the assessment of our evaluation standard given that visual effec-t of panoramic image is large relaeffec-ted effec-to subjeceffec-tive view and effec-the quantitative index need further examining. Thus, a common and widely acknowledged evaluating system of panoramic images is in need. This evaluation should be independent of the camera pa-rameters as much as possible, and the only one factor should be distance.
2. Different and complex indoor structure need testing We divide the test area into accessible area and inaccessible area, which is abstract from the real shopping mall building struc-ture, because the shops usually distributes along the wall side and the whole area is spacious enough for viewing and shopping. But sometimes, the indoor structure could be more complex such as museums, there are couples of sightseeing routes crossing from each other. With more area classified, the Distance Buffer func-tion should be modified to satisfy different circumstances.
3. Further mathematical validation is required
The connectivity of points in AB need further study because the algorithm in use now can not completely avoid the question.
5. CONCLUSION
This article propose a evaluation standard of indoor panoramic modeling, which is the basis of our research on the design of panorama site location. We take the connectivity, clarity and cov-erage into account to carry out a comprehensive determination of the arrangement of panorama site location. The experiment we take to obtain the Distance Clarity function prove effective to instruct the further research on Distance Buffer function. Under the guidance of this relationship, we set up the algorithm to en-sure user with smooth browsing experience, where the panorama sites are as less as possible to reach a full coverage of model area. In this case, we exclude the impacts of POO and ensure the clarity view of POI. Therefore, with the final result, our algorithm prove able to model an area with a lower cost or lower consumption of time, which is much beneficial to the development and spread of indoor panoramic image modeling.
Here, we might as well to look forward to the future. In the ap-proaching era, this technology is likely to exert a profound in-fluence on the modeling of indoor environment. Firstly, with the development of robotics, human will be freed from the dull work of collecting image data. Instead, a kind of automated equipment is able to calculate the most appropriate locations of panorama points accurately. This progress will no doubt save us a lot time and money to a large extent. Then, this method can also be used to rebuild some indoor tourist attractions such as various muse-ums so as to provide a vivid experience for those who have diffi-culty in coming in person. Furthermore, imagine a scene that we enjoy ourselves in the process of visiting malls or museums with the assistance of virtual-reality devices. Not only can we meet our demand like shopping or visiting but also gain a great deal of entertainment in the mean time.
ACKNOWLEDGEMENTS
dedicating to direct us on our study. Thank professor LI Jian-song for being our supervisor and directing us on the application of . Thank professor YAO Jian for providing us with facilities to collect panoramic images. We would also like to show our appreciation to professor LIU Jingbin for giving credit for our algorithm and reviewing the paper. Research is supported by Na-tional Training Program of Innovation and Entrepreneurship for Undergraduates.
REFERENCES
Colbert, M., Bouguet, J.-Y., Beis, J., Childs, S., Filip, D., Vin-cent, L., Lim, J. and Satkin, S., 2012. Building Indoor Multi-Panorama Experiences at Scale. In:SIGGRAPH ‘12: SPECIAL INTEREST GROUP ON COMPUTER GRAPHICS AND
INTER-ACTIVE TECHNIQUES CONFERENCE, SIGGRAPH ’12 ACM
SIGGRAPH 2012 Talks, pp. 24:1–24:1.
Huang, F. and Klette, R., 2010. Stereo panorama acquisition and automatic image disparity adjustment for stereoscopic visualiza-tion.Multimedia Tools and Applications47(3), pp. 353–377.
Lee, I-C.and Tsai, F., 2015. Applications of panoramic images: From 720 degrees panorama to interior 3d models of augmented reality. In: International Archives of the Photogrammetry Re-mote Sensing and Spatial Information Sciences, Kyoto, Japan, Vol. XL-4, W5, pp. 182–192.
Liu, G., Peng, Q. and Bao., H., 2005. Review and prospect of image modeling technology. Journal of Computer Aided Design & Computer Graphics.17(1), pp. 18–27.
Sandnes, F. E., 2016. Communicating panoramic 360 degree immersed experiences: A simple technique for sketching in 3d.
Springer International Publishing Switzerland 2016(9738), p-p. 338–346.
Shuai, L., Lingli, Z., Junsheng, L. and Cai., Q., 2012. The appli-cations and summary of panoramic modeling. In: International Conference on Industrial Control and Electronics Engineering, JiangXi, China, pp. 628–631.
Yinan Shi, Zhenyong Dai, P. L., 2016. Comparison of laser point cloud modeling with traditional modeling method.GEOSPATIAL
INFORMATION14(8), pp. 41–43.
Yinbao Zhang, Weiwei Zhang, X. Z., 2014. A summary of indoor space modeling of buildings.Geomatics World.21(5), pp. 7–12.
Zheng, J. Y. and Shi, M., 2008. Scanning depth of route panora-ma based on stationary blur. International Journal of Computer Vision78(2), pp. 169–186.
APPENDIX
Number Distance (m) α epix F1(V is)
1 0.566 0.122 5682352 0.000698741
2 0.936 0.089 3070044 0.039287538
3 1.606 0.044 1363726 0.156629182
4 2.196 0.022 728856 0.273812806
5 2.666 0.011 500487 0.368619422
6 3.331 0 327024 0.505801124
7 4.066 0 224280 0.617408398
8 4.714 0 167478 0.715805014
9 5.326 0 134478 0.808735151
10 5.961 0 104370 0.615047627
11 6.586 0 85748 0.558289767
12 7.176 0 72471 0.514115416
13 7.626 0 65041 0.490340712
14 8.276 0 54032 0.442064324
15 8.771 0 47560 0.412386936
16 9.756 0 39411 0.380104655
17 10.593 0 34364 0.359862527
18 11.856 0 26625 0.312062619
19 13.201 0 21616 0.282095465
20 14.946 0 17473 0.25817037
21 16.101 0 14287 0.227409099
22 17.136 0 12180 0.206333946
Table 3. Experiment Results ofFC
Distance ropix
Distance ropix 1.13 0.131286295 2.24 0.294047501 3.33 0.459971836 4.44 0.619386107 5.55 0.781845541 6.66 0.576540608 7.77 0.484049225 8.88 0.449957628 9.99 0.384066304 11 0.357159882 12.1 0.324047233 13.2 0.277363292 14.43 0.255348496 15.54 0.25332941 16.65 0.23666098 17.76 0.215673463 18.87 0.206319829 19.98 0.19732173
Table 5. Experiment Results ofFe
Distance ropix 0.72 0.021431362 0.92 0.055147623 1.12 0.087108116 1.31 0.128839191 1.52 0.159917683 1.82 0.216445232 2.12 0.25503101 2.32 0.291819869 2.52 0.330803439 2.72 0.3645197 2.92 0.395327969 3.12 0.422405227 3.32 0.45859054 3.52 0.486216476 3.72 0.549561348 3.92 0.59523879 4.12 0.625608116 4.32 0.655977442 4.52 0.686346768 4.72 0.716716094 4.92 0.74708542 6.03 0.574704143 7.14 0.484961005 8.25 0.425652499 9.36 0.376936482 10.47 0.330387423