Tree Crop Estate Statistics Of Indonesia
STATISTIK PERKEBUNAN INDONESIA
Direktorat Jenderal Perkebunan
Directorate General of Estate Crops
Cashew Nut
2013 - 2015
2013 - 2015
JAMBU METE
STATISTIK PERKEBUNAN INDONESIA 2013-2015
TREE CROP ESTATE STATISTICS OF INDONESIA 2013-2015
Naskah/Manuscript
Direktorat Jenderal Perkebunan,
Directorate General of Estate Crops
Kementerian Pertanian
Ministry of Agriculture
Penasehat/Advisor:
Ir. Irmijati Rachmi Nurbahar, M.Sc.
Penyunting/Senior Editors:
Ir. Ida Yunia Soependi, M.Sc.
Yanuar Arianto, STP
Staf Penyunting/Editorial Staffs:
Widya Khonik Zuraina, S.Si
Eko Pudjianto, S.Kom
Asep Udin, S.Kom
Neny Kurniawati, S.Si
Susilo Novianto Damarjati, A.Md.
Diterbitkan oleh/Published by
Direktorat Jenderal Perkebunan
Directorate General of Estate Crops
Jl. Harsono RM No. 3 Gedung C
Pasar Minggu - Jakarta 12550
Kotak Pos 1060/Jkt,10010
Tlp. : 021 - 7815380 - 4
Fax. : 021 - 715486 - 7815586
Jakarta, Desember 2014
K
omoditas perkebunan merupakan andalan bagi pendapatan
nasional dan devisa negara Indonesia, yang dapat dilihat dari nilai
ekspor komoditas perkebunan, pada Tahun 2013 total ekspor
perkebunan mencapai US$ 29,476 milyar atau setara dengan Rp. 353,713
triliun (asumsi 1 US$=Rp.12.000). Kontribusi sub sektor perkebunan
terhadap perekonomian nasional semakin meningkat dan diharapkan
dapat memperkokoh pembangunan perkebunan secara menyeluruh. Agar
informasi perkebunan dapat tersebar secara luas, setiap tahun diterbitkan
Buku Statistik Perkebunan Indonesia yang menyajikan data secara handal,
sahih, objektif, mutakhir dan konsisten.
S
tatistik Perkebunan Indonesia Tahun 2013-2015 menyajikan data luas areal, produksi,
produktivitas baik secara nasional maupun provinsi menurut status pengusahaannya
yaitu Perkebunan Rakyat, Perkebunan Besar Negara dan Perkebunan Besar Swasta.
Penyajian data juga dilengkapi dengan data ekspor dan impor untuk masing-masing komoditas
yang mencakup negara tujuan/asal, volume dan nilai, harga di dalam dan luar negeri serta untuk
beberapa komoditas tertentu disajikan data keseimbangan dunia.
D
ata yang disajikan merupakan hasil sinkronisasi dan validasi data statistik perkebunan
2013-2015 yang dilaksanakan secara berjenjang dari tingkat kabupaten sampai tingkat
nasional dengan mengacu pada Pedoman Pelaksanaan Pengelolaan Data Komoditas
Perkebunan yang diterbitkan Direktorat Jenderal Perkebunan. Data tersebut meliputi angka
tetap (ATAP) Tahun 2013, angka sementara (ASEM) Tahun 2014 dan angka estimasi (AESTI)
Tahun 2015. Data yang disajikan bersumber dari data primer yang dikumpulkan dari dinas yang
membidangi perkebunan di provinsi dan data sekunder yang dikutip dari data yang diterbitkan
oleh Badan Pusat Statistik (BPS), Kementerian Perindustrian, Kementerian Perdagangan, Bank
Indonesia, dan publikasi yang diterbitkan oleh asosiasi-asosiasi perkebunan baik dalam maupun
luar negeri.
B
uku ini dapat diterbitkan, atas dukungan dan kerjasama yang baik dari berbagai pihak.
Untuk itu, pada kesempatan ini, kami mengucapkan terima kasih atas dukungan dan
kerjasama tersebut. Kami menyadari bahwa buku yang diterbitkan ini masih jauh dari
sempurna. Untuk itu, kritik dan saran yang sifatnya membangun sangat diharapkan sebagai
bahan masukan dalam perbaikan penerbitan di masa datang.
S
emoga apa yang disajikan dalam buku ini dapat digunakan oleh berbagai kalangan dan
para pengguna data serta dapat dijadikan acuan dalam pengambilan kebijakan.
Kata
Pengantar
Jakarta, Desember 2014
T
he estate crop commodities is the mainstay of national income
and Indonesia’s foreign exchange wich can be seen from export
value of the estate crop commodities. In 2013, total export of the
estate crops was US $ 29,476 billion or equivalent to Rp. 353,713 trillion
(assumed 1 US $ = Rp. 12.000). The contribution of estate crops sub sector
to the national economy tends to increase from year to year and expected
to strengthen overall national development. Furthermore, to spread
estate crops information widely, The Estate Crop Statistics of Indonesia is
published every year that presented reliable, valid, objective, up to date
and consistent data.
T
he Estate Crop Statistics of Indonesia 2013-2015 presents area, production and
productivity data by province and district level of smallhoder, government and private
estates. It is completed by volume, value of both export and import data, price data for
domestic and world market and also world balance data for some commodities.
D
ata presented are the result of synchronization and validation of the estate crop
statistical data 2013-2015 which are held hierarchical from the district to the national
level by using guidelines of data management of estate crop commodities. In this edition,
data of the 2013 are presented as fixed data, data of the 2013 are the preliminary data and data
of the 2014 are the estimation. The primary data were collected from the Estate Crops Province
Level and the secondary data were collected from related instution such as Board of Central
Statistics, Ministry of Industry, Ministry of Trade, Central Bank of Indonesia, the publication of
Estate Commodity Associations and others.
I
t would have been impossible to compile this book without substantional support and
contribution from many instutions. At this opportunity, we would like to thank all for their
support and cooperation. We realize that the publication still needs further improvement.
We would greatly appreciate comments and suggestions for future improvement.
H
opefully this publication will have high values for users and references for policy
makers.
Preface
Jakarta, December 2014
DIRECTOR GENERAL OF ESTATE CROPS
Ir. Gamal Nasir, MS
Kata Pengantar
Preface
...
iii
Daftar Isi
Contents
...
v
Daftar Gambar
List of Figures...
vi
Daftar Tabel
List of Tables ...
vii
Daftar
Isi
Daftar
Gambar
List of Figures
Gambar 1. Perbandingan Luas Areal dan Produksi Jambu Mete Menurut
Status Pengusahaan Tahun 2013
Figure
Area and Production Comparison Graph of Cashew Nut by Farming
Category, 2013 ...
1
Gambar 2. Perkembangan Luas Areal, Produksi, Produktivitas dan Volume
Ekspor-Impor Jambu Mete Tahun 2009 - 2013
Figure
Area, Production, Productivity and Export-Import Volume Trend
Tabel 1.
Luas Areal dan Produksi Jambu Mete Menurut Status Pengusahaan
Tahun 1975 - 2015
Table
Area and Cashew Nut Production by Farming Category, 1975 - 2015 ..
3
Tabel 2.
Volume dan Nilai Ekspor – Impor Jambu Mete Tahun 1975 - 2013
Table
Export - Import Volume and Value of Cashew Nut, 1975 - 2013 ...
4
Tabel 3.
Luas Areal dan Produksi Jambu Mete Menurut Provinsi dan
Status Pengusahaan Tahun 2013
Table
Area and Cashew Nut Production by Province and Farming
Category, 2013 ...
5
Tabel 4.
Luas Areal dan Produksi Jambu Mete Menurut Provinsi dan
Status Pengusahaan Tahun 2014 *)
Table
Area and Cashew Nut Production by Province and Farming
Category, 2014 *) ...
6
Tabel 5.
Luas Areal dan Produksi Jambu Mete Menurut Provinsi dan
Status Pengusahaan Tahun 2015 **)
Table
Area and Cashew Nut Production by Province and Farming
Category, 2015 **) ...
7
Tabel 6.
Luas Tanaman Menghasilkan dan Produksi Jambu Mete Menurut
Provinsi dan Status Pengusahaan Tahun 2013
Table
Mature Area and Cashew Nut Production by Province and Farming
Category, 2013 ...
8
Tabel 7.
Luas Tanaman Menghasilkan dan Produksi Jambu Mete Menurut
Provinsi dan Status Pengusahaan Tahun 2014 *)
Table
Mature Area and Cashew Nut Production by Province and Farming
Category, 2014 *) ...
9
Tabel 8.
Luas Tanaman Menghasilkan dan Produksi Jambu Mete Menurut
Provinsi dan Status Pengusahaan Tahun 2015 **)
Table
Mature Area and Cashew Nut Production by Province and Farming
Category, 2015 **) ...
10
Tabel 9.
Luas Areal dan Produksi Jambu Mete Perkebunan Rakyat,
Besar Negara dan Besar Swasta (PR + PBN + PBS) Menurut
Provinsi dan Keadaan Tanaman Tahun 2013
Table
Area and Cashew Nut Production of Smallholder, Government and
Daftar
Tabel
Tabel 10.
Luas Areal dan Produksi Jambu Mete Perkebunan Rakyat,
Besar Negara dan Besar Swasta (PR + PBN + PBS) Menurut
Provinsi dan Keadaan Tanaman Tahun 2014 *)
Table
Area and Cashew Nut Production of Smallholder, Government and
Private Estate by Province and Tree Crop Classification, 2014 *) ...
12
Tabel 11.
Luas Areal dan Produksi Jambu Mete Perkebunan Rakyat,
Besar Negara dan Besar Swasta (PR + PBN + PBS) Menurut
Provinsi dan Keadaan Tanaman Tahun 2015 **)
Table
Area and Cashew Nut Production of Smallholder, Government and
Private Estate by Province and Tree Crop Classification, 2015 **) ...
13
Tabel 12.
Luas Areal dan Produksi Jambu Mete Perkebunan Rakyat Menurut
Provinsi dan Keadaan Tanaman Tahun 2013
Table
Area and Cashew Nut Production of Smallholder by Province and
Tree Crop Classification, 2013 ...
14
Tabel 13.
Luas Areal dan Produksi Jambu Mete Perkebunan Rakyat Menurut
Kabupaten dan Keadaan Tanaman Tahun 2013
Table
Area and Cashew Nut Production of Smallholder by District and
Tree Crop Classification, 2013 ...
15
Tabel 14.
Luas Areal dan Produksi Jambu Mete Perkebunan Rakyat Menurut
Provinsi dan Keadaan Tanaman Tahun 2014 *)
Table
Area and Cashew Nut Production of Smallholder by Province and
Tree Crop Classification, 2014 *) ...
23
Tabel 15.
Luas Areal dan Produksi Jambu Mete Perkebunan Rakyat Menurut
Provinsi dan Keadaan Tanaman Tahun 2015 **)
Table
Area and Cashew Nut Production of Smallholder by Province and
Tree Crop Classification, 2015 **) ...
24
Tabel 16.
Luas Areal dan Produksi Jambu Mete Perkebunan Besar Swasta
Menurut Provinsi dan Keadaan Tanaman Tahun 2013
Table
Area and Cashew Nut Production of Private Estate by Province and
Tree Crop Classification, 2013 ...
25
Tabel 17.
Luas Areal dan Produksi Jambu Mete Perkebunan Besar Swasta
Menurut Kabupaten dan Keadaan Tanaman Tahun 2013
Table
Area and Cashew Nut Production of Private Estate by District and
Tree Crop Classification, 2013 ...
26
Tabel 18.
Luas Areal dan Produksi Jambu Mete Perkebunan Besar Swasta
Menurut Provinsi dan Keadaan Tanaman Tahun 2014 *)
Table
Area and Cashew Nut Production of Private Estate by Province and
Tabel 19.
Luas Areal dan Produksi Jambu Mete Perkebunan Besar Swasta
Menurut Provinsi dan Keadaan Tanaman Tahun 2015 **)
Table
Area and Cashew Nut Production of Private Estate by Province and
Tree Crop Classification, 2015 **) ...
28
Tabel 20.
Volume dan Nilai Ekspor-Impor Jambu Mete Menurut
Negara Tujuan dan Asal Tahun 2013
Table
Export-Import Volume and Value of Cashew Nut by Destination and
Origin Country, 2013 ...
29
Tabel 21.
Perkembangan Harga Rata-rata Tahunan Jambu Mete di Pasar
Domestik Tahun 2007-2013
Table
Annually Average Price Trend of Cashew Nut in Domestic
Gambar 1. Perbandingan Luas Areal dan Produksi Jambu Mete Menurut Status Pengusahaan
Tahun 2013
Gambar 2. Perkembangan Luas Areal, Produksi, Produktivitas dan Volume Ekspor-Impor
Jambu Mete Tahun 2009 - 2013
Figure
Area, Production, Productivity and Export-Import Volume Trend Graph of
Cashew Nut, 2009 - 2013
Tabel 1.
Luas Areal dan Produksi Jambu Mete Menurut Status Pengusahaan Tahun 1975-2015
Table
Area and Cashew Nut Production by Farming Category, 1975 – 2015
Tahun/
Year
Luas Areal/Area (Ha)
Jumlah/
Total
Produksi/Production (Ton)
Jumlah/
Total
PR/
Smallholder
Government
PBN/
Private
PBS/
Smallholder
PR/
Government
PBN/
Private
PBS/
1975
1976
1977
1978
1979
1980
1981
1982
1983
1984
1985
1986
1987
1988
1989
1990
1991
1992
1993
1994
1995
1996
1997
1998
1999
2000
2001
2002
2003
2004
2005
2006
2007
2008
2009
2010
2011
2012
2013
2014*)
2015**)
56.643
68.504
71.238
81.878
85.478
114.934
136.631
185.192
187.535
195.789
197.563
223.270
213.045
252.245
268.222
273.293
352.735
374.605
394.522
409.755
455.920
484.357
490.074
521.695
547.724
551.442
558.784
568.796
565.446
559.633
572.959
568.944
570.156
572.727
571.850
569.910
574.821
574.900
553.166
550.363
549.827
1.696
8.798
687
570
628
679
637
1.152
4.630
-
-
-
-
-
-
-
-
-
-
-
-
-
-
-
-
-
-
-
-
-
-
-
-
-
-
-
-
-
-
-
-
52
52
-
63
1.435
1.195
1.195
1.198
1.398
715
115
1.145
1.201
1.532
1.416
1.928
2.138
3.684
6.071
8.870
8.904
8.593
9.205
9.295
9.858
9.868
1.028
1.128
7.835
6.676
6.691
253
253
994
1.020
1.020
1.020
1.020
1.150
1.149
1.130
58.391
77.354
71.925
82.511
87.541
116.808
138.463
187.542
193.563
196.504
197.678
224.415
214.246
253.777
269.638
275.221
354.873
378.289
400.593
418.625
464.824
492.950
499.279
530.990
557.582
561.310
559.812
569.924
573.281
566.309
579.650
569.197
570.409
573.721
572.870
570.930
575.841
575.920
554.315
551.512
550.956
9.109
7.101
7.360
8.795
9.762
9.070
11.441
16.830
18.040
19.395
21.091
22.454
23.975
23.231
27.912
29.825
57.175
62.121
69.671
71.953
85.616
67.079
73.158
86.924
89.530
69.488
91.220
109.945
106.698
130.768
134.808
149.015
146.025
156.435
147.273
115.019
114.615
116.737
115.969
115.826
115.540
14
5
10
5
2
4
3
-
1
-
-
-
-
-
-
-
-
-
-
-
-
-
-
-
-
-
-
-
-
-
-
-
-
-
-
-
-
-
-
-
-
-
70
-
-
-
-
-
-
6
16
23
61
67
74
78
82
72
96
80
124
379
597
574
772
774
439
366
287
234
252
262
123
123
217
130
130
174
178
144
174
174
9.123
7.176
7.370
8.800
9.764
9.074
11.444
16.830
18.047
19.411
21.114
22.515
24.042
23.305
27.990
29.907
57.247
62.217
69.751
72.077
85.995
67.676
73.732
87.696
90.304
69.927
91.586
110.232
106.932
131.020
135.070
149.138
146.148
156.652
147.403
115.149
114.789
116.915
116.113
116.000
115.715
DIREKTORAT JENDERAL PERKEBUNAN
Directorate General of Estate Crops
Keterangan/Note :
1. Angka Sementara/Preliminary*)
2. Angka Estimasi/Estimation**)
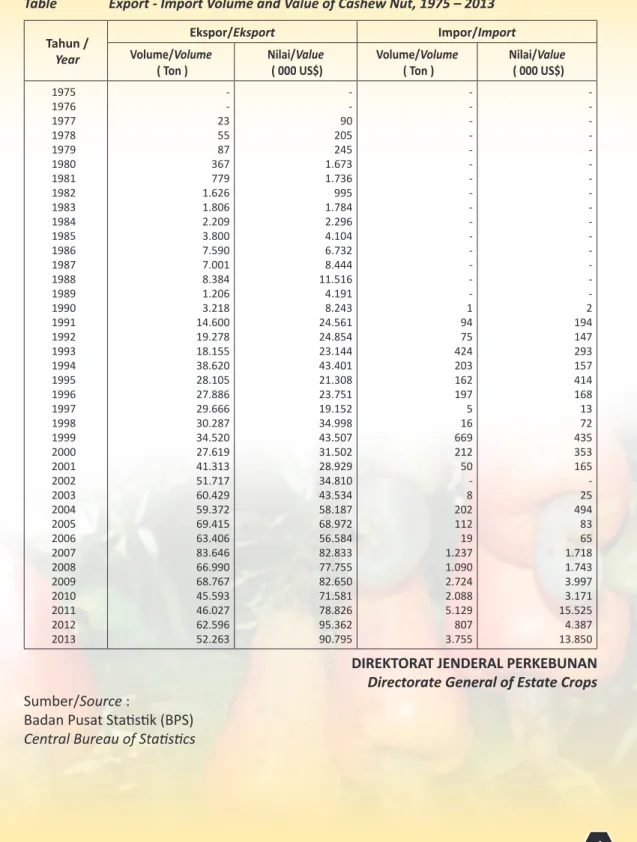
Tabel 2.
Volume dan Nilai Ekspor – Impor Jambu Mete Tahun 1975 - 2013
Table
Export - Import Volume and Value of Cashew Nut, 1975 – 2013
Tahun /
Year
Ekspor/Eksport
Impor/Import
Volume/Volume
( Ton )
Nilai/Value
( 000 US$)
Volume/Volume
( Ton )
Nilai/Value
( 000 US$)
1975
1976
1977
1978
1979
1980
1981
1982
1983
1984
1985
1986
1987
1988
1989
1990
1991
1992
1993
1994
1995
1996
1997
1998
1999
2000
2001
2002
2003
2004
2005
2006
2007
2008
2009
2010
2011
2012
2013
-
-
23
55
87
367
779
1.626
1.806
2.209
3.800
7.590
7.001
8.384
1.206
3.218
14.600
19.278
18.155
38.620
28.105
27.886
29.666
30.287
34.520
27.619
41.313
51.717
60.429
59.372
69.415
63.406
83.646
66.990
68.767
45.593
46.027
62.596
52.263
-
-
90
205
245
1.673
1.736
995
1.784
2.296
4.104
6.732
8.444
11.516
4.191
8.243
24.561
24.854
23.144
43.401
21.308
23.751
19.152
34.998
43.507
31.502
28.929
34.810
43.534
58.187
68.972
56.584
82.833
77.755
82.650
71.581
78.826
95.362
90.795
-
-
-
-
-
-
-
-
-
-
-
-
-
-
-
1
94
75
424
203
162
197
5
16
669
212
50
-
8
202
112
19
1.237
1.090
2.724
2.088
5.129
807
3.755
-
-
-
-
-
-
-
-
-
-
-
-
-
-
-
2
194
147
293
157
414
168
13
72
435
353
165
-
25
494
83
65
1.718
1.743
3.997
3.171
15.525
4.387
13.850
DIREKTORAT JENDERAL PERKEBUNAN
Directorate General of Estate Crops
Sumber/Source :
Badan Pusat Statistik (BPS)
Tabel 3.
Luas Areal dan Produksi Jambu Mete Menurut Provinsi dan Status Pengusahaan
Tahun 2013
Table
Area and Cashew Nut Production by Province and Farming Category, 2013
No.
Provinsi/Province
Perkebunan Rakyat
Smallholder
Perkebunan Negara
Government
Perkebunan Swasta
Private
Jumlah/Total
Luas/
Area
(Ha)
Produksi
Production
(Ton)
Luas/
Area
(Ha)
Produksi
Production
(Ton)
Luas/
Area
(Ha)
Produksi
Production
(Ton)
Luas/
Area
(Ha)
Produksi
Production
(Ton)
1. 2. 3. 4. 5. 6. 7. 8. 9. 10. ACEH SUMATERA UTARA SUMATERA BARAT R I A U KEPULAUAN RIAU J A M B I SUMATERA SELATAN KEP. BANGKA BELITUNG BENGKULU LAMPUNG 106 17 - - 15 - - 49 - 69 0 2 - - 1 - - 3 - 13 - - - - - - - - - - - - - - - - - - - - - - - - - - - - - - - - - - - - - - - - 106 17 - - 15 - - 49 - 69 0 2 - - 1 - - 3 - 13 WILAYAH SUMATERA 256 19 - - - - 256 19 11. 12. 13. 14. 15. 16. DKI. JAKARTA JAWA BARAT BANTEN JAWA TENGAH D.I. YOGYAKARTA JAWA TIMUR - 235 12 25.427 15.014 52.243 - 36 2 8.591 261 12.645 - - - - - - - - - - - - - - - - - - - - - - - 235 12 25.427 15.014 52.243 - 36 2 8.591 261 12.645 WILAYAH JAWA 92.931 21.535 - - - - 92.931 21.535 17. 18. 19. B A L INUSA TENGGARA BARAT NUSA TENGGARA TIMUR
8.587 57.086 180.567 3.405 13.212 39.360 - - - - - - 171 - 75 102 - 35 8.758 57.086 180.642 3.507 13.212 39.395
WILAYAH NUSA TENGGARA & BALI 246.240 55.976 - - 246 137 246.485 56.113
20. 21. 22. 23. KALIMANTAN BARAT KALIMANTAN TENGAH KALIMANTAN SELATAN KALIMANTAN TIMUR - 795 95 56 - 61 49 9 - - - - - - - - - - - - - - - - 795 95 56 - 61 49 9 WILAYAH KALIMANTAN 946 118 - - - - 946 118 24. 25. 26. 27. 28. 29. SULAWESI UTARA GORONTALO SULAWESI TENGAH SULAWESI SELATAN SULAWESI BARAT SULAWESI TENGGARA 223 2.954 16.358 59.636 1.114 117.677 20 570 2.992 16.576 203 15.087 - - - - - - - - - - - - 8 - - 896 - - 2 - - 6 - - 230 2.954 16.358 60.532 1.114 117.677 22 570 2.992 16.582 203 15.087 WILAYAH SULAWESI 197.962 35.448 - - 904 7 198.866 35.456 30. 31. 32. 33. M A L U K U MALUKU UTARA PAPUA PAPUA BARAT 3.634 5.969 4.832 397 944 1.317 573 39 - - - - - - - - - - - - - - - - 3.634 5.969 4.832 397 944 1.317 573 39
WILAYAH MALUKU & PAPUA 14.831 2.871 - - - - 14.831 2.871 I N D O N E S I A 553.166 115.969 - - 1.150 144 554.315 116.113
DIREKTORAT JENDERAL PERKEBUNAN
Directorate General of Estate Crops
Keterangan/Note :
1. Angka Tetap/Fixed
Tabel 4.
Luas Areal dan Produksi Jambu Mete Menurut Provinsi dan Status Pengusahaan
Tahun 2014 *)
Table
Area and Cashew Nut Production by Province and Farming Category, 2014 *)
No.
Provinsi/Province
Perkebunan Rakyat
Smallholder
Perkebunan Negara
Government
Perkebunan Swasta
Private
Jumlah/Total
Luas/
Area
(Ha)
Produksi
Production
(Ton)
Luas/
Area
(Ha)
Produksi
Production
(Ton)
Luas/
Area
(Ha)
Produksi
Production
(Ton)
Luas/
Area
(Ha)
Produksi
Production
(Ton)
1. 2. 3. 4. 5. 6. 7. 8. 9. 10. ACEH SUMATERA UTARA SUMATERA BARAT R I A U KEPULAUAN RIAU J A M B I SUMATERA SELATAN KEP. BANGKA BELITUNG BENGKULU LAMPUNG 107 18 - - 16 - - 49 - 70 1 2 - - 1 - - 4 - 14 - - - - - - - - - - - - - - - - - - - - - - - - - - - - - - - - - - - - - - - - 107 18 - - 16 - - 49 - 70 1 2 - - 1 - - 4 - 14 WILAYAH SUMATERA 260 22 - - - - 260 22 11. 12. 13. 14. 15. 16. DKI. JAKARTA JAWA BARAT BANTEN JAWA TENGAH D.I. YOGYAKARTA JAWA TIMUR - 235 13 25.425 12.010 52.247 - 35 1 8.572 200 12.637 - - - - - - - - - - - - - - - - - - - - - - - 235 13 25.425 12.010 52.247 - 35 1 8.572 200 12.637 WILAYAH JAWA 89.930 21.445 - - - - 89.930 21.445 17. 18. 19. B A L INUSA TENGGARA BARAT NUSA TENGGARA TIMUR
8.588 57.113 180.677 3.422 13.200 39.260 - - - - - - 171 - 75 102 - 35 8.759 57.113 180.752 3.524 13.200 39.295
WILAYAH NUSA TENGGARA & BALI 246.379 55.882 - - 245 137 246.624 56.019
20. 21. 22. 23. 24. KALIMANTAN BARAT KALIMANTAN TENGAH KALIMANTAN SELATAN KALIMANTAN TIMUR KALIMANTAN UTARA - 800 96 57 - - 62 49 10 - - - - -- - - - -- - - - - - - - -- - 800 96 57 - - 62 49 10 - WILAYAH KALIMANTAN 953 120 - - - - 953 120 25. 26. 27. 28. 29. 30. SULAWESI UTARA GORONTALO SULAWESI TENGAH SULAWESI SELATAN SULAWESI BARAT SULAWESI TENGGARA 223 2.956 16.369 59.640 1.115 117.702 20 573 3.007 16.526 205 15.148 - - - - - - - - - - - - 8 - - 896 - - 1 - - 36 - - 230 2.956 16.369 60.536 1.115 117.702 21 573 3.007 16.562 205 15.148 WILAYAH SULAWESI 198.003 35.479 - - 904 37 198.907 35.516 31. 32. 33. 34. M A L U K U MALUKU UTARA PAPUA PAPUA BARAT 3.635 5.972 4.833 399 946 1.322 572 38 - - - - - - - - - - - - - - - - 3.635 5.972 4.833 399 946 1.322 572 38
WILAYAH MALUKU & PAPUA 14.838 2.878 - - - - 14.838 2.878 I N D O N E S I A 550.363 115.826 - - 1.149 174 551.512 116.000
DIREKTORAT JENDERAL PERKEBUNAN
Directorate General of Estate Crops
Tabel 5.
Luas Areal dan Produksi Jambu Mete Menurut Provinsi dan Status Pengusahaan
Tahun 2015 **)
Table
Area and Cashew Nut Production by Province and Farming Category, 2015 **)
No.
Provinsi/Province
Perkebunan Rakyat
Smallholder
Perkebunan Negara
Government
Perkebunan Swasta
Private
Jumlah/Total
Luas/
Area
(Ha)
Produksi
Production
(Ton)
Luas/
Area
(Ha)
Produksi
Production
(Ton)
Luas/
Area
(Ha)
Produksi
Production
(Ton)
Luas/
Area
(Ha)
Produksi
Production
(Ton)
1. 2. 3. 4. 5. 6. 7. 8. 9. 10. ACEH SUMATERA UTARA SUMATERA BARAT R I A U KEPULAUAN RIAU J A M B I SUMATERA SELATAN KEP. BANGKA BELITUNG BENGKULU LAMPUNG 107 18 - - 16 - - 49 - 70 1 2 - - 1 - - 4 - 14 - - - - - - - - - - - - - - - - - - - - - - - - - - - - - - - - - - - - - - - - 107 18 - - 16 - - 49 - 70 1 2 - - 1 - - 4 - 14 WILAYAH SUMATERA 260 22 - - - - 260 22 11. 12. 13. 14. 15. 16. DKI. JAKARTA JAWA BARAT BANTEN JAWA TENGAH D.I. YOGYAKARTA JAWA TIMUR - 235 13 25.440 10.810 52.219 - 35 1 8.568 189 12.530 - - - - - - - - - - - - - - - - - - - - - - - 235 13 25.440 10.810 52.219 - 35 1 8.568 189 12.530 WILAYAH JAWA 88.717 21.323 - - - - 88.717 21.323 17. 18. 19. B A L INUSA TENGGARA BARAT NUSA TENGGARA TIMUR
8.591 57.240 181.114 3.420 13.105 39.155 - - - - - - 171 - 75 102 - 35 8.762 57.240 181.188 3.522 13.105 39.190
WILAYAH NUSA TENGGARA & BALI 246.944 55.680 - - 246 137 247.190 55.817
20. 21. 22. 23. 24. KALIMANTAN BARAT KALIMANTAN TENGAH KALIMANTAN SELATAN KALIMANTAN TIMUR KALIMANTAN UTARA - 804 96 57 - - 62 49 11 - - - - -- - - - - - - - -- - - - -- - 804 96 57 - - 62 49 11 - WILAYAH KALIMANTAN 957 121 - - - - 957 121 25. 26. 27. 28. 29. 30. SULAWESI UTARA GORONTALO SULAWESI TENGAH SULAWESI SELATAN SULAWESI BARAT SULAWESI TENGGARA 223 2.960 16.397 59.647 1.114 117.749 21 576 3.023 16.453 206 15.225 - - - - - - - - - - - - 8 - - 876 - - 1 - - 36 - - 231 2.960 16.397 60.523 1.114 117.749 22 576 3.023 16.489 206 15.225 WILAYAH SULAWESI 198.090 35.504 - - 884 37 198.974 35.541 31. 32. 33. 34. M A L U K U MALUKU UTARA PAPUA PAPUA BARAT 3.641 5.981 4.836 399 951 1.329 573 37 - - - - - - - - - - - - - - - - 3.641 5.981 4.836 399 951 1.329 573 37
WILAYAH MALUKU & PAPUA 14.858 2.891 - - - - 14.858 2.891 I N D O N E S I A 549.827 115.540 - - 1.130 174 550.956 115.715
DIREKTORAT JENDERAL PERKEBUNAN
Directorate General of Estate Crops
Keterangan/Note :
1. Angka Estimasi/Estimation**)
Tabel 6.
Luas Tanaman Menghasilkan dan Produksi Jambu Mete Menurut Provinsi dan
Status Pengusahaan Tahun 2013
Table
Mature Area and Cashew Nut Production by Province and Farming Category, 2013
No.
Provinsi/Province
Perkebunan Rakyat
Smallholder
Perkebunan Negara
Government
Perkebunan Swasta
Private
Jumlah/Total
Luas TM/
Mature
(Ha)
Produksi
Production
(Ton)
Luas TM/
Mature
(Ha)
Produksi
Production
(Ton)
Luas TM/
Mature
(Ha)
Produksi
Production
(Ton)
Luas TM/
Mature
(Ha)
Produksi
Production
(Ton)
1. 2. 3. 4. 5. 6. 7. 8. 9. 10. ACEH SUMATERA UTARA SUMATERA BARAT R I A U KEPULAUAN RIAU J A M B I SUMATERA SELATAN KEP. BANGKA BELITUNG BENGKULU LAMPUNG 7 2 - - 7 - - 14 - 56 0 2 - - 1 - - 3 - 13 - - - - - - - - - - - - - - - - - - - - - - - - - - - - - - - - - - - - - - - - 7 2 - - 7 - - 14 - 56 0 2 - - 1 - - 3 - 13 WILAYAH SUMATERA 86 19 - - - - 86 19 11. 12. 13. 14. 15. 16. DKI. JAKARTA JAWA BARAT BANTEN JAWA TENGAH D.I. YOGYAKARTA JAWA TIMUR - 111 9 17.948 4.342 20.232 - 36 2 8.591 261 12.645 - - - - - - - - - - - - - - - - - - - - - - - 111 9 17.948 4.342 20.232 - 36 2 8.591 261 12.645 WILAYAH JAWA 42.642 21.535 - - - - 42.642 21.535 17. 18. 19. B A L INUSA TENGGARA BARAT NUSA TENGGARA TIMUR
8.236 35.616 83.132 3.405 13.212 39.360 - - - - - - 161 - 74 102 - 35 8.397 35.616 83.206 3.507 13.212 39.395
WILAYAH NUSA TENGGARA & BALI 126.984 55.976 - - 235 137 127.219 56.113
20. 21. 22. 23. KALIMANTAN BARAT KALIMANTAN TENGAH KALIMANTAN SELATAN KALIMANTAN TIMUR - 128 79 29 - 61 49 9 - - - - - - - - - - - - - - - - 128 79 29 - 61 49 9 WILAYAH KALIMANTAN 236 118 - - - - 236 118 24. 25. 26. 27. 28. 29. SULAWESI UTARA GORONTALO SULAWESI TENGAH SULAWESI SELATAN SULAWESI BARAT SULAWESI TENGGARA 95 1.850 9.002 44.675 686 87.027 20 570 2.992 16.576 203 15.087 - - - - - - - - - - - - 4 - - 535 - - 2 - - 6 - - 99 1.850 9.002 45.210 686 87.027 22 570 2.992 16.582 203 15.087 WILAYAH SULAWESI 143.335 35.448 - - 539 7 143.874 35.456 30. 31. 32. 33. M A L U K U MALUKU UTARA PAPUA PAPUA BARAT 1.608 4.381 2.805 237 944 1.317 573 39 - - - - - - - - - - - - - - - - 1.608 4.381 2.805 237 944 1.317 573 39
WILAYAH MALUKU & PAPUA 9.031 2.871 - - - - 9.031 2.871 I N D O N E S I A 322.315 115.969 - - 773 144 323.089 116.113
DIREKTORAT JENDERAL PERKEBUNAN
Directorate General of Estate Crops
Tabel 7.
Luas Tanaman Menghasilkan dan Produksi Jambu Mete Menurut Provinsi dan
Status Pengusahaan Tahun 2014 *)
Table
Mature Area and Cashew Nut Production by Province and Farming Category, 2014 *)
No.
Provinsi/Province
Perkebunan Rakyat
Smallholder
Perkebunan Negara
Government
Perkebunan Swasta
Private
Jumlah/Total
Luas TM/
Mature
(Ha)
Produksi
Production
(Ton)
Luas TM/
Mature
(Ha)
Produksi
Production
(Ton)
Luas TM/
Mature
(Ha)
Produksi
Production
(Ton)
Luas TM/
Mature
(Ha)
Produksi
Production
(Ton)
1. 2. 3. 4. 5. 6. 7. 8. 9. 10. ACEH SUMATERA UTARA SUMATERA BARAT R I A U KEPULAUAN RIAU J A M B I SUMATERA SELATAN KEP. BANGKA BELITUNG BENGKULU LAMPUNG 8 2 - - 8 - - 14 - 56 1 2 - - 1 - - 4 - 14 - - - - - - - - - - - - - - - - - - - - - - - - - - - - - - - - - - - - - - - - 8 2 - - 8 - - 14 - 56 1 2 - - 1 - - 4 - 14 WILAYAH SUMATERA 88 22 - - - - 88 22 11. 12. 13. 14. 15. 16. DKI. JAKARTA JAWA BARAT BANTEN JAWA TENGAH D.I. YOGYAKARTA JAWA TIMUR - 111 9 17.950 3.315 21.090 - 35 1 8.572 200 12.637 - - - - - - - - - - - - - - - - - - - - - - - 111 9 17.950 3.315 21.090 - 35 1 8.572 200 12.637 WILAYAH JAWA 42.475 21.445 - - - - 42.475 21.445 17. 18. 19. B A L INUSA TENGGARA BARAT NUSA TENGGARA TIMUR
8.236 35.632 83.208 3.422 13.200 39.260 - - - - - - 161 - 74 102 - 35 8.397 35.632 83.282 3.524 13.200 39.295
WILAYAH NUSA TENGGARA & BALI 127.077 55.882 - - 235 137 127.312 56.019
20. 21. 22. 23. 24. KALIMANTAN BARAT KALIMANTAN TENGAH KALIMANTAN SELATAN KALIMANTAN TIMUR KALIMANTAN UTARA - 129 79 29 - - 62 49 10 - - - - - - - - - - - - - - - - - - 129 79 29 - - 62 49 10 - WILAYAH KALIMANTAN 237 120 - - - - 237 120 25. 26. 27. 28. 29. 30. SULAWESI UTARA GORONTALO SULAWESI TENGAH SULAWESI SELATAN SULAWESI BARAT SULAWESI TENGGARA 95 1.851 9.006 44.684 686 87.038 20 573 3.007 16.526 205 15.148 - - - - - - - - - - - - 4 - - 534 - - 1 - - 36 - - 99 1.851 9.006 45.219 686 87.038 21 573 3.007 16.562 205 15.148 WILAYAH SULAWESI 143.361 35.479 - - 538 37 143.899 35.516 31. 32. 33. 34. M A L U K U MALUKU UTARA PAPUA PAPUA BARAT 1.609 4.383 2.806 237 946 1.322 572 38 - - - - - - - - - - - - - - - - 1.609 4.383 2.806 237 946 1.322 572 38
WILAYAH MALUKU & PAPUA 9.035 2.878 - - - - 9.035 2.878 I N D O N E S I A 322.273 115.826 - - 773 174 323.046 116.000
DIREKTORAT JENDERAL PERKEBUNAN
Directorate General of Estate Crops
Keterangan/Note :
1. Angka Sementara/Preliminary*)
Tabel 8.
Luas Tanaman Menghasilkan dan Produksi Jambu Mete Menurut Provinsi dan
Status Pengusahaan Tahun 2015 **)
Table
Mature Area and Cashew Nut Production by Province and Farming Category, 2015 **)
No.
Provinsi/Province
Perkebunan Rakyat
Smallholder
Perkebunan Negara
Government
Perkebunan Swasta
Private
Jumlah/Total
Luas TM/
Mature
(Ha)
Produksi
Production
(Ton)
Luas TM/
Mature
(Ha)
Produksi
Production
(Ton)
Luas TM/
Mature
(Ha)
Produksi
Production
(Ton)
Luas TM/
Mature
(Ha)
Produksi
Production
(Ton)
1. 2. 3. 4. 5. 6. 7. 8. 9. 10. ACEH SUMATERA UTARA SUMATERA BARAT R I A U KEPULAUAN RIAU J A M B I SUMATERA SELATAN KEP. BANGKA BELITUNG BENGKULU LAMPUNG 8 2 - - 8 - - 14 - 56 1 2 - - 1 - - 4 - 14 - - - - - - - - - - - - - - - - - - - - - - - - - - - - - - - - - - - - - - - - 8 2 - - 8 - - 14 - 56 1 2 - - 1 - - 4 - 14 WILAYAH SUMATERA 88 22 - - - - 88 22 11. 12. 13. 14. 15. 16. DKI. JAKARTA JAWA BARAT BANTEN JAWA TENGAH D.I. YOGYAKARTA JAWA TIMUR - 111 9 17.960 2.984 21.108 - 35 1 8.568 189 12.530 - - - - - - - - - - - - - - - - - - - - - - - 111 9 17.960 2.984 21.108 - 35 1 8.568 189 12.530 WILAYAH JAWA 42.172 21.323 - - - - 42.172 21.323 17. 18. 19. B A L INUSA TENGGARA BARAT NUSA TENGGARA TIMUR
8.237 35.649 83.285 3.420 13.105 39.155 - - - - - - 163 - 74 102 - 35 8.400 35.649 83.358 3.522 13.105 39.190
WILAYAH NUSA TENGGARA & BALI 127.170 55.680 - - 237 137 127.407 55.817
20. 21. 22. 23. 24. KALIMANTAN BARAT KALIMANTAN TENGAH KALIMANTAN SELATAN KALIMANTAN TIMUR KALIMANTAN UTARA - 129 79 29 - - 62 49 11 - - - - -- - - - -- - - - -- - - - -- - 129 79 29 - - 62 49 11 - WILAYAH KALIMANTAN 238 121 - - - - 238 121 25. 26. 27. 28. 29. 30. SULAWESI UTARA GORONTALO SULAWESI TENGAH SULAWESI SELATAN SULAWESI BARAT SULAWESI TENGGARA 95 1.852 9.011 44.695 686 87.049 21 576 3.023 16.453 206 15.225 - - - - - - - - - - - - 6 - - 534 - - 1 - - 36 - - 101 1.852 9.011 45.229 686 87.049 22 576 3.023 16.489 206 15.225 WILAYAH SULAWESI 143.389 35.504 - - 540 37 143.929 35.541 31. 32. 33. 34. M A L U K U MALUKU UTARA PAPUA PAPUA BARAT 1.611 4.384 2.808 237 951 1.329 573 37 - - - - - - - - - - - - - - - - 1.611 4.384 2.808 237 951 1.329 573 37
WILAYAH MALUKU & PAPUA 9.041 2.891 - - - - 9.041 2.891 I N D O N E S I A 322.098 115.540 - - 777 174 322.874 115.715
DIREKTORAT JENDERAL PERKEBUNAN
Directorate General of Estate Crops
Tabel 9.
Luas Areal dan Produksi Jambu Mete Perkebunan Rakyat, Besar Negara dan Besar
Swasta (PR + PBN + PBS) Menurut Provinsi dan Keadaan Tanaman Tahun 2013
Table
Area and Cashew Nut Production of Smallholder, Government and Private Estate by
Province and Tree Crop Classification, 2013
No.
Provinsi/Province
Luas Areal/Area (Ha)
Produksi
Production
(Ton)
Produktivitas/
Productivity
(Kg/Ha)
Jumlah
Petani/
Farmers
(KK)
Jumlah
Penyerapan
Tenaga Kerja
(TK)
TBM/
Immature
Mature
TM/
Damaged
TTM/TR/
Jumlah/
Total
1. 2. 3. 4. 5. 6. 7. 8. 9. 10. ACEH SUMATERA UTARA SUMATERA BARAT R I A U KEPULAUAN RIAU J A M B I SUMATERA SELATAN KEP. BANGKA BELITUNG BENGKULU LAMPUNG - 13 - - 8 - - 18 - 12 7 2 - - 7 - - 14 - 56 99 2 - - - - - 17 - 1 106 17 - - 15 - - 49 - 69 0 2 - - 1 - - 3 - 13 70 1.000 - - 143 - - 209 - 232 342 143 - - 20 - - 90 - 98 - - - - - - - - - - WILAYAH SUMATERA 51 86 119 256 19 226 693 - 11. 12. 13. 14. 15. 16. DKI. JAKARTA JAWA BARAT BANTEN JAWA TENGAH D.I. YOGYAKARTA JAWA TIMUR - 37 - 2.573 6.628 19.337 - 111 9 17.948 4.342 20.232 - 87 3 4.906 4.044 12.674 - 235 12 25.427 15.014 52.243 - 36 2 8.591 261 12.645 - 324 263 479 60 625 - 2.460 66 76.274 50.200 86.258 - - - - - - WILAYAH JAWA 28.575 42.642 21.714 92.931 21.535 505 215.258 - 17. 18. 19. B A L INUSA TENGGARA BARAT NUSA TENGGARA TIMUR
270 16.407 76.236 8.397 35.616 83.206 91 5.062 21.200 8.758 57.086 180.642 3.507 13.212 39.395 418 371 473 2.225 62.189 267.999 68 - 30
WILAYAH NUSA TENGGARA & BALI 92.913 127.219 26.353 246.485 56.113 441 332.413 98
20. 21. 22. 23. KALIMANTAN BARAT KALIMANTAN TENGAH KALIMANTAN SELATAN KALIMANTAN TIMUR - 659 4 17 - 128 79 29 - 8 12 10 - 795 95 56 - 61 49 9 - 474 616 310 - 1.165 424 73 - - - - WILAYAH KALIMANTAN 680 236 30 946 118 501 1.662 - 24. 25. 26. 27. 28. 29. SULAWESI UTARA GORONTALO SULAWESI TENGAH SULAWESI SELATAN SULAWESI BARAT SULAWESI TENGGARA 14 655 4.494 1.568 1 11.089 99 1.850 9.002 45.210 686 87.027 118 449 2.862 13.755 427 19.561 230 2.954 16.358 60.532 1.114 117.677 22 570 2.992 16.582 203 15.087 218 308 332 367 296 173 642 2.507 11.468 75.951 3.411 98.600 5 - - 243 - - WILAYAH SULAWESI 17.821 143.874 37.171 198.866 35.456 246 192.579 248 30. 31. 32. 33. M A L U K U MALUKU UTARA PAPUA PAPUA BARAT 1.043 1.556 980 53 1.608 4.381 2.805 237 982 32 1.046 107 3.634 5.969 4.832 397 944 1.317 573 39 587 301 204 163 4.276 3.695 3.421 225 - - - -
WILAYAH MALUKU & PAPUA 3.632 9.031 2.167 14.831 2.871 318 11.617 - I N D O N E S I A 143.672 323.089 87.555 554.315 116.113 359 754.222 346
DIREKTORAT JENDERAL PERKEBUNAN
Directorate General of Estate Crops
Keterangan/Note :
1. Angka Tetap/Fixed
Tabel 10.
Luas Areal dan Produksi Jambu Mete Perkebunan Rakyat, Besar Negara dan Besar
Swasta (PR + PBN + PBS) Menurut Provinsi dan Keadaan Tanaman Tahun 2014 *)
Table
Area and Cashew Nut Production of Smallholder, Government and Private Estate by
Province and Tree Crop Classification, 2014 *)
No.
Provinsi/Province
Luas Areal/Area (Ha)
Produksi
Production
(Ton)
Produktivitas/
Productivity
(Kg/Ha)
Jumlah
Petani/
Farmers
(KK)
Jumlah
Penyerapan
Tenaga Kerja
(TK)
TBM/
Immature
Mature
TM/
Damaged
TTM/TR/
Jumlah/
Total
1. 2. 3. 4. 5. 6. 7. 8. 9. 10. ACEH SUMATERA UTARA SUMATERA BARAT R I A U KEPULAUAN RIAU J A M B I SUMATERA SELATAN KEP. BANGKA BELITUNG BENGKULU LAMPUNG - 14 - - 8 - - 18 - 13 8 2 - - 8 - - 14 - 56 99 2 - - - - - 17 - 1 107 18 - - 16 - - 49 - 70 1 2 - - 1 - - 4 - 14 67 1.002 - - 136 - - 278 - 250 345 152 - - 21 - - 90 - 99 - - - - - - - - - - WILAYAH SUMATERA 53 88 119 260 22 245 707 - 11. 12. 13. 14. 15. 16. DKI. JAKARTA JAWA BARAT BANTEN JAWA TENGAH D.I. YOGYAKARTA JAWA TIMUR - 37 - 2.575 8.695 18.315 - 111 9 17.950 3.315 21.090 - 87 4 4.900 - 12.842 - 235 13 25.425 12.010 52.247 - 35 1 8.572 200 12.637 - 315 115 478 60 599 - 2.460 70 121.875 40.159 86.257 - - - - - - WILAYAH JAWA 29.622 42.475 17.833 89.930 21.445 505 250.821 - 17. 18. 19. B A L INUSA TENGGARA BARAT NUSA TENGGARA TIMUR
272 16.424 76.312 8.397 35.632 83.282 90 5.057 21.157 8.759 57.113 180.752 3.524 13.200 39.295 420 370 472 2.225 62.219 268.162 68 - 30
WILAYAH NUSA TENGGARA & BALI 93.008 127.312 26.305 246.624 56.019 440 332.607 98
20. 21. 22. 23. 24. KALIMANTAN BARAT KALIMANTAN TENGAH KALIMANTAN SELATAN KALIMANTAN TIMUR KALIMANTAN UTARA - 663 4 18 - - 129 79 29 - - 8 13 10 - - 800 96 57 - - 62 49 10 - - 477 614 345 - - 1.172 429 74 - - - - -- WILAYAH KALIMANTAN 685 237 31 953 120 507 1.675 - 25. 26. 27. 28. 29. 30. SULAWESI UTARA GORONTALO SULAWESI TENGAH SULAWESI SELATAN SULAWESI BARAT SULAWESI TENGGARA 14 656 4.503 1.611 2 11.122 99 1.851 9.006 45.219 686 87.038 117 449 2.859 13.706 427 19.541 230 2.956 16.369 60.536 1.115 117.702 21 573 3.007 16.562 205 15.148 216 310 334 366 298 174 643 2.508 11.475 75.956 3.413 98.621 5 - - 243 - - WILAYAH SULAWESI 17.909 143.899 37.099 198.907 35.516 247 192.616 248 31. 32. 33. 34. M A L U K U MALUKU UTARA PAPUA PAPUA BARAT 1.045 1.558 981 55 1.609 4.383 2.806 237 981 32 1.045 107 3.635 5.972 4.833 399 946 1.322 572 38 588 302 204 160 4.277 3.697 3.422 226 - - - -
WILAYAH MALUKU & PAPUA 3.638 9.035 2.165 14.838 2.878 319 11.622 - I N D O N E S I A 144.915 323.046 83.551 551.512 116.000 359 790.048 346
DIREKTORAT JENDERAL PERKEBUNAN
Directorate General of Estate Crops
Tabel 11.
Luas Areal dan Produksi Jambu Mete Perkebunan Rakyat, Besar Negara dan Besar
Swasta (PR + PBN + PBS) Menurut Provinsi dan Keadaan Tanaman Tahun 2015 **)
Table
Area and Cashew Nut Production of Smallholder, Government and Private Estate by
Province and Tree Crop Classification, 2015 **)
No.
Provinsi/Province
Luas Areal/Area (Ha)
Produksi
Production
(Ton)
Produktivitas/
Productivity
(Kg/Ha)
Jumlah
Petani/
Farmers
(KK)
Jumlah
Penyerapan
Tenaga Kerja
(TK)
TBM/
Immature
Mature
TM/
Damaged
TTM/TR/
Jumlah/
Total
1. 2. 3. 4. 5. 6. 7. 8. 9. 10. ACEH SUMATERA UTARA SUMATERA BARAT R I A U KEPULAUAN RIAU J A M B I SUMATERA SELATAN KEP. BANGKA BELITUNG BENGKULU LAMPUNG - 14 - - 8 - - 18 - 13 8 2 - - 8 - - 14 - 56 99 2 - - - - - 17 - 1 107 18 - - 16 - - 49 - 70 1 2 - - 1 - - 4 - 14 67 1.005 - - 137 - - 280 - 251 345 152 - - 21 - - 90 - 100 - - - - - - - - - - WILAYAH SUMATERA 53 88 119 260 22 246 708 - 11. 12. 13. 14. 15. 16. DKI. JAKARTA JAWA BARAT BANTEN JAWA TENGAH D.I. YOGYAKARTA JAWA TIMUR - 37 - 2.580 7.826 18.333 - 111 9 17.960 2.984 21.108 - 87 4 4.900 - 12.778 - 235 13 25.440 10.810 52.219 - 35 1 8.568 189 12.530 - 317 116 477 63 594 - 2.461 70 121.947 36.146 86.211 - - - - - - WILAYAH JAWA 28.777 42.172 17.769 88.717 21.323 506 246.836 - 17. 18. 19. B A L INUSA TENGGARA BARAT NUSA TENGGARA TIMUR
274 16.539 76.694 8.400 35.649 83.358 89 5.052 21.136 8.762 57.240 181.188 3.522 13.105 39.190 419 368 470 2.226 62.357 268.811 69 - 30
WILAYAH NUSA TENGGARA & BALI 93.506 127.407 26.277 247.190 55.817 438 333.393 98
20. 21. 22. 23. 24. KALIMANTAN BARAT KALIMANTAN TENGAH KALIMANTAN SELATAN KALIMANTAN TIMUR KALIMANTAN UTARA - 666 4 18 - - 129 79 29 - - 8 13 10 - - 804 96 57 - - 62 49 11 - - 479 617 363 - - 1.178 429 74 - - - - -- WILAYAH KALIMANTAN 688 238 31 957 121 511 1.681 - 25. 26. 27. 28. 29. 30. SULAWESI UTARA GORONTALO SULAWESI TENGAH SULAWESI SELATAN SULAWESI BARAT SULAWESI TENGGARA 12 660 4.530 1.653 2 11.178 101 1.852 9.011 45.229 686 87.049 117 448 2.856 13.641 426 19.522 231 2.960 16.397 60.523 1.114 117.749 22 576 3.023 16.489 206 15.225 217 311 335 365 300 175 643 2.512 11.496 75.965 3.412 98.660 5 - - 238 - - WILAYAH SULAWESI 18.034 143.929 37.011 198.974 35.541 247 192.687 243 31. 32. 33. 34. M A L U K U MALUKU UTARA PAPUA PAPUA BARAT 1.050 1.565 984 55 1.611 4.384 2.808 237 980 32 1.044 107 3.641 5.981 4.836 399 951 1.329 573 37 590 303 204 156 4.285 3.703 3.424 226 - - - -
WILAYAH MALUKU & PAPUA 3.654 9.041 2.163 14.858 2.891 320 11.638 - I N D O N E S I A 144.713 322.874 83.370 550.956 115.715 358 786.943 341
DIREKTORAT JENDERAL PERKEBUNAN
Directorate General of Estate Crops
Keterangan/Note :
1. Angka Estimasi/Estimation**)
Tabel 12.
Luas Areal dan Produksi Jambu Mete Perkebunan Rakyat Menurut Provinsi dan
Keadaan Tanaman Tahun 2013
Table
Area and Cashew Nut Production of Smallholder by Province and Tree Crop
Classification, 2013
No.
Provinsi/Province
Luas Areal/Area (Ha)
Produksi
Production
(Ton)
Produktivitas/
Productivity
(Kg/Ha)
Jumlah
Petani/
Farmers
(KK)
TBM/
Immature
Mature
TM/
Damaged
TTM/TR/
Jumlah/
Total
1. 2. 3. 4. 5. 6. 7. 8. 9. 10. ACEH SUMATERA UTARA SUMATERA BARAT R I A U KEPULAUAN RIAU J A M B I SUMATERA SELATAN KEP. BANGKA BELITUNG BENGKULU LAMPUNG - 13 - - 8 - - 18 - 12 7 2 - - 7 - - 14 - 56 99 2 - - - - - 17 - 1 106 17 - - 15 - - 49 - 69 0 2 - - 1 - - 3 - 13 70 1.000 - - 143 - - 209 - 232 342 143 - - 20 - - 90 - 98 WILAYAH SUMATERA 51 86 119 256 19 226 693 11. 12. 13. 14. 15. 16. DKI. JAKARTA JAWA BARAT BANTEN JAWA TENGAH D.I. YOGYAKARTA JAWA TIMUR - 37 - 2.573 6.628 19.337 - 111 9 17.948 4.342 20.232 - 87 3 4.906 4.044 12.674 - 235 12 25.427 15.014 52.243 - 36 2 8.591 261 12.645 - 324 263 479 60 625 - 2.460 66 76.274 50.200 86.258 WILAYAH JAWA 28.575 42.642 21.714 92.931 21.535 505 215.258 17. 18. 19. B A L INUSA TENGGARA BARAT NUSA TENGGARA TIMUR
269 16.407 76.236 8.236 35.616 83.132 82 5.062 21.199 8.587 57.086 180.567 3.405 13.212 39.360 413 371 473 2.225 62.189 267.999
WILAYAH NUSA TENGGARA & BALI 92.912 126.984 26.343 246.240 55.976 441 332.413
20. 21. 22. 23. KALIMANTAN BARAT KALIMANTAN TENGAH KALIMANTAN SELATAN KALIMANTAN TIMUR - 659 4 17 - 128 79 29 - 8 12 10 - 795 95 56 - 61 49 9 - 474 616 310 - 1.165 424 73 WILAYAH KALIMANTAN 680 236 30 946 118 501 1.662 24. 25. 26. 27. 28. 29. SULAWESI UTARA GORONTALO SULAWESI TENGAH SULAWESI SELATAN SULAWESI BARAT SULAWESI TENGGARA 11 655 4.494 1.561 1 11.089 95 1.850 9.002 44.675 686 87.027 116 449 2.862 13.400 427 19.561 223 2.954 16.358 59.636 1.114 117.677 20 570 2.992 16.576 203 15.087 211 308 332 371 296 173 642 2.507 11.468 75.951 3.411 98.600 WILAYAH SULAWESI 17.811 143.335 36.815 197.962 35.448 247 192.579 30. 31. 32. 33. M A L U K U MALUKU UTARA PAPUA PAPUA BARAT 1.043 1.556 980 53 1.608 4.381 2.805 237 982 32 1.046 107 3.634 5.969 4.832 397 944 1.317 573 39 587 301 204 163 4.276 3.695 3.421 225
WILAYAH MALUKU & PAPUA 3.632 9.031 2.167 14.831 2.871 318 11.617 I N D O N E S I A 143.661 322.315 87.189 553.166 115.969 360 754.222