Doctoral Dissertation – Academic Year 2018
Towards A
ff
ordable Urban Computing
through Deep Learning
A dissertation for the degree of Ph.D.
in Media and Governance
Graduate School of Media and Governance
Keio University
Makoto Kawano
Abstract of Doctoral Thesis Academic Year 2018
Towards A
ff
ordable Urban Computing
through Deep Learning
Abstract
Thanks to urban computing, it becomes possible to make the city much smarter. However, it is still difficult to understand them because such situations are affected by many complex factors, spatial-temporal dependency, and other factors. While deep learning can be deal with the complex situation through a lot of high-quality data is required, it is not sufficient in terms of spatial-temporal aspect. Even if we collect big urban data, though mixing the urban data is important, the required knowledge about it is high-level.
Therefore, we propose a new framework affordable urban computing to facilitate understanding urban status by collecting and utilizing the enormous amount of urban data from limited existing urban resources. Since the city is the physical space, the texts written by people is the generic sensors to represent various status. Simultaneously, the image cameras are also very effective and very generic sensors that capture various status. With these sensors which have already existed in the city, we can exploit them to understand the city much deeper by using deep neural networks and edge devices. However, due to the nature of human activity, the distribution of the data is skewed and biased. Thus, we propose GeospaceMapping, which enables to estimate the spatial information represented in the data implicitly. In our experiment, we collected actual geotagged tweets and showed GeospaceMapping can estimate the prefecture. Then, we focus on dashboard cameras of garbage trucks which travel all around the city every day for their works film whole around the city. We propose an edge device CityInspector, which posses a function of the dashboard camera and road markings inspection and evaluate it in the experiment. Finally, we design and implement CityFlow exploiting GUI so that users can efficiently develop the application intuitively. We validate the effectiveness of CityFlow by implementing GeospaceMapping and CityInsepector.
Keywords
Urban Computing, Deep Learning, Edge Computing, Computer Vision, Natual Language Processing, Data Mining
Keio University Graduate School of Media and Governance Makoto Kawano
博士論文要旨
2018
年度
(
平成
30
年度
)
深層学習によるアフォーダブル
アーバンコンピューティング実現に向けた研究
論文要旨 現在の日本をはじめ,世界ではインフラ老朽化や人口減少などの問題を解決 するために,IT技術を用いたアーバン・コンピューティングによる課題解決が注 目されている.一方で,都市状況理解は,様々な従属的な要因が複雑に絡み合っ ているため,容易ではない.そこで,都市の状況理解を促進する技術として,深 層学習があげられる.深層学習応用には大量の良質なデータが必要となるが,時 空間的に網羅したデータを集められていない.さらに都市データの種類は豊富で あり,複数種類のデータ利活用が有効的であるとされているが,組み合わせ方な どについては明らかになっていない. 本研究では,大量の良質な都市データを現在の都市の限られた資源から収集し, これらの包括的な利活用による都市理解を促進するアフォーダブル・アーバン・コ ンピューティングを提案する.対象としている都市は現実における物理空間であ る.都市の複雑な状況を表現する文章データを出力する市民をはじめとした人間 センサと,ドライブレコーダなど都市の状況を撮影可能なカメラなどの汎用的な 画像センサが存在しており,これらの利活用は有効である.しかしながら,人々の 行動の性質から,人間センサから取得可能なデータには時空間的偏りが生じてし まう.本研究では,深層学習を用いて文章や画像が潜在的に指し示す空間情報を 推定するGeospaceMappingを提案する.実験では,実際に収集した位置情報付き ツイートを用い,投稿されたテキストと画像の組み合わせから都道府県の推定が できることを検証した.さらに,カメラ映像は本来の目的が都市の状況理解のた めではないため,有効活用されずに破棄されてしまっている.本研究ではゴミ清 掃車のドライブレコーダに着目する.これは,日々の業務のために複数台が市内 を網羅的に走行しており,都市における空間的な網羅性は高い.そこで,ドライブ レコーダの機能を有し,道路標示の損傷検出を行うエッジデバイスCityInspector を提案し,実装および実験を行い,その有用性を検証した.最後に複数センサの 組み合わせをGUIによって直感的に開発が可能となる開発環境CityFlowの設計 および実装を行った.そして,実際にCityInspectorやGeospaceMappingを実装 し,その有用性を示した. 本研究の貢献は,深層学習およびエッジデバイスの利活用と,これらを統合 するインターフェースの提供により,都市の状況理解促進研究分野を開拓した点 にある. キーワードアーバンコンピューティング,深層学習,エッジコンピューティング,画像認識, 自然言語処理,データマイニング
慶應義塾大学大学院 政策・メディア研究科 河野 慎
Acknowledgments
I would like to express really my gratitude to my advisor, Professor Jin Nakazawa. Professor Nakazawa always adviced me to take action on my own and cheered me. This has never changed since I consult him about my course in graduate school.
I am grateful to members of the thesis committee. I express my gratitude to Pro-fessor Hideyuki Tokuda. ProPro-fessor Tokuda was my former adviser and he always took time out of his busy schedule and advised me. After retiring the university and acced-ing to President of National Institute of Information and Communications Technology, he always took care of my research and cheer me. I am also indebted to Professor Yasushi Kiyoki for taking care of my research since I have met him at DEIM. I would like to thank Professor Yoshiyasu Takefuji for taking time whenever I asked him and encouraging me. I also would like to thank Professor Yutaka Matsuo for undertaking to join the committee despite the suddenness and giving me a lot of advice about the thesis.
I would like to express all of the members of our laboratory, especially to Dr. Tadashi Okoshi and Dr. Yin Chen for their advice and encouragement. Needless to say, I am very grateful to Dr. Takuro Yonezawa for his kindest advice and encour-agement since I was an undergraduate and assigned the laboratory. I also thank to the member of the d-hacks members – especially Yuki Noguchi, Hirono Kawashima and Tomoki Tanimura who support group management and my research. Without their support, I would have not been able to enjoy the research life in the laboratory.
I cannot help thanking the member of the Matsuo Laboratory where is at the Uni-versity of Tokyo. Especially, Yuya Soneoka always talked to me very enjoyable and Kaoru Nasuno is always good friends to me. Needless to say, Dr. Masahiro Suzuki always advises me about my research in terms of theoretical aspects. Of course, Dr. Yusuke Iwasawa always helped me whether business or personal and I always lean on him for advice. All my thankfulness to them cannot be expressed in this acknowledg-ments.
I would like to thank Yu Ohya of NTT, Inc. He always offered some advice about my research whenever I asked him. Thanks to his advice, finally I have accomplished to submit the paper to several domestic conferences in terms of methodological aspects. Those experience will help me rest of my research life.
by taking me to the Disneyland, DisneySea and so on. Without her support, I would always have been depressed and I have not accomplished to write this thesis.
Last but not least, I would like to take this opportunity to express my sincere grati-tude to my family – especially to my parents, Seiichi and Kumiko Kawano – for always supporting me. They always concerned me whenever I come back to home.
Dedicated this thesis to my late grandmother, Tokie Kawano.
February 17, 2019 Makoto Kawano
Contents
1 Introduction 1 1.1 Background . . . 2 1.2 Research Goal . . . 2 1.3 Thesis Statement . . . 4 1.4 Thesis Organization . . . 42 Background: Towards Being Smart City 6 2.1 Introduction . . . 7
2.2 Smart City . . . 7
2.2.1 International Testbed Studies . . . 8
2.2.2 Domestic Case as Testbed Studies . . . 10
2.3 Urban Computing . . . 13
2.3.1 Examples of Urban Computing . . . 14
2.4 Deep Learning . . . 15
2.5 Summary . . . 16
3 Affordable Urban Computing 18 3.1 Introduction . . . 19
3.2 Unsolved Urban Problems . . . 19
3.3 Affordable Urban Computing . . . 20
3.3.1 Definition . . . 21
3.3.2 Information Types in Cities . . . 22
3.3.3 Requirements . . . 22
3.3.4 Relation to Urban Computing . . . 24
3.4 Problems for Realizing Urban Computing . . . 24
3.4.2 Development and Management Problem . . . 27
3.5 Summary . . . 28
4 GeospaceMapping: Urban Transfer Sensing 29 4.1 Introduction . . . 30
4.2 Location Estimation by Textual Information and Visual Information . 32 4.3 Approach . . . 35
4.3.1 Long-Short Term Memory Units . . . 36
4.3.2 Bidirectional LSTM Networks . . . 37 4.3.3 Image Encoder . . . 38 4.3.4 Multimedia Encoder . . . 38 4.3.5 Model Training . . . 40 4.4 Experiment . . . 41 4.4.1 Dataset . . . 41
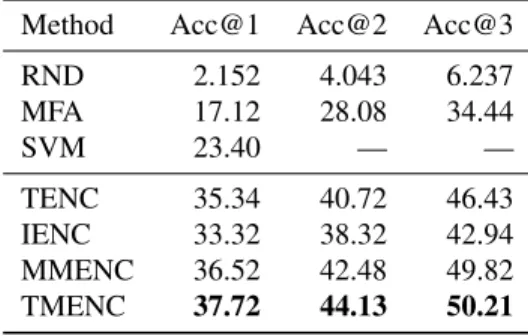
4.4.2 Result of location estimation . . . 42
4.4.3 Evaluation of during the model training . . . 44
4.5 Application 1: Event Popularity . . . 45
4.5.1 Popularity of Urban Event . . . 46
4.5.2 Analysing Method . . . 48
4.5.3 Design and Implementation . . . 50
4.5.4 Experiment . . . 52
4.5.5 Datasets for the Ground Truth . . . 53
4.5.6 Discussion . . . 54
4.6 Application 2: Transportation Modes Estimation . . . 56
4.6.1 Approach . . . 58
4.6.2 Experiment . . . 62
4.6.3 Discussion . . . 65
4.7 Discussion . . . 66
4.8 Summary . . . 67
5 CityInspector: Urban Recycled Sensing 68 5.1 Introduction . . . 69
5.2 Requirements . . . 71
5.2.1 Road Damage Detection . . . 71
5.2.3 Power Management . . . 72
5.2.4 Result Visualization . . . 73
5.3 First Study: Road Damage Recognition . . . 73
5.3.1 Dataset: Road Damage Benchmark . . . 74
5.3.2 Deep on Edge: Small Convolutional Neural Network . . . 75
5.3.3 Image devision for Practical Use . . . 76
5.4 Second Study: Road Damage Detection . . . 77
5.4.1 Road Damage Visual Object Class Dataset . . . 78
5.4.2 You Only Look Once Model . . . 79
5.4.3 Single Shot Multibox Detector . . . 82
5.5 Implementation . . . 82
5.5.1 Hardware Side . . . 82
5.5.2 Software Side . . . 84
5.6 Experiment . . . 84
5.6.1 The Accuracy of Road Recognition . . . 85
5.6.2 Road Damage Detection Accuracy . . . 87
5.7 Discussion . . . 91
5.7.1 Activation Visualization . . . 91
5.7.2 Input Image Generation . . . 92
5.7.3 The performance of Road Damage Detection . . . 93
5.8 Summary . . . 97
6 CityFlow: Urban Integrated Development Environment 98 6.1 Introduction . . . 99
6.2 Urban Machine Learning Applications . . . 100
6.2.1 Spatial-Temporal Distributed Edge Environments . . . 100
6.2.2 Life Cycle of Machine Learning Applications . . . 101
6.2.3 The Problems for Machine Learning Applications in the City . 102 6.3 CityFlow . . . 104
6.3.1 Design Policy . . . 105
6.3.2 Implementation . . . 107
6.4 Case Study . . . 110
6.4.1 GeospaceMapping . . . 110
6.4.2 Road Damage Detection . . . 111
6.5 Discussion . . . 114
6.6 Summary . . . 115
7 Related Work 116 7.1 Introduction . . . 117
7.2 Using SNS to Understand the City . . . 117
7.2.1 Information Extraction from SNS . . . 117
7.2.2 Specific Events Detection . . . 117
7.2.3 Unspecific Events Detection . . . 118
7.3 Urban Environment Sensing . . . 118
7.3.1 Road Inspection . . . 118
7.3.2 Using Cameras for Environment Sensing . . . 119
7.4 Application Development and Management . . . 120
7.4.1 Distributed Edge Computing . . . 120
7.4.2 Comfortable Development and Management Tools . . . 120
7.4.3 Qualitative Comparition . . . 122
7.5 Summary . . . 122
8 Conclusion 124 8.1 Contributions to Urban Computing . . . 125
8.2 Future Work . . . 127
8.2.1 Fine Grain GeospaceMapping . . . 127
8.2.2 Smaller, Faster and Low Cost . . . 128
8.2.3 Practicing Affordable Urban Computing . . . 129
8.3 Concluding Remark . . . 130
A Predicting Flow 146
List of Figures
2.1 The sensors that are used in Smart Santander project [1]. . . 9
2.2 The parking management system of Smart Santander [1]. . . 9
2.3 CityData [2]. . . 11
2.4 DATA-SMART CITY SUPPORO [3]. . . 12
2.5 Motivation and goal of urban computing [4]. . . 14
2.6 The example of Mask R-CNN [5]. . . 16
3.1 Coverage of conventional sensors installed in the city roads. . . 20
3.2 The illustration of before/after introducing affordable urban computing. 21 3.3 General framework of affordable urban computing. . . 23
3.4 The illustration of the difference between our affordable urban comput-ing and vanilla urban computcomput-ing proposed by Zheng et al. [4]. . . 25
4.1 Examples of geotagged tweets. . . 31
4.2 Overview of location estimation. . . 32
4.3 The geo-tagged tweets we collected during November, 2013. . . 36
4.4 A bidirectional LSTM network. . . 37
4.5 Image encoder architecture. . . 39
4.6 The architecture of multimedia mixture encoder. . . 40
4.7 The architecture of text-based mixture encoder. . . 41
4.8 The estimation accuracy change. . . 45
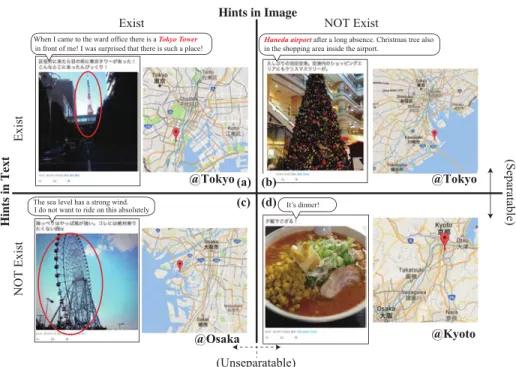
4.9 The examples for the correct case (a)(b) and incorrect case (c). . . 46
4.10 Training error, validation error and test accuracy. . . 47
4.11 Runtime during the model training. . . 48
4.12 The relation betweenfriendsandpopularity . . . 49
4.13 Our tool: (1)urban event discovery function (2) urban event Analysis Result in Graph function (3)urban event Analysis Results in Table . . 50
4.14 System architecture . . . 51
4.15 The screenshot of actual question inYahoo! CrowdSourcing . . . 54
4.16 The overall of transportation modes estimation. . . 58
4.17 Recursive autoencoder. . . 60
4.18 N-Transformed supervised recursive autoencoder. . . 62
4.19 Supervised Learning Effect. . . 65
4.20 Compressed Dimension Adjustment. . . 65
5.1 System overview. . . 70
5.2 The coverage where garbage trucks run. . . 71
5.3 Dataset samples. . . 75
5.4 Our model on DoE architecture. . . 77
5.5 Actual drive recorder image and blur situation. . . 78
5.6 Examples of our dataset, RoadDamageVOC. . . 80
5.7 The model architecture of which we use in our experiment. . . 81
5.8 System Configuration of the hardware part of CityInspector. . . 83
5.9 The state transition diagram with the actual monitor of CityInspector. 84 5.10 Prototype of CityInspector. . . 85
5.11 Software System Configure. . . 86
5.12 Visualization of the road damage inspection. . . 87
5.13 The result of the line damage detection with actual images. . . 88
5.14 The illstration of intersection over union. . . 89
5.15 The mAP score changes as the size of the training data increases. . . . 91
5.16 The visualization of kernels of first convolution layer of DoE before training and after. . . 91
5.17 The visualization of the activation of each layer when the damaged line and undamaged line input images come. Remarkably at the fifth layer, each activation is active oppositely. . . 92
5.18 The examples that are generated to let DoE more likely to classify as “undamaged”, and vice versa. . . 93
5.19 The result of model prediction. . . 95
5.20 The result of output that the number of the bounding box changes due to the class thresholdλchanging. . . 96
6.2 Influence on accuracy due to a spatial-temporal covariate shift. . . 104
6.3 Overview of CityFlow. . . 105
6.4 Automatic labeling for participatory sensing developed by CityFlow. . 107
6.5 Node in Distributed Node. . . 109
6.6 Our custom node which is the component of CityFlow. . . 111
6.7 Developing GeospaaceMapping via CityFlow. . . 111
6.8 Road damage detection application developed by CityFlow. . . 112
6.9 Automatic labeling for participatory sensing developed by CityFlow. . 113
7.1 Sony Neural Network Console. . . 121
A.1 Predicting Flow. . . 147
List of Tables
4.1 The dataset of geotagged tweets. . . 35
4.2 Experiment environment . . . 42
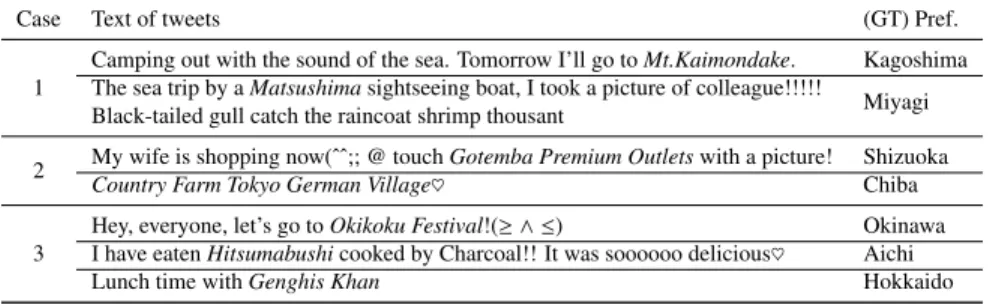
4.3 Examples of tweets excluding prefecture name which was estimated correctly. . . 42
4.4 Examples of tweets excluding prefecture name which was estimated incorrectly. . . 43
4.5 Location estimation accuracy (%) with the tweets including prefecture name. . . 43
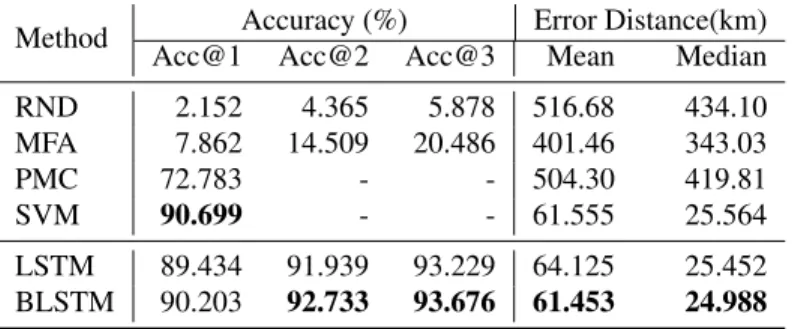
4.6 Accuracy obtained on the test set for our location estimation task with geo-tagged tweets. . . 44
4.7 The implement environment . . . 50
4.8 Target urban event list . . . 52
4.9 The answerer ofYahoo! Crowdsourcing . . . 52
4.10 Ground truth . . . 55
4.11 Regression Analysis . . . 56
4.12 Gini’s Coefficient . . . 57
4.13 The results of Spearman’s rank correlation coefficient . . . 57
4.14 Basic and Advanced Features [6][7] . . . 59
4.15 Accuracy of Microsoft GeoLife Datasets . . . 64
4.16 Accuracy of Each Transportation Modes . . . 64
5.1 State Transition Table of CityInspector. . . 73
5.2 Road Damage Benchmark Dataset. . . 74
5.3 Road Damage Visual Object Class Dataset. . . 78
5.4 Accuracy Comparison on the Line Damage Binary Classification Task. 86 5.5 Confusion Matrix of Deep on Edge Model. . . 88
5.6 The Results by Our YOLO Model. . . 89
5.7 The Result by Our SSD Model. . . 90
5.8 The Time Result by Our SSD Model . . . 90
5.9 Inference Time at the Each Device . . . 94
7.1 Qualitative Comparition between the relate works introduced in Sec-tion 7.3. . . 122
Chapter 1
1.1. BACKGROUND
1.1
Background
How can we improve our quality of life in a city? One of the key concepts of quality
improvement is asmart city[8]. Deakin and AI Wear [9] defined the smart city with some points of view: using information and communication technologies to enhance the quality, performance, and interactivity of the city services. There are a lot of cities to realize the smart city such as Singapore, Amsterdam, China and so on. For example, in Spain, SmartSantander1 is one of the famous smart city projects. In Santander, a lot of sensors are embedded in anywhere such as each parking spots, which publish the data whether the parking is full or not. Needless to say, Japan also tries to re-alize the smart city. For instance, Sapporo city conducts the project ‘Sapporo Smart City Project” from 2015, which is supported by the Ministry of Land, Infrastructure, Transport, and Tourism and the Ministry of Internal Affairs and Communications. This project aims to save energy and electricity for their environment.
One of the research fields to realize the smart city is an urban computing [10][4]. Urban computing is motivated to address the big issues in big cities, such as traffic congestion, energy consumption, and pollution, by using big data. The goal is creating solutions that improve the city environment, citizens’ life quality and city operation. For example, in order to exploit the root cause of air pollution, Zheng et al. [11] have studied the correlation between air quality and traffic flows (and points of interest). Since air pollution would violate the health of citizens, this study is very significant for the city.
In the meantime, deep learning is widely used in various research fields. Deep learning is one of the machine learning methods and it is spread rapidly starting by win-ning in the ImageNet Large Scale Visual Recognition Competition 2012 [12]. Thanks to their performance of image recognition or natural language processing, deep learn-ing is applied to the industrial field, such as autonomous cars, manufacturlearn-ing, and robotics. Thus, it can be expected to use deep learning methods to understand the city much deeper.
1.2
Research Goal
The goal of this research is that to create a new framework of urban computing through-out deep learning, since understanding the status of the city is quite difficult due to
1.2. RESEARCH GOAL
their complexity. To utilize deep learning effectively, the enormous amount and the high quality of data are required. Our proposed new framework, calledaffordable
ur-ban computingtackled to provide the urban data so that urban computing through deep
learning is made to afford.
Firstly, in terms of human as a sensor, so-called participatory sensing is a good way to get the urban data dynamically. However, people are very sensitive about privacy concerns so that the reports become sparse. For instance, Europe enforced the law about the privacy concerns, so-called the General Data Protection Regulation (GDPR), which protects the privacy for all individuals within the European Union and European Economic. While Zheng et.al [13] has distributed the devices to volunteers in order to gather the GPS data for their experiments, the GPS data has the potential to reveal the daily life of the volunteers. Moreover, it is not realistic to distribute the devices to all citizens. In short, it is possible to conduct data analysis for human life quality, yet it is difficult to conduct in daily sustainably.
The second problem about the urban environments is that conventional sensors are very useful to capture the target phenomenon such as temperatures or humidity as long as the sensors become broken. However, because the city is a continuous space, those sensors cannot cover all around the city. Therefore, many of previous studies have attempted to interpolate the data not only missing but also nothing in the first time. Of course, this is one of the solutions to deal with capturing the urban continuous space, but it has a limitation. Indeed, we need to explore the way to capturing the urban continuous space in full as much as possible.
The third problem of city operation systems is not only the cost but also the tech-nical domain knowledge of local governments. When the problems mentioned above are solved with reference to low-cost sensing, we have to think of manipulators for those sensing technologies. In general, the manipulator is assumed to be a company or a university because they have technical knowledge and skills. If the manipulators are the company, although it can be trusted the quality of their jobs, it takes a lot of fee for the contract. In the other hand, while the fee of the contract with the university is much lower than that of the company, it is difficult to work sustainably. Therefore it is preferable to manage the city operation systems within the local governments. In addition, the targets to be operated in the city environments is the data and the devices of which the variables are full. Thus, we need to treat them easily.
1.3. THESIS STATEMENT
1.3
Thesis Statement
In this thesis, we first overview the smart city cases taken place in the world and also the current status of Japan to clarify the problems that past urban computing is valu-able but not realistic to be pervasive. The main body of this thesis is a proposition of new framework, affordable urban computing, for facilitating local governments to in-troduce urban computing to their city. The contributions of this thesis are summarized as follows:
• Define the problem in introducing deep learning for practicing urban computing in the real world.
• Proposing the Affordable Urban Computing that enables to increase the amount and change the quality of urban data to make urban computing affordable.
• Proposing the geospace mapping method that attaches spatial information to non-geotagged information so that we can regard them as location-based infor-mation.
• Proposing the city condition sensing method that augments the daily works of local governments and enables them to grasp the current city status sustainably.
• Designing and implementing a development environment that enables local gov-ernments to develop and manage the application with a variety of data and de-vices.
With affordable urban computing, the amount and the quality of urban data become well so that we can use the urban data for deep learning approaches. With affordable urban computing, we can develop and manage those urban data and devices easily so that not only the experts but also beginners can do as same.
1.4
Thesis Organization
This thesis is organized as follows. Chapter 2 presents the current city status and progress towards being smart cities with urban computing. Then, we will describe our three technologies and the problems of existing research in Chapter 3 In Chapter 4, we will describe GeospaceMapping, which enables us to understand where the tweets mentioned implicitly by using deep neural networks. In the next Chapter 5, we will
1.4. THESIS ORGANIZATION
explain one of the practices of urban recycled sensing, we called CityInspector, which can inspect the condition of roads while the city officers carry out everyday tasks, such as garbage collecting and go on patrol. In Chapter 6, we will introduce the new development environment, CityFlow. Chapter 7 describes related work to reveal the contribution and the position of this thesis. Finally, we conclude this thesis in Chapter 8.
Chapter 2
Background: Towards Being
Smart City
2.1. INTRODUCTION
2.1
Introduction
In this chapter, we represent the background of our research: smart cities, urban com-puting, and deep learning. Firstly, we introduce the definition of smart cities with several global/domestic proof of concept. Then, we describe urban computing which this thesis focuses on. Lastly, we present deep learning, which is a key technology that is mainly used in this thesis.
2.2
Smart City
Smart City is a novel city that manages its assets and resources efficiently by using information and communication technologies (ICTs). With the combination of tech-nology of big data processing due to the internet (i.e. web) being widely spread, and the internet of things (IoT) that the various kind of furniture and embedded computer (such as Raspberry Pi) are connected to the internet, it is capable of data being col-lected from all over the city. Utilizing the data colcol-lected from the city enables the city to monitor and manage itself well-efficiently. For example, monitoring traffic and transportation flows and managing power plants and waterworks bureau. Though there are many cities that practices to make itself smarter, the definition of “smart city” is slightly different in the viewpoint of their practices. In this thesis, we follow the expla-nation and definition of the smart city given by Deakin and AI Wear[9] that the smart city is composed of followed four components:
• the application of a wide range of electronic and digital technologies
to communities and cities,
• the use of information technologies to transform life and work within
a region,
• the embedding of such ICTs in the city,
• the territorialization of such practices in a way that bring ICTs and
people together, so as to enhance the innovation, learning,
knowl-edge, and problem solving which they offer.– Deakin and AI Wear [9]
Note that these four components are firstly mentioned by Hollands [8] that he drew attention to the work of Komnionos [14][15] on the intelligent city, and then Deakin and AI Wear defined with appending their interpretation; the smart city should be intro-duced not only to solve each separated problem but also make the local communities
2.2. SMART CITY
better. That is, the smart city is that the city, especially local governments, and the citizens join hands for solving the city problems by using ICTs.
On the other hands, in Japan, the smart city is mentioned in the context of “Society 5.0”. Society 5.0 is the model that aims to create a novel value from a conventional information society by the system fusing cyber-space and physical-space. In current society, so-called “Society 4.0”, the human resource cost also has been higher due to decreasing birthrate and aging population, for instance. In order to alleviate the cost and solve those aging population problems, it is important to realize the society to be smart by using ICTs.
Given the practices of smart cities that are conducted in the world, there are mainly three technologies that are used as follows:
• Internet of Things (IoT) Service.
In terms of IoT, the sensors that can connect to the Internet are installed in the city such as parking and rental cycle. The data from the sensors are used for mon-itoring usage of service E.g. Manchester [16], San Leandro [17], Shanghai [18], Singapore [19].
• Open Data Platform.
Thanks to the ICTs spread widely, the variety of data is able to be obtained. The challenge with reference to this is data management. Many cities construct own platforms that can treat various data format as the same one and offer it as open data. E.g. Dublin [20], Milton Keynes [21].
• Operating System.
In terms of operating systems, some cities introduce the e-service that realizes paper-less or cash-less to reduce the cost and manage them in the digital space Moreover, there is some trial to introduce an electric car to be clean for the environments. E.g. Barcelona [22], Columbus [23], Dubai [24], Stockholm [25], NewYork [26].
2.2.1
International Testbed Studies
Firstly, we introduce the two case studies of smart cities that are conducted outside of Japan. Note that there are still many cases as not mentioned in this thesis, we focus on the cases that conduct the projects in terms of various aspects.
2.2. SMART CITY
Figure 2.1: The sensors that are used in Smart Santander project [1].
Figure 2.2: The parking management system of Smart Santander [1]. (Left) the web screen of appliction (http://maps.smartsantander.eu/). (Right) The ac-tual sensor embedded in parking and the sighboard. These images are refered from
http://www.libelium.com/smart_santander_parking_smart_city/.
Smart Santander
One of the famous smart city projects is “Smart Santander” [27], which was funded by the 7th Framework Programme, EU. Eight EU countries (i.e Spain, France, Ger-many and so on) and 15 organization, such as Telefonica from Spain, participate in this project. Several cities are selected to be a test-bed of smart city and more than 20 k of sensors are installed in the city.
In particular, in Santander City, 2000 of sensors that 650 targeted to service provi-sion (temperature, noise level, light intensity, CO) are installed on lamp posts and 400 of sensors are buried in the asphalt as depicted in Figure 2.1. They have developed several applications by using those sensors. For instance, they have developed park-ing application controllpark-ing traffic: showing parking availability with special electronic signs/web interfaces Figure 2.2.
2.2. SMART CITY
Amsterdam Smart City
Another big smart city project is “Amsterdam Smart City” [28]. Amsterdam Smart City is the platform to tackle urban issues. The distinguishing feature of this project is that those projects taken place in Amsterdam is not decided by a top-down approach such as other cities do, but applied from public authorities, businesses and citizens through the “Amsterdam Circular Challenge” held on every year. There are more than 270 applied projects, which follow within seven themes: digital city, energy, mobility, circular city, governance & education, citizens & living, and smart city academy.
For example, the aforementioned technologies, open data platform “City Data” [2] has been developed. The City Data contains big data collections including all addresses of Amsterdam, topographical data, cadastral data and so on and they offer the portal site (Figure 2.3) that the data can be downloaded with any kind of data format (e.g. csv, json) Moreover, in terms of IoT, there is a project called LoRa Smart Lighting+ Lightwell. The smart lighting enables local governments to remote control the bright-ness of streets lights via LoRa network.
2.2.2
Domestic Case as Testbed Studies
Simultaneously, we present the case studies of smart cities that are taken place in Japan. These cases are mainly sponsored by the Government of Japan: the Ministry of Land, Infrastructure, Transport and Tourism, and the Ministry of Internal Affairs and Com-munications.
Sapporo City
Sapporo city works on a smart city project from March 2017 with general incorpo-rated foundation, the foundation of Sapporo industrial promotion. This project aims to utilize open data by constructing the platform of ICT utilization,DATA-SMART CITY
SAPPORO[3]. The DATA-SMART CITY SAPPORO lets company and university to
use open data and citizens to become familiar with open data. For example, the DATA-SMART CITY SAPPORO provides the contents (e.g. flu or the information about the winter road condition) for citizens and the result of analyzing collected open data for company and university, respectively. The actual image of DATA-SMART CITY SAP-PORO is shown in Figure 2.4. Mainly, there are two functions in the DATA-SMART CITY SAPPORO as follows:
2.2. SMART CITY
Figure 2.3: CityData [2]. The screeshot of portal site(https://data.amsterdam. nl/).
• Data Catalog.
This function provides the data classified into 12 groups (e.g. disaster preven-tion, populapreven-tion, mobility): the information of shelters and the future estimated population.
• Dash Board.
This funtion displays the information of events and the status of flu epidemics by using maps and graphs of the data analyzed results.
Moreover, they conduct some studies as proof of concept. For example, in order to find the spot where snow is to be removed, they merge and use the data gathered taxi, bus, and the garbage trucks, and also the data from citizens through participatory sensing.
2.2. SMART CITY
Data Catalog
Link to search results of the data classified to each genre it is possible to find the data
Dash Board
Provide the status of Sapporo city by using maps and graphs with data
The Status of Utilizing Data
Show the hot data and genre by ranking.
The Top
Provide the weather or SNS info, and display the pickuped contents with an automated switching
Figure 2.4: DATA-SMART CITY SUPPORO [3]. The Japanese of original figure is partly changed to English.
Takamatsu City
Another example of smart cities in Japan is studied in Takamatsu City, Kagawa Pre-fecture. They use FIWARE to build the common IoT platform. Then, they use this platform for four regions of city work: disaster prevention, sightseeing, welfare, and transportation. For disaster prevention, they install water level sensors and tide level sensors into rivers so that the city officers can grasp the status of the rivers. When the sensors detect anomaly status, the city officers announce the anomaly and guide the evacuation routes via the smartphone application.
In the sightseeing region, in order to discover and understand the hot spot for for-eign tourists, Takamatsu City installs GPS loggers to rental-cycles which they provide. The GPS loggers offer the geolocation data where the tourists start and end the riding bicycles. With the geolocation data, Takamatsu City can understand the transit time, routes, and the range of activity so that they can manage tourist attractions.
For welfare region, Takamatsu City collaborates with technical college and com-pany to develop the wearable best which multiple sensors are equipped with. This wearable best is used for watching old people to detect fall and know where they are.
2.3. URBAN COMPUTING
event is very significant for the safety of citizens. Moreover, understanding the factor of a near-miss event is also significant too. Therefore, in order to gather the data of the places of near-miss events, Takamatsu City collects the videos of dashcams and conduct image processing to extract the factors.
2.3
Urban Computing
One of the research fields that tackle urban issues from a different perspective is “urban computing” [10]. Urban computing is a new paradigm shift from ubiquitous comput-ing [29], that is, a lot of devices are installed everywhere in urban space and the data about an urban environment from them is gathered for any application. In this thesis, we adopt the definition of urban computing which is given by Zheng et.al [4]:
“Urban computing is a process of acquisition, integration, and anal-ysis of big and heterogeneous data generated by diverse sources in urban spaces, such as sensors, devices, vehicles, buildings, and humans, to tackle the major issues that cities face.”
Given this definition, though urban computing seems to be similar to conventional sensing networks, the most different viewpoint is urban computing assumes that there is various kind of devices, data (formats), and human interaction.
The motivation of urban computing is in order to tackle big challenges that emerge in the modernized big city lives such as air pollution, energy consumption, and traffic congestion, using big data that is produced by sensing technologies and large comput-ing infrastructures. This motivation is illustrated in Figure 2.5. With this motivation, the goal of urban computing becomes as follows:
“Urban computing connects unobtrusive and ubiquitous sensing tech-nologies, advanced data management and analytic models, and novel visu-alization methods to create win-win-win solutions that improve the urban
environment, human life quality, and city operation systems....”[4]
which Zheng et.al [4] has mentioned. We consider this point as very significant because this point is fit for the definition of smart cities. Thus, practicing urban computing makes the city smarter.
2.3. URBAN COMPUTING
Figure 2.5: Motivation and goal of urban computing [4].
2.3.1
Examples of Urban Computing
With reference to Zheng et al. [4], there are several themes that urban computing tack-les. In this section, we briefly introduce the examples of urban computing in the three aspects according to Figure 2.5: environment, human, CityOS.
Environment
Recently, we have observed that the air is polluted by PM2.5 or pollen spread especially in Japan. Simultaneously, there is noise pollution in a number of countries, such as the United States, the United Kingdom, and Germany. That is, it is important for citizens and cities to monitor and protect the environment. In terms of environmental monitoring, there are some works to estimate the urban air quality based on various sensors [30][31]. Another example of noise pollution, Rana et al. [32] have used a smartphone to measure the sound of noise and then map the result to the systems. Another work related to environments is energy consumption. For example, Zhang et al. [33] have attempted to detect the refueling behavior from GPS trajectories collected from taxies in Beijing.
Human
The challenges about the human in the city are that what kind of people is live in and whether the city is safe/secure. There are a lot of studies measuring the similarity of people by using the data of social media services or mobility data [34][35]. In particular, location-based social networks, which location information is attached to existing contents such as text and images, are very useful for similarity measuring,
2.4. DEEP LEARNING
because individuals’ location history in the real-world implies their interests[36] and behaviors. Therefore, the similarity between users by comparing with their location histories can be used for user recommendation [37] or community discovery [38].
On the other hand, people do not want to live in a city where crimes often occur or that is not safe/secure. There are some works that predict the place and the time is at high risk for future crimes [39] or study the relationship between urban form and gang activity [40].
City Operation System
The last concept is the city operation system assuming that mainly local governments use the organization managing the infrastructures such as urban transportation (i.e. buses, taxies, trains, and subways). For local governments, effective planning is very significant to build a smart city. In order to formulate urban planning, a local gov-ernment is required to grasp various factors, such as traffic flow with road network structures. Zheng et al. [41] have estimated the underlying problems in Beijing’s trans-portation network by analyzing the GPS trajectories from the taxies over 3 years and found that a newly launched subway line solved the underlying problem that traffic flow is slow. Another research related to urban planning is Yuan et al. [42]. Yuan et al. have proposed a framework that discovers regions of differnet functions in a city such as the educational and scientific, or commercial areas in Beijing. On the other hand, for managing transportation, there are some works to improve the taxi services [43] and bus services [44].
2.4
Deep Learning
In the meanwhile, deep learning, nowadays, has been well-known all over the world because of its capability. While deep learning is just one of machine learning meth-ods, Goodfellow et al. [45] has said in his book that deep learning helps computers to understand the world in terms of a hierarchy of concepts, with each concept defined through its relation to simpler concepts. The history of deep learning is so long that it is said that the concept of deep learning is first known as cybernetics in the 1940s – 1960s, then known as connectionism in the 1980s – 1990s, and currently beginning to be known as ‘deep learning’ in 2006. The most breaking news that deep learning has been widely known is that a convolutional neural network, which is one of the
fa-2.5. SUMMARY
Figure 2.6: The example of Mask R-CNN [5]. This image is refered fromhttps:
//github.com/facebookresearch/Detectron.
mous architecture of deep learning, won the ImageNet Large Scale Visual Recognition Challenge (ILSVRC) for the first time and by a wide margin in 2012 [46].
With this breakthrough, deep learning is rapidly applied to the various scene, such as natural language processing [47], and speech recognition [48]. For example, in terms of image recognition, deep learning is able not only to classify given images into multi-class labels but also detect the same instance of objects in a given image [5] as depicted in Figure 2.6. Besides the image recognition, it has come up in the news in the context of NLP that the algorithm of Google Translation systems [49] is replaced with a deep neural network, whose architecture is so-called LSTMs [50].
In addition, extending deep learning to the domain of reinforcement learning achieves good results [51]. Reinforcement learning is that train an autonomous agent to perform a task by try and error without any explicit guidance. One of the famous results is Al-phaGo that defeats a world champion at ‘Go‘ game [52]. Furthermore, reinforcement with deep learning has been applied to robotics [53]. The reason for the progress of deep learning is a technological innovation including GPUs and big data (e.g. from 1.2M [54] to 300M [55]).
To summarize, deep learning has a great potential to solve the real-world problem, yet the crowning achievements are in a limited domain. While there are some works that use deep learning for urban computing [56][57], it is not sufficient and we have to explore the usability of deep learning for urban computing.
2.5
Summary
This chapter represented the background research of this thesis. In order to improve the quality of citizens life, a lot of cities introduce IT technologies, such as IoT and big data
2.5. SUMMARY
platforms, with the support from the government in the context of smart cities. One of the technologies that make a city smart is urban computing using various data to solve urban challenges. We describe some examples of smart cities and urban computing respectively. However, using these technologies are assumed to have an enormous budget and computer resource. In the next chapter, we describe the problems that occur when small cities attempt to introduce these technologies.
Chapter 3
3.1. INTRODUCTION
3.1
Introduction
In this chapter, we present a new computing paradigm calledaffordable urban
com-putingwhich we propose in this thesis. To motivate our proposal, firstly, we explain
the current status of Fujisawa City which has not been yet solved by conventional ur-ban computing approach. Then, we define the term “affordable urban computing” with their requirements. Lastly, we discuss questions of this research to be solved in order to realize the concept.
3.2
Unsolved Urban Problems
In the conventional urban computing research field, aforementioned large scale appli-cations, such as air pollution or traffic flows are focused because those cities where practice smart city projects are tends to be a big city. Of course, it is not only the applications for big cities but also for small (not big) cities, for example, Fujisawa City in Japan. In addition, there are a lot of problems which are mentioned in the previous chapter. For instance, the infrastructure of the city, such as road networks and tunnels, because the infrastructure has been often constructed in a period of high economic growth. Therefore, local governments are required to investigate the infras-tructure whether it needs to be repaired or not, and if it is, plan when they repair the infrastructure. Similarly, local governments want to know how much garbages are taken out during one day. Moreover, they want to know how many people visit their cities because the number of people visits their sightseeing spot is very important for their urban planning.
In order to know the status of the cities, hiring people to observe and report the status is a simple, easy and quick way to begin. However, especially in Japan, the population become decreasing so that there is a prediction that the population of Japan will become much less than recent. Moreover, while a ‘working’ population will be decreased by 40% until 20651 due to the population decreased, amount of work of local governments be increased rather than being unchanged because of the rate of aging people will glow. Therefore, it is not realistic to hire the people for understanding the cities.
With these above reasons, local governments also want to introduce urban com-1Investigated by Mizuho Research Institute Ltd. https://www.mizuho-ri.co.jp/publication/ research/pdf/insight/pl170531.pdf
3.3. AFFORDABLE URBAN COMPUTING
Longitude Time
Latitude
Figure 3.1: Coverage of conventional sensors installed in the city roads. If the sensors are installed in the intersection (blue areas), we cannot get the information about the green areas where are out of the areas that sensors can capture.
puting technologies in their cities to make it smarter, that is, they want to understand in more detail and with more precision how citizens live in their cities and how the environment of their cities is.
Nevertheless, the conventional urban computing such proposed by Zheng et al. [4] is not able to satisfy the requirements to solve aforementioned challenges, because the data which they have used in their studies is not much fine-grain in spatial-temporal aspects. Namely, as to road inspection, while Zheng et al have also mentioned that we do not have sensors on every road hence we should use human as a sensor instead, still, human as a sensors is not enough to capture ‘all’ damaged roads. One of the reasons that human as a sensor is not enough is that because the privacy of users who report a road damage may be violated, users dislike reporting. Another reason is that it is quite difficult for users to see all roads as depicted in Figure 3.1, the green area being out of the conventional sensors (blue areas).
In summary, we have to propose a new framework that can tackle such challenges that require affordable sensing in the context of spatial-temporal and the environment that enable to develop and manage the data from affordable sensing and the devices easily.
3.3
A
ff
ordable Urban Computing
In this section, we describe a new concept of affordable computing, which aims to solve the lack of data and development environments problems so that makes urban computer able to afford. First of all, we define the terms “affordable urban computing”,
3.3. AFFORDABLE URBAN COMPUTING Local Governments/ City Office City Company/ Silver Human Resources Center ①Isses Reporting ③Outsourcing ⑤Corresponding/Coping ①Issues Reporting + Sensing ④Corresponding/Coping (④Developing/Management) ②Grasping/Discussing ③Developing/Management ②Grasping/Discussing
Figure 3.2: The illustration of before/after introducing affordable urban computing. Before introducing affordable urban computing, 1) when local governments get some issue reports, 2) they discuss the issues whether to be solved or not immediately. 3) If they decide to solve issues, they often outsource them to some company. 4) The company plan the approach to solve the issues 5) and solve them.
then we explain the requirements to realize the affordable urban computing.
3.3.1
Definition
Affordable urban computingis a new concept that aims at efficient operating of
(com-plemental) data and context information by utilizing “things” existing in the city as sensors, in order to afford urban computing. A term ofcityorurbanindicates a lo-cal public entity well-defined in the constitution. Therefore, in terms of a lolo-cal public entity, we can also regard some ’town’ or ‘village’ which is so-called ’rural area’ as ’urban’ or ’city’, though the budget of towns or village is much fewer than that of cities. Affordable urban computing combines deep learning methodology and edge computing, which lets us operate the various modal data/information with low costs.
Figure 3.2 shows the process of solving urban challenges with/without introducing affordable urban computing. In the current city, when a local government gets some issue reports, they discuss the issue of whether to be addressed or not as a priority. As the local government decides to address the issue, they outsource it to a company if the local government cannot address the issue by itself. On the other hand, using sensing technologies and a development environment of affordable urban computing, the local government unable to address the issue by itself.
3.3. AFFORDABLE URBAN COMPUTING
3.3.2
Information Types in Cities
In the city, there are enormous kinds of data. In this thesis, we categorize the data into two types: geospatial information and urban information. According to Article 2 of the Basic Act on the Advancement of Utilizing Geospatial Information, geospatial information is defined as:
• The term ”Geospatial Information” as used in this Act means infor-mation consisting of either item (i) or a combination of items (i) and (ii):
• (i) information that represents the position of a specific point or area in geospace (including temporal information pertaining to said infor-mation, hereinafter referred to as ”Positional Information”); and
• (ii) any information associated with the information in the preceding item of this Article.
Simultaneously, we also define urban information as the information that describes the status of anything about the city, such as images and text.
3.3.3
Requirements
The major goal of affordable urban computing is to enable the cities where is willing to monitor and understand their citizens’ lives and the status of their city environment. Figure 3.3 illustrate a general framework of affordable urban computing. A part sur-rounded by red dash lines is our affordable urban computing, while except the part is out of the scope of this thesis. Indeed, a part of participatory sensing in a human as a sensor and conventional sensors are out of scope in our thesis because many research has studied in those technologies. Though, we introduce participatory sensing briefly in the next section. To realize affordable urban computing, we need technologies that fulfills the following two requirements.
• Ecological Urban Sensing.
Urban computing requires a lot of data to conduct machine learning approaches and analysis, so-called big data. Of course, Zheng et al. [4] have mentioned they use the data being both geospatial information and urban information. However, in the city, there is still a lot of data that is not used not at all even though it is either geospatial information or urban information. For example, the images
3.3. AFFORDABLE URBAN COMPUTING
Chap. 6: CityFlow
Statistical Urban Computing for Urban planning, long-term perspectives
Beginners & Experts Development ML Application Visual Programming Distributed Environment City Chap. 5: CityInspector Urban Recycled Sensing Chap. 4: GeospaceMapping
Urban Transfer Sensing Human as a Sensor
Participatory Sensing Physical Sensors
Ecological Urban Sensing
Urban Integrated Development Environment
Figure 3.3: General framework of affordable urban computing.
filmed by cameras existing in the city, such as dashboard cameras or surveillance cameras. Otherwise, the web data or log data that does not contain geospatial information. Indeed, if we attach the geospatial information to urban information or vice versa, we can afford the data to urban computing so that we can enhance and facilitate urban computing. Nevertheless, the conventional way to utilize the data is post-processed after aggregating the data. This is very troublesome due to the difference in the format of data or the procedures. In order to remedy this problem, those cameras should be implemented as edge devices.
• Unnecessity of Expert Knowlegdement.
The variety of urban data is enormous in the city and it is expected to use them as much as the performance of approaches such as deep learning is increased. However, it is difficult for us to know how can we mix the various data in appro-priately. For example, with the data that users posted in social network service, which contains not only the text but also images or users’ social network. What is the good way to combine these kinds of data? While, in general, this is a role for experts such as data scientists, there is merely no experts in local govern-ments. Indeed, we need the environments that can examine the performance of the combination of data and the stretegies to combining the data.
3.4. PROBLEMS FOR REALIZING URBAN COMPUTING
• Easy Development and Management.
Due to conducting affordable urban sensing, the enormous amount of data is generated in the city. In terms of efficiency, developers must be able to manage the data flow and utilize it easily. We consider that the number of application of affordable urban sensing might be large so that it is troublesome to develop every application of affordable urban sensing. With regard to affordable urban sensing application development, developers are required to consider the specification and contexts of devices which are deployed the application. For supporting, easy development and management environment need to be realized.
Moreover, while a developer would be an expert of programming, networking and machine learning generally, we assume that the beginners such as the city officers of local government even citizens may develop the applications. There-fore, the development and management environment need to become much eas-ier for beginners.
3.3.4
Relation to Urban Computing
Affordable urban computing is, of course, very similar to conventional urban comput-ing proposed by Zheng et al. [4]. The main purpose of both concepts is the same that both aim to tackle urban challenges and utilize human as a sensor. However, the urban data is not sufficient for utilizing deep learning application. Even if the urban data is collected enough for deep learning, the way to mix the urban data for deep learning and to develop and manage the urban data with the devices are troublesome. Our aff ord-able urban computing is a new framework to tackle these problems within the current limited resources (data and environments) and realize urban computing to be more af-fordable. While the difference between them is that our affordable urban computing attempts to increase a ‘gradient’ that obtained value per a cost more than vanilla urban computing as illustrated in Figure 3.4.
3.4
Problems for Realizing Urban Computing
3.4.1
A
ff
ording Data Problem
In order to realize urban computing, we focus on ‘text’ sensors and ‘image’ sensors; we utilize data of social network service and data of cameras installed in the city. Since the city is very complex physical space, these ‘flexible’ sensors are effective to capture the
3.4. PROBLEMS FOR REALIZING URBAN COMPUTING
Urban Computing
[Zheng+, 2014]
Cost
Value
Affordable
Urban Computing
Figure 3.4: The illustration of the difference between our affordable urban computing and vanilla urban computing proposed by Zheng et al. [4].
status or the context of the city. However, the data from the flexible sensors are not able to be used straightforwardly due to the data which is also complexity. To remedy this problem, we adopt deep neural networks because those enable to extract the arbitrary information as the representation. However, there is no study that extracting urban information by using deep neural networks, as our best knowledge. Therefore, this is the problem which should be revealed whether it is possible or not.
Geospatial Information Attachment
Though it is able to monitor parking availability if the small cities enable to purchase sensors such as cameras or the sensors embedded in the roads as Smart Santander [1], it might be difficult to install a sufficient number of sensors without enormous supports such as national foundation. One of the solutions of this problem is participatory sens-ing [58][59]. By adoptsens-ing the participatory senssens-ing, the city does not need to install the many sensors to all around the city, because the citizens help to offer not only the information that conventional sensors can sensing but also dynamic events such as traf-fic accidents or illegal dumps. In this framework, citizens who participate to offer the information can be regarded as sensors, which is so-called human as a sensor.
3.4. PROBLEMS FOR REALIZING URBAN COMPUTING
As introducing participatory sensing, though, not only the economic cost remains but also the new cost is incurred: human cost. Citizens would participate to offer the information at the beginning of the participatory sensing system, thanks to their curiosity and interests. However, with losing the interest and curiosity, it is difficult to request citizens to continue to offer the information. There is a lot of works to tackle this problem in the terms of incentive [60], which motivates the citizens to participate in the information offering continuously. Moreover, one of the problems mentioned among the studies of participatory sensing is privacy concerns. When some user report issues about the city with their location information, the other users can infer or know where the user was. Repeating this inference, again and again, the range of the user behavior is easily estimated. This is the case to avoid and users become hesitate to report issues frequently.
Thus, in this research, we propose an alternative approach not to request users to re-port urban information with their location but to obtain the location from other sources, that is, social network service. The reason why we use social network service is simple that users already have offered information about the city willingly. Zheng et al. [4] also have claimed to utilize social network service as passive crowd sensing; human as a sensor. However, they have only focused on the social network service which enables users to attach location information, so-called location-based social networks, which is much fewer than general social network service; it is only 5 % of all tweets that attached in Twitter2. In order to remedy this trouble, we have to infer the location of users by analyzing the text which users posted to social network service, and regarded as ‘pseudo’ human as a sensor.
Urban Information Extraction
Given a human as a sensor, while it is convenient to capture the dynamic phenomenon which happens unscheduled so that it is difficult for conventional sensors to capture it, there is a problem that citizens cannot capture them continually in spatial-temporal. The one of the way that complements the lack of humanity as a sensor isfacility as a
sensor, which utilizing the facilities that have already been installed in the city, such
as surveillance camera or the sensors which automobile equips. If we can utilize those facilities exists in the city efficiently with conventional sensors and human as a sensor, we can cover the whole area of the city to sense the status of the city. Furthermore,
3.4. PROBLEMS FOR REALIZING URBAN COMPUTING
other devices, so-called IoT devices or edge devices, would be developed in the future so that enormous devices would exist in the city.
While utilizing these devices are well-suit for affordable urban computing, there is a difficulty in terms of data processing where those devices are. In general, such those devices connected with each other in an application, the devices are synchronized as to time. Therefore, collecting and saving the data to the storage such as a database is not difficult; indexing the data with its generated timestamp. Meanwhile, the edge devices such cameras are not synchronized so that treating the data generated from the devices is troublesome. In order to handle this situation, conducting the process in the devices as much as possible is effective. Indeed, affordable urban computing requires edge devices to conduct some processing within itself.
The next problem is that we need to finish conducting some processing completely within the edge devices in order to make the data management easier. We assume that the processing is image processing such as using deep convolutional neural net-works. This is because if the degree of sensing abstraction of data for urban computing becomes deeper than that of raw data that is currently dismissed, such high abstracted data is useful. For instance, though images from a dashboard camera are now dismissed due to the Personal Information Protection Law, the road damage data detected from the images is valuable. However, most of the studies using deep conventional neural networks assume that they work on a high-performance computer which equips GPU. In short, this is the question that contains 1) can the deep neural networks extract the high-abstracted information from data? and 2) does such deep neural network enable to work on edge devices?
3.4.2
Development and Management Problem
In the description of the edge device as a sensor, we refer to the problem of edge device environments that it is difficult to manage the data generated from edge devices. Even if the processing can be conducted within the devices, we need to manage the result of that processing. Simultaneously, developing and deploying the processing/applications to the enormous amount of edge devices has a lot of trouble with coding; treating their network environments or their specification.
Therefore, we need to provide a development environment that enables users such as not only the developer but also city officers to develop and manage the data flow and devices with arbitrarily contain. Moreover, since we assume that our affordable
3.5. SUMMARY
urban computing can be applied to any cities, the source developed by someone in this development environment should be reusable and it should be easy to use.
Programming languages and toolchains that have evolved to facilitate the develop-ment of traditional applications, in sometimes, lack the features needed to address, and in some cases exploit, the scale and dynamic nature of affordable urban sensing. Es-pecially, we consider that the components that represent the functions should be used easily, the communication among the components should be abstracted, and it should be suitable for a range of skills, such as machine learning approach.
3.5
Summary
Conventional urban computing has the potential to solve various city challenges, yet some city challenges are still remaining as being unsolved due to coarse-grained sens-ing. However, it is difficult to solve the challenges by defraying more costs, so that we need to consider alternative urban computing to solve them. In this chapter, we proposed the affordable urban computing which enables us to monitor and understand the status of the city with fine-grained sensing approach. In order to realize this new urban computing, we described three problems: modality translation problem, edge execution problem and development, and management problem. Following chapters describes the solution of these problems, respectively.
Chapter 4
GeospaceMapping: Urban
Transfer Sensing
4.1. INTRODUCTION
4.1
Introduction
This chapter presents urban transfer sensing technogies that estimates the location of urban data, especially texts and images generated by human, to transfer the non-geospace data into non-geospace data. With this technology, we can obtain the data related to geospatial-temporal aspects with reference to urban computing. In this thesis, we suppose the dynamic urban data contains the event that it is difficult for us to predict that event happens or the detail of the event, such as how many people are in the event or where people come from. Understanding the dynamic urban context is very impor-tant for the citizens and the administrative organ to tackle the issues that cities face, e.g. natural disasters, traffic congestion. Although such dynamic urban context is very useful to understand the status and teh context of the city, most of the data does not contain the geo-spatial information, such as geo-coordinates: latitude or longitude.
One of the approach to collect the information which indicates geospace and the content of the city is the participatory sensing [59] that is the concept of gathering the data not from sensors but from users. It is difficult to capture the dynamic event by sensors due to the characters of events. On the other hand, since users can be adapted to the dynamic event, they can report the events as the data. Although the participa-tory sensing seems to be suitable for capturing the dynamic events, there are two big problems to be solved: the incentive and the privacy concerns. As the early stage of some participatory sensing application, many users would volunteer to provide the data about the dynamic events thanks to their curiosity. After the early stage, the incentive is required in order to offer the users to continue to provide the data. Simultaneously, providing the data about the event related to the region such as local festival would violate the privacy concerns; we can know that the users are there. In short, the data from the participatory sensing application would be selectively biased, since the users very carefully select the opportunity of providing the data.
As the platform that the data is provided by users as same as the participatory sensing, we can use the data from social network services (SNS). Since the users in the SNS tend to post text and/or images that describe their experiences, we can know what happens around the users. By contrast, the geolocation informations are not posted to the SNS as well as the text and images due to the privacy concerns. For example, only 1% of tweets contains the geolocation on Twitter. If we can know the geolocation of the information that users post in the SNS, it helps us to understand the urban context. To tackle the geolocation missing, we propose the method to estimate the location
4.1. INTRODUCTION
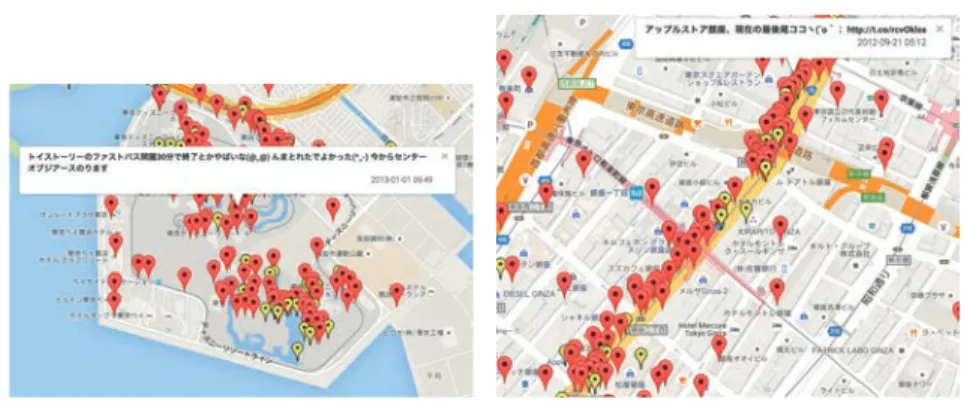
(a) Tokyo Disney Resorts. An attraction is crowded now.
(b) Apple Store in Ginza. Long lines form on the day that iphone 5 go on sale.
Figure 4.1: Examples of geotagged tweets. We can know what happen and where it is through observing geotagged tweets.
of tweets where they are posted. The remains of this chapter describe the method to estimate the location of users who posted tweets in detail firstly. Utilizing the method, we can gather the information about the event, the location and the text describing the context. Then, we introduce the two kinds of application that can be developed by acquiring the geolocation information. The first application is that investigating the popularity of events that what kinds of a genre that the participants of the events have. With this application, we can apply to the promotion or advertisement for events.
The second application is that estimating the transportation modes of users what kind of vehicles (or walking) is used to move around in the city by users. With this application, the city governments and companies can know the status of public author-ities and plan to replace the new timetable for buses or trains. In each section that describes the two application, we formulate the applications as machine learning tasks; supervised classification tasks. After we explain the approach to solve the each task, we describe the dataset which we used in the experiment.
Finally, we discuss the position of our GeospaceMapping in the context of urban computing.
![Figure 2.1: The sensors that are used in Smart Santander project [1].](https://thumb-ap.123doks.com/thumbv2/123dok/1867260.2662921/24.918.202.721.157.317/figure-sensors-used-smart-santander-project.webp)
![Figure 2.3: CityData [2]. The screeshot of portal site(https://data.amsterdam.](https://thumb-ap.123doks.com/thumbv2/123dok/1867260.2662921/26.918.205.714.187.610/figure-citydata-screeshot-portal-site-https-data-amsterdam.webp)
![Figure 2.4: DATA-SMART CITY SUPPORO [3]. The Japanese of original figure is partly changed to English.](https://thumb-ap.123doks.com/thumbv2/123dok/1867260.2662921/27.918.201.717.178.502/figure-smart-supporo-japanese-original-figure-changed-english.webp)