Aalto University School of Science
Degree Programme of Computer Science and Engineering
Heikki Lindroos
E
ff
ects of Social Presence on the Viewing
Experience in a Second Screen
Environ-ment
Master’s Thesis
Espoo, January 27, 2014
Supervisor: Professor Pirkko Oittinen, Aalto University Instructor: Ph.D. (tech) Teemu Kinnunen
Aalto University School of Science
Degree Programme of Computer Science and Engineering MASTER’S THESISABSTRACT OF
Author: Heikki Lindroos
Title:
Effects of Social Presence on the Viewing Experience in a Second Screen Envi-ronment
Date: January 27, 2014 Pages: viii+97
Professorship: Mediatechnology Code: T-75
Supervisor: Professor Pirkko Oittinen
Instructor: Ph.D. (tech) Teemu Kinnunen
Technological progress and changes in society have affected the media con-sumption habits that people are now accustomed to. The introduction of smart-phones, the penetration of social networking services and the increased pres-ence of both have put the consumer in a more active role. In the context of watching TV, these changes have brought up new surroundings for viewing media. This is known as a second screen viewing environment, in which the TV viewer multitasks with another electronic device simultaneously. Second screen content can vary widely, here we are interested in the social media con-tent.
Both broadcasting companies and the research community have shown inter-est towards the field. Many have selected Twitter as the platform of choice to accompany viewers. Tweets are used both among consumers and between con-sumers and content providers. Researchers have studied the new multitasking environment from a traditional performance and gratification perspective. In this thesis the effects of second screen viewing are explored on the viewing experience. Differences are sought between two viewing conditions, one with plain TV viewing and one where TV viewing is accompanied by a tweet feed on the second screen. In addition, the differences in effect between TV genres are studied.
As a result it was found that even though the two media continue to merge, people still differentiate them. Further, it can be reported that significant dif-ferences in the suitability of second screen content between the genres were found. Moreover, identifiable factors affecting second screen content amenity are reported.
Keywords: social media, Twitter, television, viewing experience
Language: English
Aalto-yliopisto
Perustieteiden korkeakoulu
Tietotekniikan tutkinto-ohjelma DIPLOMITYÖNTIIVISTELMÄ
Tekijä: Heikki Lindroos
Työn nimi:
Tabletilla tapahtuvan sosiaalisen läsnäolon vaikutus television katselukoke-mukseen
Päiväys: 27. tammikuuta 2014 Sivumäärä: viii+97
Professuuri: Mediatekniikka Koodi: T-75
Valvoja: Professori Pirkko Oittinen
Ohjaaja: TkT Teemu Kinnunen
Uudet innovaatiot, palvelut ja tuotteet mullistavat jatkuvasti mediateollisuut-ta. Uuden sukupolven mobiililaitteet ja sosiaalisen median voimakas läpilyönti ovat asettaneet television katselijan aikaisempaa aktiivisempaan asemaan. Tä-mä muutos on samalla ajanut kuluttajat seuraamaan useampaa mediaa ja lai-tetta samanaikaisesti. Television katselua tukevaa toista lailai-tetta on nimitetty englanninkielisessä kirjallisuudessa termilläsecond screen.
Sekä median tuottajat että tutkijayhteisö ovat kiinnittäneet huomiota tähän ke-hitykseen. Sisällön tuottajat ovat valinneet sosiaalisen median alustaksi Twitte-rin, palvelun, jossa käyttäjät voivat jakaa lyhyitä, korkeintaan 140 merkin mit-taisia viestejä mm. koskien katsomiaan televisio-ohjelmia. Tutkijat ovat keskit-tyneet tutkimaan tätä uutta ympäristöä mm. etsimällä kasvavan mediakäytön tuomaa mielihyvää ja katselutottumuksien seuraamuksia. Moni tutkimus si-joittuu myös hyvin väkirikkaisiin maihin, joissa mm. Twitterin käyttö on huo-mattavasti yleisempää kuin Suomessa.
Diplomityössä on tutkittu tätä ilmiötä suomenkielisessä ympäristössä. Työssä on selvitetty, kuinka ihmiset kokevat lisälaitteen tuoman hyödyn ja kuinka hy-vin lisälaitteen tuoma sisältö sopii median eri tyylilajeihin. Työssä myös rapor-toidaan, miten ihmiset kokevat tämän uuden mediaympäristön.
Työn tuloksena onnistuttiin selvittämään, että medioiden integroitumisesta huolimatta ei niitä katselukokemuksen aikana silti koeta yhdeksi. Lisäksi tyyli-lajien välillä pystyttiin havaitsemaan huomattavia lisäsisällön sopivuuden väli-siä eroja. Tämän lisäksi selvisivät mielyttäneeseen lisäsisältökokemukseen vai-kuttaneet syyt.
Asiasanat: sosiaalinen media, Twitter, televisio, katselukokemus
Kieli: englanti
Acknowledgements
I wish to thank my supervisor Professor Pirkko Oittinen for quickly orga-nizing a thesis position form me at the department and my instructor Ph.D. Teemu Kinnunen for all the help and support he provided.
I wish to thank my parents for their help and support throughout my years in school.
I wish to thank Mr. Kenta Kusumoto for doing an amazing job when programming the test environment software used in the experimental part of this thesis.
I would like to thank the people who participated in the experimental part of this study.
I also wish to thank Viestintäalan tutkimusäätiö1 for financially
sup-porting this thesis. Espoo, January 27, 2014 Heikki Lindroos
1 http://www.vkl.fi/vts/vts
Abbreviations and Acronyms
API Application Programming Interface BAS Behavioral Activation System BIS Behavioral Inhibition System
Companion App An application designed to accompany second screen viewing
ECG Electrocardiography (also EKG), interpretation of the electrical activity of the heart
EDA Electrodermal activity, also known as Galvanic skin response
EMG Electromyography, a technique for recording and evaluating the electrical activity produced by skele-tal muscles
ETG Eye Tracking Glasses, a solution for gaze tracking Hashtag A method used by Twitter to tag topics
(e.g. ”#thesis”)
MPI Multitasking Preference Inventory, a measure of polychronicity
OR Orienting Response, immediate response to a change in its environment
PNS Parasympathetic nervous system
Retweet On Twitter, the act of forwarding (or reposting) a tweet
SAM Self Assessment Manikin, a nonverbal method used for emotional selfreporting
SCL Skin Conductance Level SCR Skin Conductance Response SNS Sympathetic nervous system U&G Uses and Gratifications iTV interactive television
YLE Finnish Broadcasting Company v
Contents
1 Introduction 1
2 Background 3
2.1 Multitasking . . . 3
2.1.1 Human Ability to Multitask . . . 4
2.1.2 Concurrent, Interleaved and Sequential Multitasking 5 2.1.3 Task Switching . . . 6
2.1.4 Reasons for Multitasking . . . 7
2.1.5 Media Multitasking . . . 8
2.2 Second Screen . . . 10
2.2.1 Second Screen in a Media Environment . . . 10
2.2.2 Introduction of the Tablet — a New Environment . . 11
2.3 Increasing Media Consumption . . . 12
2.3.1 Social TV . . . 12
2.3.2 Interactive TV . . . 13
2.4 Social Presence . . . 14
2.4.1 Social Media . . . 14
2.4.2 Social Media Habits in Finland . . . 15
2.4.3 Twitter . . . 16
2.4.4 Modelling Needs and Fulfillment . . . 16
2.4.5 Current Implementations . . . 17
3 Experiment 19 3.1 Experiment Design and Environment . . . 20
3.1.1 Hardware . . . 20
3.1.2 Environment . . . 21
3.1.3 Software . . . 22
3.2 Stimuli . . . 23
3.2.1 Video Stimuli Ground Truth Collection . . . 25
3.2.2 Tweets . . . 26 vi
3.2.3 Sentiment Analysis of the Tweets . . . 27
3.3 Collection of Data . . . 28
3.3.1 Likert-style Scales . . . 30
3.3.2 Self Assessment Manikin . . . 30
3.3.3 Behavioural Inhibition and Activation . . . 31
3.3.4 Polychronicity . . . 31
3.4 Psychophysiological Measures . . . 32
3.4.1 Measures of the Human Nervous System . . . 33
3.4.2 Heart Rate . . . 34 3.4.3 Electrodermal Activity . . . 34 3.4.4 Facial Electromyography . . . 36 3.4.5 Orienting Response . . . 37 3.5 Eye-tracking . . . 38 3.6 Participants . . . 39 3.7 Procedure . . . 40 4 Results 41 4.1 Processing of Sensory Data . . . 41
4.2 Video Sentiment . . . 42
4.3 TV Content Characteristics . . . 44
4.4 Enriching the TV Content with Tweets . . . 46
4.4.1 Tweet Sentiment . . . 48
4.4.2 Tweet Characteristics . . . 50
4.4.3 The Number of Tweets . . . 51
4.4.4 Tweet Interestingness . . . 52
4.4.5 Tweet Effect on Valence and Arousal . . . 53
4.5 Social Media Findings . . . 55
4.5.1 Social Media Consumption Habits . . . 56
4.5.2 Sharing and Content Creation . . . 57
4.5.3 Retweeting Behaviour . . . 58
4.6 Multi-Screen Behaviour . . . 61
4.6.1 Tablet Interactions . . . 62
4.6.2 Distribution of Attention . . . 63
4.7 Companion Application Experience . . . 65
5 Discussion 68 5.1 Social Presence During Media Viewing . . . 68
5.2 Recommendations . . . 70
5.3 Evaluation and Validity . . . 71
5.4 Future Research . . . 72 vii
6 Conclusions 73 A Video Stimulus 84 B Background Questionnaire 87 C Post-Trial Questionnaire 94 D Post-Test Questionnaire 97 viii
Chapter 1
Introduction
From its introduction, television has prompted off-screen social engage-ment. At first though, television was considered to be a one-way media that isolated people. Yet, it is becoming increasingly difficult to ignore the social aspects that are built around TV and social media networks. Now, TV can be considered the trigger of 21stcentury “water-cooler-effect”.
Through the times technical development has changed the social scene. Today, handheld smart devices are a de facto. Tablet and mobile phones play an increasingly important role in our everyday lives, accompanying us almost everywhere. This can also be seen in TV watching habits. The latest number Rideout et al. [60] suggests that close to 70% of Americans use an additional device while watching TV. The same trend can be seen also in Finland Statistics of Finland [74].
In association with TV viewing, the industry has labeled these devices as “second screens”. This development have led to an increasing interest in creating new business models and services for these new platforms, most notably the introduction ofcompanion applicationsEvolumedia group [23]. This is a software designed to enhance the viewing experience by enriching the content and providing increased social presence and a possibility for a deeper insight in the topic Evolumedia group [24].
Regardless of the hype, the first generation of these applications have not been able to fully penetrate into the home audiences. Thus, content providers try to adapt and to develop the applications further in the effort of enriching the previously passive act of watching TV into a new more pleasing interactive media multitasking event.
The objective of this thesis is to find the answers to the following re-search questions by a experimental study: i) What are the effects of social presence on the viewing experience?, i.e. studying i.i)How does the social sec-ond screen content affect the viewing experience?and i.ii)How do people appraise
CHAPTER 1. INTRODUCTION 2
the new environment?
This thesis presents the findings of an experimental study on involving a TV-tablet second screen viewing session. Chapter 2 begins by laying out the theoretical dimensions of the research, and looks at how the second screen has been brought up in literature. Chapter 3 describes the methods regarding subjective testing and metrics used in the experimental phase. The chapter will then go on by describing the design and execution of the experimental phase. In Chapter 4 the most important findings are pre-sented in regard to the research questions prepre-sented.
The findings are considered in the light of the research questions in Chapter 5, where the a set of recommendations are presented to take into consideration when developing these types of applications. Finally, con-clusions are drawn in Chapter 6.
Chapter 2
Background
Some consider watching TV to be a passive activity. This might still be true for some situations or programs. Quite often though, people are not that deeply immersed in the program and this provokes other simultane-ous actions such as reading the program guide, talking or increasingly the use of a secondary device (laptop, tablet or mobile phone) [60, 82]. The multitasking environment pushes the boundaries of human cognitive ca-pabilities [49]. Multitasking environments have been reported to decrease the immersion and performance, yet media multitasking is attractive and rewarding for the viewer.
The last few years have meant a massive expansion for social network-ing sites. Social networknetwork-ing has penetrated to almost all parts of our every-day life [52]. The introduction of user-friendly and nifty handheld devices has now brought social media and TV viewing together, forming an inte-gral viewing environment and media experience.
2.1 Multitasking
Multitasking is the practice of processing multiple tasks simultaneously. It has been researched widely. Largely the results show that multitasking has a negative effect on task performance [1, 33, 38, 73]. Frequently reported findings are decreased memory performance and lesser immersion in tasks at hand compared to performing a single task at a time. Researches also highlight the negative effect of decreased information intake [49].
In contrast, some [54] underscore the positive effects on productivity and the welcome breaks during difficult tasks. Multitasking also allows ideas to mature while focusing on an alternative task at hand. Nonetheless, multitasking is here to stay, as we juggle with multiple tasks at home, at
CHAPTER 2. BACKGROUND 4 school and at work. An interesting conflict arises between the prevalence of second screen use and the frequently reported impacts on performance. Even though multitasking preference is individual, most humans tend to do multiple tasks simultaneously [56]. In addition, humans’ ability to multitask has adapted over the years as the society and technology around us have changed [8, 60]. Modern technology is built around the concept of multitasking: operating systems allow multiple simultaneous programs to be run, web browsers have implemented tabs to allow multitasking and now even the multimedia environment has seen changes that provoke mul-titasking [1].
At first, multitasking might sound as a simple concept to grasp, but as explined here, multitasking can be looked at from multiple perspectives and disciplines.
2.1.1 Human Ability to Multitask
Ravaja [57] presents the literature definition and successfully sums up es-sential findings regarding the properties of human attention. There, atten-tion is defined as the allocaatten-tion of limited mental resources to a specific stimulus. Further, attention can be divided into two groups, i.e. selective attention and capacity theories. Selective attention refers to the process of selecting certain stimuli for processing while ignoring others and capacity theories state that humans have a limited sized pool of attention to allocate resources from. In this thesis, the allocation of attention is defined by the media the participant chooses to follow.
Novak et al. [49] state that performing many simultaneous tasks re-quires more cognitive resources. The capacity theory is supported by the fact that multitasking gets increasingly challenging as the cumulative cog-nitive load, set by the tasks at hand, increases, i.e. as the cumulative task complexity exceeds the recourses available, human performance starts to suffer. As to multitasking capabilities, human performance can be increased i) by freeing cognitive capacity for task execution or ii) by decreasing the required cognitive load of a specific task.
Novak et al. [49] reported differences in recall performance of low and high recall messages across all memory measures. The results are in favour of the high relevance memory events. Free recall tasks have been reported to result in more errors during multitasking compared with single task execution.
Lang [34] introduces a theory on how cognition works. According to her, input is processed by three sub-processes: encoding, storage, and re-trieval. Encoding refers to selection of information from a stream or
me-CHAPTER 2. BACKGROUND 5 dia and then encoding it to a mental representation. Storage is the phase when the representation is stored in to the mind. Finally, retrieval is the re-activation of the mental representation. These tree processes work in parallel. It is also noteworthy that the overload of one sub-process may affect the others. Further, Novak et al. [49] point out that overloading the brain at the encoding phase is more harmful for retrieval tasks than in the retrieval phase.
Yerkes and Dodson [86] have created a model of how human perfor-mance is affected by arousal levels which is known as the Yerkes–Dodson law. This curvilinear (U-shaped) inverted model states that with both high and low arousal levels human performance is suboptimal and the most effi -cient performance levels are found with moderate levels of arousal. Arousal reflects the level of attentiveness and alertness. At low levels the perfor-mance is distracted by lack of alertness, at high levels the task is distracted by high level disturbing responses. The optimal performance point is char-acterized by just the right amount of alertness and relaxation as explained by Palladino [53].
2.1.2 Concurrent, Interleaved and Sequential Multitasking
Adler and Benbunan-Fich [1] state that the amount of temporal overlap can be used to categorize multitasking tasks in three ways: sequential, parallel and interleaved. Each stands for a certain degree of concurrency of the tasks.
According to Adler and Benbunan-Fich [1],sequentialmultitasking can be argued not to be multitasking at all as the next task starts once the previ-ous is finished. This does not fall in the category of traditional multitasking since there is actually no multitasking as no temporal overlap occurs. How-ever, it can be used as a baseline condition for comparison with other types of multitasking.
In interleaved multitasking, the task at hand is voluntarily or involun-tarily interrupted to allow the execution of another task. Later the original task is resumed, again voluntarily or involuntarily. An example of this type of multitasking is simultaneously making food and attending to a child.
Finally, duringparallel multitasking all tasks are handled at the same time. This way there is a maximum amount of concurrency. This is often hard to achieve, unless different types of attention are required, e.g. listen-ing to music and readlisten-ing.
One can consider second screening to fall in to the parallel category with some characteristics of interleaved multitasking. As two or more types of media are simultaneously consumed, interruptive events happen on both screens.
CHAPTER 2. BACKGROUND 6
2.1.3 Task Switching
Task switching is a well studied phenomenon. Multitasking performance is closely dependent on the cost of switching between different tasks. Over the years different models and theories have been presented to explain what triggers a task switch and how task difficulty level affects the switch. Human action is directed by goals set in our minds. These goals re-sult in tasks which aim to reach a predetermined goal. Salvucci and Taat-gen [65] claim that two different conditions are responsible for triggering possible task switches. The first is anexternal interruptionthat requires im-mediate attention resulting in a task switch. Now the task hierarchy is re-organized and the interrupted one is resumed later. The second possi-bility is avoluntary decisionto stop the ongoing task or take a break due to an obstacle that prevents the task completion. A new task is picked up to be continued with.
To apply these findings in a second screen scenario, attention drawing events targeted at any modality can be considered external interruptions. These could be the visual or auditive cue of an arriving tweet or the change of voice in the TV stimulus. Similarly, voluntary task switches can be trig-gered by boring TV or tablet content.
Altmann and Trafton [3] have introduced a theory to explain voluntary task performance and multitasking. It is called thememory-for-goals-theory and it defines agoalas “a mental representation of an intention to accom-plish a task, achieve some specific state of the world, or take some mental or physical action”. In order for a task switch to take place, the activation level of the goal at hand must be suppressed by the activation level of the rival goal in mind. This sets hierarchy for goals and task activation. The most recently activated goal determines the human behaviour.
Within the context of this thesis, the interest is in the self-interrupting conditions. Adler and Benbunan-Fich [1] have stated that there is not that much literature on discretionary task switching compared with the many studies on the interruptive counterpart. Though, Payne et al. [54] have found a tendency to voluntary task switch when the task at hand is no longer rewarding. In addition, Madjar and Shalley [39] report that people increased their creativity when they had an opportunity to switch tasks with specific goals. The switch allowed a break while continuing on the other task. With the increase in arousal they could focus better at the task at hand.
Adler and Benbunan-Fich [1] find voluntary task switching an interest-ing dilemma as to performance. On one hand, with a reasonable amount of task switches, people get additional stimulation and end up working
CHAPTER 2. BACKGROUND 7 harder which leads to improved performance and focus. On the other hand, intensive task switching may make the environment distractive, which leads to decreased performance and excessive arousal. The scope of this thesis focuses more on free time applications and gratification. Perfor-mance issues are not that relevant.
It is worth while to notice that the switching times are longer when switching between high complexity tasks compared with switching be-tween low complexity tasks as Rubinstein et al. [61] point out. As to the second screen viewing, the tasks can be considered as having quite a low complexity and task switch is thus quite inexpensive.
In previous research, Brasel and Gips [8] found that participants volun-tarily switched attention between a computer screen and television on av-erage 4 times a minute, in an experimental setup where participants were instructed to do whatever they pleased. They also found that gazes on computer screen lasted much longer than gazes directed on a television screen. In addition, younger people have a tendency to switch more fre-quently compared with older participants. However, other individual fea-tures such as multitasking preference and polychronicity (see Section 3.3.4) had little effect on how people behaved in the test situation.
2.1.4 Reasons for Multitasking
People have several reasons to do multiple tasks at the same time. Reasons for multitasking often relate to individual gratification, but also external factors, such as changes in media landscape, social norms and technologies encourage people to multitask [82]. These factors apply to media context as well. Here the viewing itself is most often related to seeking personal gratification and task switches are often influenced by external factors such as the content itself or social factors. As Montgomery [44] states, the media landscape is changing. Media is increasingly more important and integral part of the culture. The emergence of modern smart phones and social media is linking different media together and the changes “have spurred the proliferation of Web sites and other forms of new-media content”.
The uses and gratification (U&G) model is a framework for the internal reasoning behind multitasking and is often used to describe media mul-titasking. The original paper by Katz et al. [29] lists cognitive gain and affective, social, personal and relaxing reasoning as drivers towards mul-titasking. These give plenty of reason for media consumption and media multitasking. For a more detailed view on U&G, see Section 2.4.4.
Viitanen et al. [82] summarize several studies that all agree with indi-vidual reasons for the U&G framework. In addition to the above it has been
CHAPTER 2. BACKGROUND 8 reported that a non-media task can be made more multitasking friendly by adding media multitasking elements to it. Computer multitasking has also been explained with habitual use and convenience. The use patterns of human-computer interaction are explained in more detail in the work of Katz et al. [29]. The U&G theory has later been frequently applied to media research as seen in the work of Wang and Tchernev [83] and Ruggiero [62]. As explained by both Bluedorn and Jaussi [6] and Rideout et al. [60], many people also experience a gratifying feeling of increased efficiency when squeezing more media into to the same amount of time. Moreover, Ballagas [4] points out that the simultaneous use of both traditional and social media can also be seen as an outcome of people trying to accomplish traditional face-to-face communication over a distance.
Cognitive reasons have been found to be the foremost driving factor in multitasking. Wang and Tchernev [83] state that emotional needs may be indirectly satisfied even though this is not a goal while multitasking. This may even explain the tendency towards habitual multitasking.
In addition to the internal drivers, external factors also play a big part in media multitasking behaviour. McDonald et al. [42] have done a histor-ical review of multitasking behaviour, explaining that as long as electronic media have been around, things have been used to escape boredom during household chores. First it was radio, followed by television. The mobile era has taken media multitasking to a whole new level. D’heer et al. [20] point out that tablets and smart phones are an integral part of many everyday ac-tivities. Followed by the statement made by Carrier et al. [11] this confirms that the growing trend is still continuing, the constant raise of electronic media is driving people to multitask.
2.1.5 Media Multitasking
Media multitasking is defined in literature [49, 79] as the act of finding and consuming multiple media simultaneously. In this thesis the same definition is followed. Further, in this thesis media defined as any channel through which content can be absorbed, i.e. news, entertainment, educa-tion, data or promotional messages.
Rideout et al. [60] have evidence of this phenomenon in practice. Stud-ies have shown that media consumption have been increasing constantly over the 20th century. Now American youths consume media services 10 hours 45 minutes a day. Surprisingly the actual time spent in these media activities is just 7.5 hours a day. This means now more media is being con-sumed over a shorter period of time. In addition, the study reminds that the well known negative effects of multitasking on human performance
CHAPTER 2. BACKGROUND 9 can also be seen in media multitasking.
Another viewpoint is provided by Ballagas [4]. He states that tradition-ally media multitasking has been thought of as very similar to any kind of multitasking, which means that every media is a separate task. This is, however, not always the case. Adding a new media to pre-existing ones cannot always be considered a new additional task from which to switch back to the pre-existing ones and back again. As stated by Ballagas [4], me-dia multitasking is more about directing attention. That may even be an advantage in task solving and collaboration. This is why content creators and designers utilize media multitasking when introducing new designs, which leverage the advantages of the human multichannel media capabil-ities.
On the other hand, Novak et al. [49] consider that characteristics in me-dia multitasking are the same as for any other multitasking situations with the exception that one media is usually considered as a primary media. The motivation to consume and process the secondary media is often to support the primary media. The possible distractive properties between the two media are less clear compared with other types of multitasking.
Another characteristic of media multitasking is the continuous simul-taneous exposure to several information streams, which results in divided attention at the encoding stage. Therefore media multitasking is likely to decrease memory performance as explained in Section 2.1.1.
Reinsch et al. [58] introduce the term multicommunicating to describe multiple overlapping conversations. This phenomenon is increasingly more common in the hectic technology enriched 21st century media and office
environments. It is also an indirect implication of ever increasing media presence Cameron and Webster [10], Reinsch et al. [58].
Reinsch et al. [58] claims that multicommunicating is an unintended use of new technology use (chat, email, etc.), that allow a flexible tempo in the communicating scheme. Social norms like productivity and efficiency, which encourage speed and interpersonal accessibility have made us more tolerant to divided attention and to a certain extent even delayed responses. Within some types of tasks and communicative situations this is even desir-able to allow counter-parts to think about how to respond to the situations. Research also concludes that multi-communicating requires a special skill set. In addition to know how to operate the technical device, the user needs to feel the sensitivity of certain tasks and situations.
Multicommunicating skills can be considered essential in conversations taking place in situations where conversations span over multiple media or while consuming multiple media streams, such as a second screen TV viewing situation Cameron and Webster [10], Reinsch et al. [58].
CHAPTER 2. BACKGROUND 10
2.2 Second Screen
The term second screen is used to refer to a computing device that is able to enrich the viewing experience that happens via a primary screen, most often a TV. Technological development has introduced a new generation of smart devices that allow broadcasting companies to take the viewing experience even further by providing applications to enrich specific pro-grams. Sharing user-generated media has been an increasing trend and of human interest. Services such as YouTube, MySpace, Flickr are good ex-amples. Following this trend and human social needs [89], social shearing of broadcast contents have increased. This has given TV viewing a new twist by taking off-screen activities to a whole new dimension.
Cesar et al. [13] have found four major second screen activities: control, enrich, share andtransfer. Control refers to the use of the second screen as a control device of the media stream. Enriching means bringing in more content related media, such as commentary audio or additional informa-tion articles. Sharing denotes the social aspects and finally transfer refers to the plausible transition of the second screen turning in to the primary device. This thesis focuses on sharing and enriching, more specifically on the social interactions created by a second screen device.
2.2.1 Second Screen in a Media Environment
When studying literature it can be noticed that the concept of the second screen is not just a 21th century phenomenon. Cesar et al. [13] have found evidence of second screen TV viewing concepts dating back to 1996. In their review Cesar et al. [13] list several use cases for the second screen. The following use cases have been suggested: learning, content selection, providing content related extra information, electronic program guides (EPG), volume control and navigation, advertisement and commerce, and user participation (voting, chatting, affecting the narrative). Controlling the main screen with a second screen like device is prototyped by Choi et al. [16], who also presents encouraging results of a user study based on the prototype. Hess et al. [26] also recognise the interconnectedness of the devices. They state that a second screen gives easy access to enriching content related to the TV. Second screens are also capable of providing a personalized viewing experience.
The personalized media experience is often underlined. As a mobile device, the second screen also presents a possibility to enable viewing in situations previously impossible. Cesar et al. [13] also report that users
CHAPTER 2. BACKGROUND 11 prefer to view different media on different screens, not to overload a single display while media multitasking. What has previously been done in the field of interactive TV, the solutions have only been limited to the use of on-screen display solutions.
Cesar et al. [13] have visualized the second screen environment as a media sphere. This sphere can consist of several devices: television, set-top-box, portable media player, mobile phone, a tablet or any other inter-active device found in the home environment. Note the lack of hierarchy, this model does not place a device above another. One main concept is that these media spheres have communicative capabilities, enriching each other. To conclude, any handheld device with rendering and interaction capabilities can act as a screen.
2.2.2 Introduction of the Tablet — a New Environment
Müller et al. [46] found that after the introduction of tablets, tasks per-formed on mobile phones and laptops have been migrated and replaced by tablets in some use cases. Tablets are often used only at home while mobile phones are always carried around. Tablets are preferred over lap-tops because they are lighter and do not run hot. This is why tablets are replacing laptops as a second screen device and bringing computer use to environments previously not possible such as beds.
The same study [46] on tablet use reports that tablets, if used as pri-mary screens, have a heavy tendency to be used for media viewing in ac-tivities such as reading books, news, watching videos and playing games. The three most frequent actions performed on a tablet are checking emails, watching videos and social networking. This is done while waiting but also while performing some other duties such as cooking. All in all, only a fraction of the reported tablet use is focused on work-related tasks. Sonera Oyj [72] carried out an interview study about Finnish media use and found that mobile devices are frequently used for TV viewing in situations where a traditional TV is not available, e.g. during holidays, when the TV is occu-pied, when a program is discussed with a friend, and in public transport.
The tablet also changes existing practices such us personalizing the view-ing of broadcast TV, as explained by Hess et al. [26]. Müller et al. [46] mapped situations where the tablet was used for secondary activities. The most reported use case was to support watching TV. Participants of the survey reported that “their tablets can enhance the TV experience by ex-tending that activity through, for example, looking up related information about the program that they were watching”. This justifies the selection of a tablet device to be used in the experiment.
CHAPTER 2. BACKGROUND 12
2.3 Increasing Media Consumption
The emergence of new smart devices and the availability of fast mobile internet connections has led to changes in media consumption. Traditional media has moved online and the use of social media has picked up its pace. This combined with increased use of mobile devices results in media being ever more present.
Studies (Rideout et al. [60]) and statistics (Statistics of Finland [74]) show that computer use has increased rapidly over the past few years. In Finland [50, 74] the growth has nearly saturated as yearly growth has lately been only marginal. The same sources show that changes in society have also led to more free time compared with what was two decades ago. This free time has provoked increased media consumption. Though challenged by increasing computer use, Finns still watch TV more than two hours a day. What is notable is that the role of a traditional TV set is challenged by com-puters, as a result of which viewing takes place increasingly via computers. Statistics [51] show that the daily internet use in Finland is very active, but the growth is minimal as most people already have access to it. Some growth can still be seen in homes where new devices, such as tables and smart phones, and services, such as social media and transition to online newspapers, provoke internet use. Further, the role of the traditional desk-top computer has been taken over by lapdesk-tops.
2.3.1 Social TV
As with many other media, also television, has adapted itself to the 21st
century changes. Rideout et al. [60] report increased sociability. This can be seen in the increased online content provided by broadcast companies and in the emergence of new types of TV shows (such as YLE Uutiset suora linja1) where viewers have a very active role. The program solely builds
upon tweets sent around a timely topic. Viewers are also frequently en-dorsed to contribute. One way of doing this is to let viewers vote for today’s good news to receive a few seconds of fame.
In addition, in the United States TV series have lately been provided with a hashtag to be used on Twitter in order for online societies to follow. These discussions, as reported by Twitter [80], often help viewers to dis-cover new content and deepen further the engagement of viewers already familiar with a given TV program. In Finland, the national broadcasting company YLE even provides rules [88] for online etiquette.
CHAPTER 2. BACKGROUND 13 As The Nielsen Company [75] states, the amount of online presence in a show strongly correlates with the number of ratings it gets. This correlation is most likely to be a result of the rise of second screen viewing. The effect is profitable for both parties: this can be seen throughout the season in the consistent views of episodes and consistent amount of tweets as well. In Finland the critical user mass is not yet to be reached regarding Twitter presence. Some arguable exceptions still exist likeSuora linjawhich seem to have quality Tweets present online.
2.3.2 Interactive TV
Interactive television (iTV) refers to systems that make additional infor-mation available via a TV screen. The inforinfor-mation may include, e.g., an electronic program guide (EPG). An interview study by Cruickshank et al. [18] brings forth how people perceive iTV. The study lists phrases like ‘in-teracting with friends’, ‘more options’, ‘select and control’, ‘saving time’, ‘more information’, ‘personal service’, ‘giving you choices’ mentioned by the test persons when asked to describe the situation. The early imple-mentations featured in the study were designed in an on-screen fashion, i.e. the interactive menus were presented as an overlay on the primary screen. This blocked partly or fully the primary media. The usability of these systems was often frustrating: navigating through the content was often slow and clumsy, the remote control devices were not designed for proper interaction. Often the same information was available elsewhere e.g. in prints more quickly. These are considered as reasons why many iTV implementations failed, as summarized by Cruickshank et al. [18]. The tablet has provided a solution for increasing the usability, as explained in Section 2.2.2.
As explained by Simon et al. [71], it is possible to remove the conflict between the core functions of TV systems and the supporting auxiliary content, by using a second screen to display the iTV content. Thus it is pos-sible to display additional content without disturbing the TV by occupy-ing screen space on the primary screen. This second screen approach also provides a possibility to implement richer interaction mechanisms com-pared with classical implementations relying on a TV remote as the control device. Current second screen devices (tablets, mobiles) provide a much higher physical resolution and a unlimited portability. In addition, the sec-ond screen provides a more intuitive and pleasant way for the viewer to interact in comparison to the traditional infrared remote.
CHAPTER 2. BACKGROUND 14
2.4 Social Presence
Media research and social processes provide us with theories to explain the key elements of social media. Thesocial presence theory(Short et al. [70]) describes the media element of social media, stating that different media differ in “social presence”. Here, the level of social presence is defined as the degree of visual, acoustic, and physical contact that can be achieved between the two communication partners.
According to [70], social presence can be considered as the product of intimacy and immediacy of the medium. Thus a high social presence is achieved in situations where intimacy is high and immediacy is low (e.g. face to face conversation). A lower social presence can be expected in highly mediated (low intimacy) situations such as a phone conversation or more asynchronous (high immediacy) situations as an email conversa-tion. A higher level of social presence results in higher influence between communication partners and their behavior.
Another way to measure and classify media is to use themedia richness theoryas contended by Daft and Lengel [19]. This theory states that the goal of any communication is to resolve ambiguity and to clear uncertainty, thus differing media by its richness, of information it is capable of transmitting. Goffman [25] has explained the concept of self-presentation where peo-ple have a tendency and a desire of controlling the impression other peopeo-ple form of themselves in face to face interaction. Electronic communication has brought along a range of new communication methods and developed a new communications etiquette, yet the same desire of control remains, as stated by Miller [43]. The controlled self-presentation is done to gain reward, e.g. to form a positive impression among friends, with the inten-tion of forming an online image consistent with one’s personal identity. This self-image is created through controlled self-disclosure as explained by Schau and Gilly [67]. Things that build up this image are thoughts, feelings, likes and dislikes people share while communicating. These are factors that can be considered as driving forces behind decision making in what gets shared on social media.
2.4.1 Social Media
As explained by Kaplan and Haenlein [28], the concept of social media is far from new. From its creation internet has seen many services allowing user created content to be made, e.g. Usenet, different bulletin boards and blogs leading up to social networking sites such as MySpace and Facebook
CHAPTER 2. BACKGROUND 15 with others. The latter coined the term “Social media” and contributed to the prominence these services have today.
Mangold and Faulds [40] state that the last few years have been a mas-sive expansion for social networking sites. They have penetrated to almost all parts of our everyday life. Now social media is also an integral part of companies’ promotional mix. This has been adopted also by broadcasting companies by adding new social activities to support the viewing expe-rience. The industry seems to have chosen Twitter as the social media of choice probably because of its simplistic nature of short and open messages with the possibility of tagging topics, which is ideal to go with TV viewing. For some time now, TV viewers have been provided with content related topics to promote online discussions and to gather interested people to join the discussion off-screen. Some channels have even made new program concepts almost fully dependent on what has been discussed online such as YLE Suora linja.
Marwick et al. [41] explain that people have a sense of audience even in online conversations and of presence dictating how they present them-selves in these situations. Job interviews and night bars have all their norms and expectations. Also social media has its own imagined audience which people adapt our behaviour to.
Further, Thelwall et al. [78] state that Twitter may be a way to satisfy unrelated goals such as to create humour, show analytical skills or declare moral perspectives during TV viewing. As said in Section 2.4.4, the uses and gratification (U&G) suggest that people do not passively consume me-dia but actively select and exploit it for their own goals.
2.4.2 Social Media Habits in Finland
According to Statistics Finland [50], four out of ten Finns contribute to some sort of content creation by writing on the internet. As online bul-letin boards, blogs and commenting news sites draw most of the online activity, most of online content creation takes place in some sort of social media service. In the spring of 2012, half of the population in the age group of 16-74-year olds had registered on some social media site. Nearly all of those registered also follow those services. The most popular service is Facebook.
The use of these services is very age-dependent. The younger popula-tion is more frequently registered users and they also use the media more frequently. Out of the 16-24-year olds 86 per cent had been active in social media. The same number in the group of 55-64-year olds was only 22 per cent. What comes to social media, the behaviour is not notably different
CHAPTER 2. BACKGROUND 16 between the sexes.
The same age-dependent trend is seen in the United States and the UK in a study by Lenhart et al. [37], where Facebook is used more actively by young users. However, Twitter is the choice of elder people. The same trend might well apply to Finland as well, as explained by the lack of Twit-ter activity. This is further explained by the small national population, re-sulting in a small pool of Twitter messages per program.
2.4.3 Twitter
Twitter is a well-established micro-blogging site as explained by [15]. The messages posted (tweets) in this service are short, limited to 140 characters. The service is considered as a social networking site as each member has its own profile and members can be "friends" with other people by following them. Regardless of that, all the messages posted on the site can be seen by everyone.
Television and Twitter are frequently combined [14, 15, 75, 78, 87]. Both domestic and international broadcasting companies consider Twitter as the de facto social media platform for TV, most likely due to the nature of com-pact and public messages. Twitter can be considered as an industry stan-dard and a good reason for choosing it to represent social media in our experiment as well.
In order to understand the Twitter environment, it is essential to know some terminology associated with the service. Firstly, hashtag, identified by “#”, gathers all tweets associated with a specific word. E.g., “#thesis”
gathers all thesis related tweets. This meta information is used to mark top-ics, helping people to navigate and follow the topics. This also emphasizes the typical features of wide communication.
Secondly, user mentions, are represented by @-prefix. With user
men-tions, members can address other registered users of the service.
Finally,retweeting, as explained by [78], is a method of disseminating a tweet by reposting it. The aim of retweeting is to spread a tweet the user found valuable or worth highlighting for some reason. If a tweet goes viral, the retweeting of this tweet can be very rapid.
2.4.4 Modelling Needs and Fulfillment
The uses and gratification (U&G) model is a traditional way of modelling human media use. U&G tries to answerwhypeople do what they do with media instead of what media does to people (’media effects’). Media re-search has been using U&G in a broad manner trying in general to answer
CHAPTER 2. BACKGROUND 17 the questionwhatpeople do with media, allowing a range of interpretation and responses.
As explained by many [29, 35, 62], U&G originate from social sciences, and it presents the use of media to fulfill personal social and psychological needs. Gratification can be obtained from a specific content or medium (TV programs), media (social media, newspapers etc.) and social content (watching TV with friends).
U&G argues that individual needs specify how people use a specific media they have chosen. Bryant and Zillmann [9] have noted that mood influences the choice of media. Stressed people are likely to choose a relax-ing content and bored people are likely to choose an excitrelax-ing media. The same media may gratify different needs in different people.
A typical U&G study is likely to use self reporting data to explainwhy
the observed behavioural patterns appear. This is why the U&G method-ology has also raised some criticism. Viewers might not now why they did the choices they did. The answers might also not be that clear and in-fluenced by explanations heard from others. Media is often forced upon people and in this way not conscious and active choices that they are ex-posed to [79]. This research indicates that media use can be used as a result of addiction.
Chen [15] describes U&G as a model for media use. A need is defined as disequilibrium of internal and external occurrences that strive for equi-librium. That is, if people have a need, they seek to gratify it. U&G means that multiple media compete for human attention and that people select the medium that best meets their needs, which might be a need for infor-mation, a desire for emotional connection.
In addition, Chen [15] lists several studies where U&G has been suc-cessfully used to explain behaviour on the web, social media and media use. This is supported by the fact that U&G strives for a model on what people do with media, not what media viewing does to people. If people are given a possibility to pick any media and to stay with it, U&G states that it must satisfy their needs.
With the above and the interruptive customs of second screen explained in Section 2.1.2, it can be argued that people do the things they prefer and which give them the greatest satisfaction possible.
2.4.5 Current Implementations
Some commercial second screen applications have already emerged and the user base seem to slowly expand. PC Magazine [84] listed the 5 greatest second screen apps in late 2013. Moreover, Evolumedia group [23] has also
CHAPTER 2. BACKGROUND 18 done a survey on the present companion applications. According these sources, the three most widely used second screen applications after Face-book, Twitter and Shazam2were Yahoo IntoNow3, GetGlue4 and ZeeBox5.
The two first mentioned had at that time 3 million users. ZeeBox, with a million users in late 2012, was estimated to reach 6 million users after its American introduction. America really seems to be the home of second screen viewing, as most of the companion applications mentioned here op-erated in the United States with the exception of ZeeBox originating from the United Kingdom.
Features included in these companion applications range from audio based program recognition to rewarding the users with virtual prizes, pro-gram related social content feeds, and lately even meta data listings. Most of the programs are available on the majority of the mobile and tablet plat-forms which include Android and iPhone. ZeeBox feature support Ama-zon’s Kindle e-reader and a web interface accessible via a browser.
These are generic companion applications working together with many TV programs. In addition to these, there are program specific second screen applications. These dedicated applications feature the most customized and targeted content. It is also the most expensive way of reaching mul-titasking TV viewers. On the other hand, the dedicated applications offer the best possibilities for monetization via advertisers and sponsors [23, 24]. The companion application used in the experiment was designed to mimic the features of a more common companion application. Program specific content was provided through medias already known by the par-ticipants. These details are presented in detail in Section 3.1.3.
2 A music-recognition application 3 http://www.intonow.com/ 4 http://getglue.com/ 5 http://zeebox.com/
Chapter 3
Experiment
This chapter describes the design of the experiment. The experiment was designed in order to answer the research questions presented. As control-ling the second screen content was essential, this requirement was taken as the basis for the design. The display of the second screen content was based on four second screen content conditions. The stimuli used consisted of both TV and second screen content. Eight video clips of nationally broad-casted television was used as the main screen content. And as the second screen stimuli, tweets and articles of additional information related to the program were used. This made a total of four different second screen con-tent variations as listed below. If present, the second screen concon-tent was displayed throughout the whole trial.
I TV content + 2nd screen: no content
II TV content + 2nd screen: additional information
III TV content + 2nd screen: social media
IV TV content + 2nd screen: as in II and III combined
Out of the conditions listed above four condition sets were gathered. These condition sets consisted of a predetermined combination of the four possible second screen conditions. This way one participant was exposed to all of the possible second screen content conditions during the experi-ment. Each participant was shown the stimuli in a randomized order ac-cording to the stimuli combination determined by the condition set. With this design all stimuli combinations were shown after every fourth par-ticipant. Ravaja [57] has given advice on how to conduct psychophysical media studies and these guidelines were pursued.
The experiments were performed in a room dedicated to visual testing at the Department of Media Technology. This is a controlled environment,
CHAPTER 3. EXPERIMENT 20 that has previously been used to perform similar experiments within the department.
In between the stimuli each participant did self-reporting (see section 3.3 and appendix C for details) on how they experienced the situation. Ad-ditionally, in order to capture both objective emotional information (arousal and valence) and the distribution of attention between the two devices each participant was monitored for psychophysiological signals in addition to wearing eye-tracking glasses.
The additional information mentioned was used as stimuli for an other thesis done in parallel with this work. This other thesis [31] studied how accompanying fact-based articles on the second screen affects the viewing experience. The additional information provided consisted of Wikipedia and YLE news articles.
3.1 Experiment Design and Environment
The aim of this section is to lay out in detail the experimental set-up. The following subsections will present the devices, environmental conditions and software used. Figure 3.1 shows a participant seated during the exper-iment.
3.1.1 Hardware
In the experiment a Samsung Galaxy Tab 2 Android 4.0 -tablet Samsung Electronics Co., Ltd. [66] was used as the second screen device. This model had a screen size of 10.1 inches with a resolution of 1280⇥800, resulting
in a pixel density of 149 ppi. When the device showed total black, the light emitted from the display was 0.20 lux, while the full white the amount of light emitted was 130 lux.
In order to alleviate the later analysis of the Eye Tracking Glasses (ETG) data, the tablet was fastened in an adjustable table mount in front of the subject. Upon introduction, the participants were asked to adjust the tablet screen to enable pleasant viewing, but at a minimum distance of 40 cm as dictated by the limitations of the eye-tracking glasses [69].
A Sony 40” FullHD (1920⇥1080) LCD-TV (Sony KDL-40HX800, 240Hz)
was used as the main screen. Illumination readings of 0.0 lux was mea-sured when displaying black and 160 lux showing full white. The TV was stationed at a distance of approximately 200 cm depending on how the par-ticipant chose to sit on the chair. The rooms light was adujsted to accom-mondate pleasent viewing of both screens. This complied with the ITU
rec-CHAPTER 3. EXPERIMENT 21 ommendations International Telecommunication Union - Radiocommuni-cation Sector [27] for visual testing.
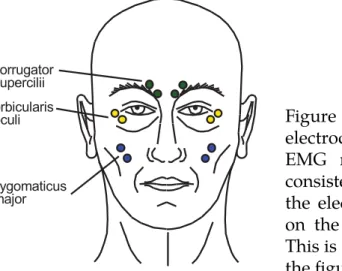
Psychophysiological data was collected using Varioport, a portable biosig-nal recorder by Becker Meditec, Karlsruhe, Germany. This device is capa-ble of recording EMG (Electromyography), EDA (Electrodermal Activity) and HR (Heart Rate) signals at a 16-bit resolution and a sampling rate of 2 kHz. Gaze tracking was done with SMI1 Eye Tracking Glasses. These
glasses carry tree cameras: two capturing the pupil movements at a sam-pling rate of 30 Hz, the third capturing the scene at 24 frames per second.
Figure 3.1: A participant seated during experiment. All sensors and both the tablet and TV can be seen in the picture. The tablet was mounted in front of the participant for easier gaze tracking.
3.1.2 Environment
The room was lit with fluorescent ceiling lights varying between 73 lux (both displays displaying black) to 125 lux (both displays showing white). These measures where taken from where the participants were seated, fac-ing in the direction of the screens. The walls of the room were covered
CHAPTER 3. EXPERIMENT 22 with mid gray curtains to ensure a neutral viewing environment. The room was located by a peaceful corridor with all windows blocked with curtains. Signs indicating a ongoing experiment were posted outside instructing by-passers to keep quiet. To ensure a completely distraction-free environment the participants wore headphones to block occasional loud noises coming from other parts of the building.
3.1.3 Software
As stated previously, the test environment consisted of several devices that all needed to be synchronized for precision timed stimuli display and data recording. A desktop computer controlling the experiment procedure served as the main hub for all the separate devices. In addition to controlling the display of TV and tablet content, it also recorded participant interactions with the tablet and the data sent wirelessly by the Varioport measuring device.
Furthermore, a laptop specifically set up for recording the data from the eye-tracking glasses was also used to access the experiment manager. The post experiment questionnaire (appendix D) was filled in on this lap-top. The well planned and executed implementation of the experiment manager allowed easy and consistent trials. Only the eye-tracking soft-ware needed to be manually operated because of the lack of a sufficient Application Programming Interface (API) access.
The software allowed us to meet the requirements set by Ravaja [57] re-garding research involving psychophysical measurements. Strict require-ments apply to the synchronisation of stimuli presentation and the record-ing of the psychophysical data. To allow analysis between many different measures there must be a way to precisely link psychophysical events with each other and the events in the stimuli.
All of the above was hidden from the participant, who only saw the tablet interface depicted in Figure 3.2. Efforts were made to make the sec-ond screen application as user friendly as possible in accordance with fa-miliar use patterns seen in many existing touch screen applications and in accordance with Nielsen’s [47] usability guidelines.
New content appeared on top of both the tweet and the article feeds as older items were shifted out of sight at the bottom of the screen. Each arti-cle could be opened by pressing the items now appearing in full length in the middle of the display area. Tweets were rendered in the same manner as they appear on Twitter’s website2. Tweets could also be re-tweeted in
the same fashion as in the real service.
CHAPTER 3. EXPERIMENT 23
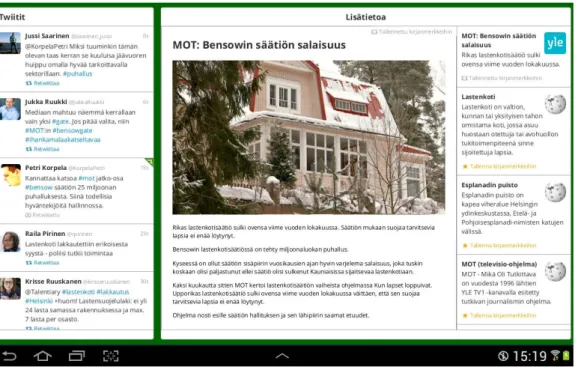
Figure 3.2: Screenshot of the user interface as shown on the tablet device when both tweets and articles are displayed. Tweets can bee seen listed on the left. Additional information is on the right on topic level. Once opened individual articles can be freely read in the middle of the screen.
3.2 Stimuli
To answer the research questions presented in the introductory Chapter 1 as comprehensively as possible a set of four program genres were cho-sen: magazine, documentary, reality and sports. These could further be grouped into two, fact and entertainment. Two programs were chosen to represent each genre. This summed up to eight different stimuli. In the stimuli selection, efforts were made to make the range of program pace and intensity as wide as possible. This way the effects of the second screen application could be monitored in as many situations as possible. Clip length was chosen to be around 5 minutes, long enough to allow sufficient engagement into the stimuli and to be sure to reliably capture psychophys-iological measures. The five minute time frame is considered of sufficient length by previous experiments [33].
Stimuli selection was to some degree dictated by the low amount of TV related tweeting in Finland and the fact that Twitter search API only provided a shallow access to the tweeting history. This led to TV content
CHAPTER 3. EXPERIMENT 24 being selected based on the number of twitter messages available once the predetermined tweet gathering period had finished.
As this fact set the order of procedures, a preliminary list of programs was put together with the help of the TV schedule and the program guide, followed by figuring out appropriate keywords to use for finding program specific tweets. With the keywords list ready, collection of tweets could be started with scheduled polling script.
There are some programs that provide a hashtag for user interaction on Twitter. This enables easy on-line discussions to form around a program. This also enables the broadcasting company to build programs tightly linked with viewer tweets. Examples of these are ”Pakko Tanssia”, a dancing con-test, and ”Suoralinja”, an interactive news program based on strong viewer interaction. Respectively, there are more traditional programs with almost zero activity on Twitter (documentaries). Yet even programs with strong Twitter promotion got very few tweets directly linked with the program. It is thus clear that Finnish tweeting habits are far behind in comparison with tweeting habits in countries with a larger population. It remained unexamined whether the reason for this is the population or the tweeting habits.
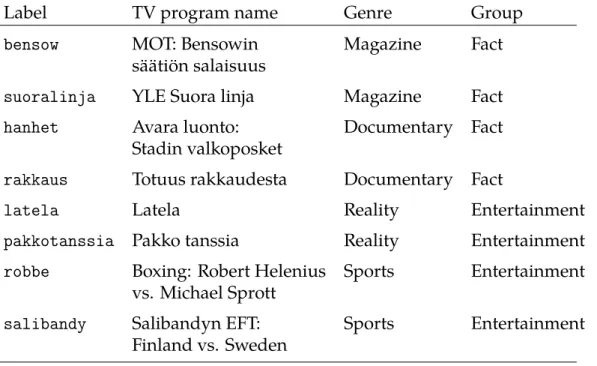
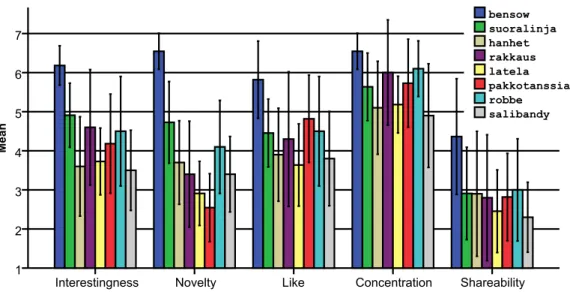
Table 3.1: List of TV stimuli used in the experiment. A more detailed listing can be seen in Appendix A.
Label TV program name Genre Group
bensow MOT: Bensowin Magazine Fact
säätiön salaisuus
suoralinja YLE Suora linja Magazine Fact
hanhet Avara luonto: Documentary Fact
Stadin valkoposket
rakkaus Totuus rakkaudesta Documentary Fact
latela Latela Reality Entertainment
pakkotanssia Pakko tanssia Reality Entertainment
robbe Boxing: Robert Helenius Sports Entertainment
vs. Michael Sprott
salibandy Salibandyn EFT: Sports Entertainment
Finland vs. Sweden
CHAPTER 3. EXPERIMENT 25 programs to show, mainly based on the tweeting activity. Table 3.1 lists the selected TV programs. A more detailed listing can be found in the Appendix A. Label presented in the above table are used throughout the text to compactly refer to each program.
Partnering in the NextMedia research project, the national broadcasting company Yleisradio (YLE) provided the stimulus used in highest possible broadcast quality. As some programs were delivered in high definition (HD) and some in the lower resolution standard definition (SD) all video clips used as stimulus were rendered into SD.
In order to understand what effect the stimuli have on the participants, reference affective values were needed. Thus both tweets and television programs where validated as explained in the following sections.
3.2.1 Video Stimuli Ground Truth Collection
Baseline affective values (the ground truth) of the stimuli were needed in order to compare the different experiment conditions. For this purpose a tool was made allowing simultaneous capture of valence and arousal val-ues over the temporal dimension. In this thesis, the action of collecting the ground truth data is referred to asvalidation.
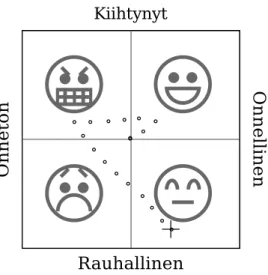
This tool combined the two SAM (see Section 3.3.2) scales into one two dimensional area, as shown in Figure 3.3. The method allowed free move-ment across both scales. In order to lower the cognitive load familiar smiley faces were selected for reference in each quarter. The persons doing the val-idating were instructed to refer to original SAM guidelines for emotional definitions and the use of the scales.
Figure 3.3: The two-dimensional validator interface. Arousal was measured on a scale from aroused (kiihtynyt) to calm (rauhallinen) and valence from happy (onnellinen) to unhappy (onneton). The cursor is depicted as a cross-mark, the dots are recorded values.
CHAPTER 3. EXPERIMENT 26 The tool was implemented as a website, and it was accessible online. This gave the validators a possibility to choose the validating sessions freely over the course of a few weeks. Validators were instructed to assess each video according to what they felt during viewing. Video playback started when the mouse button was held down in the validating area. This choice was made to make sure that the person validating was alert and focused on the task. The window playing the video was situated right above the validating area. Videos were played in a random order to each validating person.
Each video stimulus was validated with this tool by five co-workers from the research group. After visual inspection of the plotted data this was considered a large enough sample group for the purpose at hand to consider results trustworthy. For the outcome, see section 4.2.
3.2.2 Tweets
By the time of writing, Twitter.com search API only offered a shallow access to the tweet history. This practice forced to develop methods for capturing tweets over a period of time. A set of command line tools was written to enable automated capture and storage of tweets.
A job scheduler ran the tweet collector every hour to collect new tweets and stored them in a local database with all the available meta data asso-ciated with each individual tweet. This method allowed us to monitor the accumulation of tweets for each candidate program and to choose the final TV stimulus at a later stage.
Once a list of candidate TV programs had been chosen to use as stimuli, a list of hashtags associated with each program was prepared. Some of the TV content did not offer a hashtag to go with the program, this led us to choose hashtags we felt best represented the programs. This list of hashtags was fed in the tweet collecting tools mentioned above.
Xu and Croft [85] describe a query expansion method where a query is initiated with a set of keywords followed by a query expansion using an expanded set of keywords found in the results of the initial query. The final set of tweets was gathered with this method in cases where the first query round did not result in a sufficient amount of tweets. In all cases two query rounds resulted in a sufficient set of tweets.
A chose was made to unify the tweets by selecting only tweets writ-ten in Finnish to remove the possible complication of multiple languages. Also the tweets containing images were ruled out and any external URLs were removed from all of the selected tweets. Finally tweets that were the least related to the program were manually removed. Further manual
pro-CHAPTER 3. EXPERIMENT 27 cessing was needed when a similar tweets per minute ratio was tried to be reached for all the programs still paying attention to the natural genre spe-cific differences. Similarly, the tweets least related to the TV content were removed.
3.2.3 Sentiment Analysis of the Tweets
Previous research (Laine-Hernandez et al. [33]) has found a significant ef-fect of tweet sentiment on the viewers during TV viewing. Negative tweets can lower the viewing experience of positive content as well as positive tweets can improve the experience of negative content. This in mind, in order to interpret the data collected in the experimental phase, the tweets being part of the stimulus, a sentimental analysis was required.
As summarized by Thelwall et al. [77], literature knows several terms used to describe different types of emotional analysis. The termsentiment
refers to splitting emotions into positive, negative and neutral. This should not be confused with emotionwhich refers to the affect of sentiment (e.g. happy, sad etc.). As explained by Thelwall et al. [78], a third term used in literature is Opinion Mining, which refers to finding sentimental opinions from unstructured text, for applications such as determining movie popu-larity through online comments. Opinion mining is usually just meant to detect sentiment (negative or positive), not the strength of the sentiment. Opinion mining also refers to more advanced applications such as to iden-tify if statements are subjective or objective.
Initial tweet analysis was done with SentiStrength (Thelwall et al. [77]), a tool developed for short online messages. The algorithm, initially devel-oped for English, had a Finnish translation made by Dr. Kakkonen3.
SentiStrength was developed to classify MySpace4 comments. These
comments contain informal language such as slang and abbreviations. To exemplify creative online spelling the messages may include emoticons like
:-)and stretching of words by misspelling them (e.g. ”haaaapppyyy”)
giv-ing these a higher valence. These characteristics are also frequently present in tweets. Thelwall et al. [77] found that SentiStrength was able to classify the messages with sufficient accuracy.
To score sentiment SentiStrength introduces a five-point scale for both positive and negative sentiment. The final sentiment score is derived from these two figures. The algorithm reports values for negative and positive
3 Dr. Tuomo Kakkonen, Joensuu University, Finland
http://cs.joensuu.fi/~tkakkone/