600 800 1000 1200 1400 1600 1800 2000 Ja n -14 Ma r-14 Ma y -14 Ju l-14 Se p -14 Nov -14 Ja n -15 Ma r-15 Ma y -15 Ju l-15 Se p -15 Nov -15 Ja n -16 Ma r-16 Ma y -16 Ju l-16 Se p -16 Rp Share Performance (%)
Month Absolute Relative
3m 2.9 -0.5
6m 12.1 1.5
12m 63.7 48.7
Bank Tabungan Negara
Kinerja 9M16 solid didukung KPR subsidi
Laba bersih Rp1.62tn sesuai dengan estimasi konsensusBTN melaporkan laba bersih 9M16 sebesar Rp1.62tn, naik 33% YoY dan sesuai dengan estimasi konsensus di angka 70%. Laba bersih kuartal ke-3 Rp0.58tn atau naik 48% YoY dan 5% QoQ. Profit sebelum provisi Rp2.33tn, naik 11% YoY dan sesuai dengan estimasi kami (69% estimasi FY). Di kuartal ke-3, BTN masih menunggu pembayaran FLPP dari pemerintah (bunga tahunan 0.3%), yang mempengaruhi cost of fund yang lebih tinggi dibanding estimasi awal, namun kami perkirakan NIM akan bertahan di 4.6%, didukung oleh tren cost of fund BTN yang terus turun, datang dari tingkat TD lebih rendah.
Pertumbuhan pinjaman solid didukung oleh rumah murah
BTN mencatat pertumbuhan pinjaman 17% YoY berkat pertumbuhan kuat rumah murah (+30% YoY) sebagai bagian dari Program Sejuta Rumah pemerintah, yang juga menaikkan pangsa pasar BTN di pasar KPR ke angka 32.8%. Harap catat bahwa 3Q 2016 memiliki hari kerja lebih sedikit karena libur Lebaran, karenanya melambatkan kucuran pinjaman di kuartal tersebut, jadi estimasi kami pertumbuhan pinjaman 19.9% untuk FY16 masih terhitung wajar. Walaupun tren keseluruhan untuk bunga pinjaman cenderung turun, imbal hasil pinjaman masih tetap 11%, berkat membaiknya kualitas aset yang menaikkan pengumpulan pendapatan bunga, terutama dari pinjaman rumah murah.
NPL memburuk datang dari pinjaman komersil
NPL BTN memburuk per kuartal dari Rp5.1tn (3.4% dari total) ke Rp5.5tn (3.6% dari total). Namun kami tidak terlalu khawatir karena NPL tambahan terutama datang dari pinjaman komersil (+Rp0.2tn), yang telah menyusut di 2 tahun terakhir. Kami menyesuaikan estimasi provisi FY kami ke Rp0.7tn dari Rp Rp0.6tn sebelumnya, mengingat NPL di segmen komersil akan menyentuh puncak dalam jangka waktu dekat. Secara keseluruhan, kami yakin NPL akan kembali ke tren menurun dengan penurunan keseluruhan 3.0% di 2016E. Biaya kredit 9M16 Rp0.48tn (-27% YoY) dan 0.44% dari rerata pinjaman (vs 0.7% 9M15). Rekomendasi tetap BELI karena pertumbuhan pinjaman kuat dan perbaikan kualitas aset keseluruhan
BTN saat ini diperdagangkan di kisaran bawah 1.0x PBV 2017E, yang menurut kami menarik, melihat potensi perbaikan ROE di dua tahun ke depan. Namun kami menurunkan estimasi laba bersih sebesar Rp91bn, memperhitungkan pembelanjaan provisi lebih tinggi karena adanya kenaikan NPL jangka pendek di segmen komersil. Harga target kami tetap Rp2.930, yang berarti multipel PBV 1.25x, yaitu titik tengah kisaran perdagangan BTN. Risiko penting untuk 4Q mencakup penundaan pembayaran FLPP.
Key Investment Metrics
Sumber: Perusahaan, Sucorinvest
2012 2013 2014 2015 2016E 2017E 2018E
Net Interest Income (Rp bn) 4,738 5,668 5,465 6,811 7,710 8,809 9,898 Net Profit (Rp bn) 1,364 1,562 1,116 1,851 2,329 2,877 3,257 EPS (Rp) 148 148 106 175 220 272 308 EPS Grow th (%) 17.5 - (28.4) 65.1 25.8 23.5 13.2 P/E (x) 16.1 16.1 22.5 13.7 10.9 8.8 7.8 BVPS (Rp) 1,134 1,095 1,160 1,310 1,731 1,907 2,125 P/BV (x) 2.1 2.2 2.1 1.8 1.4 1.3 1.1 P/Deposits (x) 0.3 0.3 0.2 0.2 0.2 0.1 0.1 ROAA (%) 1.4 1.3 0.8 1.2 1.2 1.3 1.3 ROAE (%) 15.5 14.3 9.4 14.2 14.5 15.0 15.3 DPS (Rp) 25 39 45 32 35 44 54 Dividend Yield (%) 1.0 1.6 1.9 1.3 1.5 1.8 2.3
INDONESIA
BANKS
Result Update
July 27, 2016 Stock Data Bloomberg Ticker BBTN IJ Outs. Share (bn) 10.59 Mkt Cap (USD bn) 1.5852 Week Range (IDR) 1.085-2.100 6M Avg Val (IDR bn) 18.5
YTD Returns (%) 49.8 Beta (x) 0.8 Current price Rp1,940 Price target Rp2,390 Upside +23%
BUY
25 October 2016Share Price Performance
ERNI MARSELLA SIAHAAN erni.siahaan@sucorinvest.com +62 21 8067 3133
SHIRLEY SAROINSONG
shirley.saroinsong@sucorinvest.com +62 21 8067 3139
2
Fig 1 Quarterly Financial Result
Source: Company presentation
3Q15 1Q16 2Q16 3Q16 YoY QoQ 9M15 9M16 YoY
9M16 /FY 2016E
Interest income 3,861 4,011 4,109 4,697 22% 14% 10,922 12,817 17% 77% Interest expense 2,104 2,256 2,221 2,742 30% 23% 6,008 7,219 20% 80%
Net interest inc. 1,757 1,755 1,888 1,954 11% 3% 4,913 5,598 14% 73% Other Operating Income 161 177 197 178 10% -10% 501 552 10% 73%
Total revenues 1,918 1,932 2,086 2,132 11% 2% 5,414 6,150 14% 73% Opex 1,055 1,210 1,325 1,279 21% -4% 3,307 3,814 15% 75% PPoP 863 722 760 853 -1% 12% 2,107 2,336 11% 69% Credit cost 389 137 170 173 -55% 2% 658 480 -27% 66% Pre-tax profit 475 585 590 680 43% 15% 1,449 1,856 28% 71% Non-core items 97 101 105 126 30% 20% 286 333 17% 77% - securities gain (loss) 57 68 69 88 53% 27% 165 225 37% 99% - loan recoveries 37 36 36 43 15% 17% 106 115 9% 57% - others 3 (3) (0) (4) -256% 1786% 15 (7) -146% -140% Income tax 181 196 144 229 27% 59% 513 569 11% 77% Net profit 391 491 551 578 48% 5% 1,222 1,620 33% 70% EPS 37 46 52 55 49% 6% 116 153 32% 69% Core EPS 31 39 44 46 51% 5% 97 130 34% 77% Demand 30,683 32,260 33,125 38,157 24% 15% 30,683 38,157 24% 92% Savings 27,247 29,038 28,805 29,077 7% 1% 27,247 29,077 7% 86% Time 66,518 69,820 72,573 80,236 21% 11% 66,518 80,236 21% 104% Total deposits 124,448 131,118 134,503 147,470 18% 10% 124,448 147,470 18% 97% Borrowings 21,580 22,982 24,506 21,383 -1% -13% 21,580 21,383 -1% 258% Loans 131,580 142,944 149,316 153,814 17% 3% 131,580 153,814 17% 92% NPL 5,918 5,132 5,093 5,537 -6% 9% 5,918 5,537 -6% 106% Loan loss reserves (1,948) (2,121) (2,078) (2,189) 12% 5% (1,948) (2,189) 12% 95% Total assets 166,038 178,419 189,513 197,294 19% 4% 166,038 197,294 19% 96% Risk weighted assets 69,116 72,840 78,510 80,413 16% 2% 69,116 80,413 16% 83% Shareholders equity 13,166 14,394 17,543 18,151 38% 3% 13,166 18,151 38% 99% RATIOS (%): Asset yield 10.9 10.3 10.1 11.0 1% 10% 10.7 10.5 -2% 104% Cost of funds 5.9 5.8 5.5 6.5 10% 19% 5.9 6.0 2% 110% NIM 5.0 4.5 4.6 4.6 -8% -1% 4.8 4.6 -5% 99% Cost-to-income 55.0 62.6 63.5 60.0 9% -6% 61.1 62.0 2% 103% Credit cost 1.10 0.35 0.42 0.41 -63% -3% 0.71 0.44 -38% 99% Tax rate 31.6 28.5 20.7 28.4 -10% 37% 29.5 26.0 -12% 108% Loan/Deposit 105.7 109.0 111.0 104.3 -1% -6% 105.7 104.3 -1% 96% Gross NPL 4.5 3.6 3.4 3.6 -20% 6% 4.5 3.6 -20% 115% LLR to total loans 1.5 1.5 1.4 1.4 -4% 2% 1.5 1.4 -4% 103% LLR to NPL 32.9 41.3 40.8 39.5 20% -3% 32.9 39.5 20% 89% Tier-1 Capital 13.7 14.5 16.8 16.5 21% -2% 13.7 16.5 21% 92% CAR 15.8 16.5 22.1 20.6 31% -7% 15.8 20.6 31% 92% ROA 1.0 1.1 1.2 1.2 23% 0% 1.0 1.2 12% 95% ROE 12.1 13.9 13.8 12.9 7% -6% 12.8 13.5 5% 93% Core ROA 0.8 1.0 1.0 1.0 25% -1% 0.9 1.0 13% 94% Core ROE 10.0 11.9 11.7 10.9 9% -7% 10.7 11.4 7% 92%
3
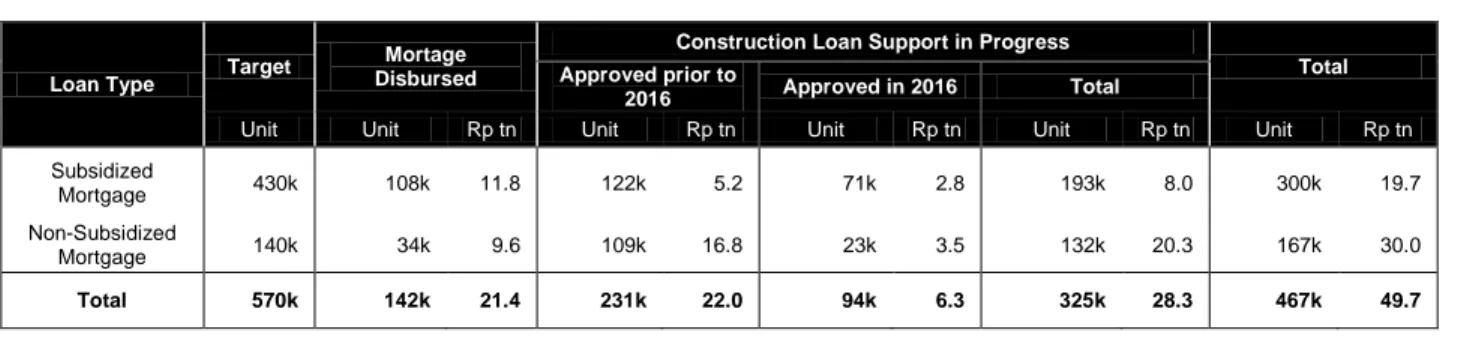
Fig 2 BTN’s target for One Million Housing Program
Loan Type Target
Mortage Disbursed
Construction Loan Support in Progress
Total Approved prior to
2016 Approved in 2016 Total
Unit Unit Rp tn Unit Rp tn Unit Rp tn Unit Rp tn Unit Rp tn
Subsidized
Mortgage 430k 108k 11.8 122k 5.2 71k 2.8 193k 8.0 300k 19.7 Non-Subsidized
Mortgage 140k 34k 9.6 109k 16.8 23k 3.5 132k 20.3 167k 30.0
Total 570k 142k 21.4 231k 22.0 94k 6.3 325k 28.3 467k 49.7
Source: Company data
BBTN memiliki hari kerja lebih sedikit di 3Q 2016 karena libur Lebaran, yang pada gilirannya memperlambat penyaluran pinjaman di kuartal tersebut. Kami perkirakan tingkat penyaluran pinjaman lebih tinggi untuk FY 2016 (+46% YoY untuk KPR subsidi dan 23% YoY untuk KPR non subsidi), yang berarti 33% pertumbuhan YoY untuk KPR subsidi dan 16% pertumbuhan YoY KPR non subsidi.
4
Fig 3 Financial Data
Source: Company data, Sucorinvest Estimates
Balance Sheet (Rpbn)
As at 31 Dec 2012 2013 2014 2015 2016E 2017E 2018E Assets Cash on hand 695 924 920 1,181 1,412 1,643 1,871 Deposits at BI 17,892 14,693 10,868 18,516 23,130 23,278 25,400 Placements 872 5 0 310 310 310 310 Mkt. securities 1,014 4,202 5,437 1,808 1,808 1,808 1,808 Govt. bonds 7,469 8,385 8,238 8,231 7,078 6,156 5,419 Net Loans 80,430 99,330 114,339 136,905 164,315 197,716 234,334 Fixed assets 1,583 1,523 1,488 1,553 4,716 4,858 5,004 Other 1,632 2,108 2,191 3,102 3,102 3,102 3,102 Total Assets 111,748 131,170 144,576 171,808 206,072 239,072 277,448 Liabilities Customer deposits 80,668 96,208 106,471 127,709 152,627 177,592 202,265 Borrow ings 16,209 18,562 19,336 22,354 25,974 31,845 42,917 Other liabilities 3,886 4,568 5,384 6,164 6,164 6,164 6,164 Total liabilities 101,470 119,613 132,370 157,947 187,764 218,900 254,975 Equity 10,279 11,557 12,206 13,860 18,308 20,171 22,473 Minority interest 0 0 0 0 0 0 0
Total liabilities & Equity 111,748 131,170 144,576 171,808 206,072 239,072 277,448 Incom e Statem ent (Rpbn)
Year to 31 Dec 2012 2013 2014 2015 2016E 2017E 2018E Avg. Earning Assets 88,920 106,011 120,678 139,906 166,542 195,962 228,933
Net interest Margin 5.3% 5.3% 4.5% 4.9% 4.6% 4.5% 4.3%
Net Interest Incom e 4,738 5,668 5,465 6,811 7,710 8,809 9,898
Fees and commissions 355 378 469 534 614 700 798 Other income 205 232 426 573 568 500 522
Total net revenue 5,298 6,279 6,359 7,917 8,892 10,009 11,217
Total Provisions 214 432 772 894 733 645 717 Total Noninterest Expense 3,214 3,710 4,041 4,490 5,099 5,681 6,330
Pretax incom e (loss) 1,863 2,141 1,548 2,542 3,065 3,688 4,175
Income tax expense (benefit) 499 579 433 691 736 811 919
Minorities 0 0 0 0 0 0 0
Net Profit 1,364 1,562 1,116 1,851 2,329 2,877 3,257
Avg. Fully Diluted Shares 9.068 10.555 10.524 10.577 10.577 10.577 10.577
EPS 148 148 106 175 220 272 308
Core EPS 133 136 69 129 169 234 268
DPS (Rp) 25 39 45 32 35 44 54
5
Fig 3 Financial Data
Source: Company data, Sucorinvest Estimates
Key Assum ptions (Percent)
Year ending 31 Dec 2012 2013 2014 2015 2016E 2017E 2018E
Loans grow th 28.1 23.4 15.4 19.9 19.9 20.1 18.4 Deposits grow th 30.2 19.3 10.7 19.9 19.5 16.4 13.9 Loans/Deposit Ratio 100.9 104.4 108.9 108.8 109.2 112.7 117.2 NPL/Total Loans 4.1 4.0 4.0 3.4 3.1 2.8 2.5 Loan Loss Reserve/NPLs 29.5 28.0 33.9 43.1 44.2 44.3 44.1 Equity/Assets 8.8 9.0 8.6 8.2 8.5 8.6 8.3 Equity/RWAs 22.1 20.0 18.4 19.7 18.9 17.5 16.6 Tier-1 Capital Ratio 17.0 14.9 14.1 14.9 17.9 16.2 15.1 Total Capital Ratio 17.7 15.6 14.6 17.0 22.4 20.1 18.6
Key Ratios (Percent)
Year to 31 Dec 2012 2013 2014 2015 2016E 2017E 2018E
ROAA 1.4 1.3 0.8 1.2 1.2 1.3 1.3 ROAE 15.5 14.3 9.4 14.2 14.5 15.0 15.3 Fee Income/Total Income 6.7 6.0 7.4 6.7 6.9 7.0 7.1 Non-Int. Inc./Total Income 10.6 9.7 14.1 14.0 13.3 12.0 11.8 Cost Income Ratio 62.2 60.0 66.7 59.6 60.2 58.6 58.2 Asset yield 9.9 10.2 10.6 10.7 10.1 9.6 9.4 Cost of funds 4.6 4.8 6.1 5.9 5.4 5.1 5.1 Spread 5.3 5.4 4.5 4.8 4.6 4.5 4.4
6
Fig 4 Changes in financial estimates
Source: Company data, Sucorinvest Estimates
Rp bn Old New Chng Old New Chng Old New Chng
Net interest inc. 7,719 7,710 0% 8,829 8,809 0% 9,919 9,898 0% Other Operating Income 794 754 -5% 880 880 0% 978 978 0% Total revenues 8,513 8,464 -1% 9,709 9,689 0% 10,897 10,875 0% Opex 5,099 5,099 0% 5,681 5,681 0% 6,330 6,330 0% PPoP 3,414 3,365 -1% 4,028 4,008 0% 4,567 4,546 0% Credit cost 617 733 19% 634 645 2% 708 717 1% Pre-tax profit 2,797 2,632 -6% 3,394 3,363 -1% 3,859 3,828 -1% Non-core items 305 433 42% 325 325 0% 347 347 0% - securities gain (loss) 100 228 128% 100 100 0% 100 100 0% - loan recoveries 200 200 0% 220 220 0% 242 242 0% - others 5 5 0% 5 5 0% 5 5 0% Income tax 682 736 8% 818 811 -1% 925 919 -1% Net profit 2,420 2,329 -4% 2,901 2,877 -1% 3,281 3,257 -1% EPS 229 220 -4% 274 272 -1% 310 308 -1% Core EPS 194 169 -12% 237 234 -1% 270 268 -1% Total deposits 152,627 152,627 0% 177,592 177,592 0% 202,265 202,265 0% Demand 41,406 41,406 0% 49,688 49,688 0% 59,625 59,625 0% Savings 33,833 33,833 0% 38,908 38,908 0% 44,745 44,745 0% Time 77,387 77,387 0% 88,996 88,996 0% 97,895 97,895 0% Loans 166,621 166,621 0% 200,163 200,163 0% 236,954 236,954 0% NPL 4,970 5,216 5% 5,294 5,518 4% 5,743 5,947 4% Loan loss reserves (2,213) (2,306) 4% (2,363) (2,447) 4% (2,545) (2,621) 3% Total assets 206,166 206,072 0% 239,156 239,072 0% 277,523 277,448 0% Risk weighted assets 96,745 96,694 0% 115,390 115,343 0% 135,821 135,779 0% Shareholders equity 18,308 18,308 0% 20,244 20,171 0% 22,564 22,473 0% RATIOS (%): Asset yield 10.1 10.1 0% 10 10 0% 9 9 0% Cost of funds 5.4 5.4 0% 5 5 0% 5 5 0% NIM 4.6 4.6 0% 5 4 0% 4 4 0% Cost-to-income 59.9 60.2 1% 59 59 0% 58 58 0% Credit cost 0.37 0.44 19% 0 0 2% 0 0 1% Tax rate 22 24 9% 22 22 0% 22 22 0% Loan/Deposit 103.5 109.2 5% 107 113 6% 111 117 6% Gross NPL 3.0 3.1 5% 3 3 4% 2 3 4% LLR to total loans 1.3 1.4 4% 1 1 4% 1 1 3% LLR to NPL 44.5 44.2 -1% 45 44 -1% 44 44 -1% Tier-1 Capital 17.9 17.9 0% 16 16 0% 15 15 0% CAR 22.3 22.4 0% 20 20 0% 19 19 0% ROA 1.3 1.2 -4% 1 1 -1% 1 1 -1% ROE 15.0 14.5 -4% 15 15 -1% 15 15 0% Core ROA 1.2 1.1 -8% 1 1 -1% 1 1 -1% Core ROE 13.6 12.4 -8% 14 14 -1% 14 14 0%
7
Sucorinvest rating definition, analysts certification, and important disclosure
Ratings for Sectors
Overweight : We expect the industry to perform better than the primary market index (JCI) over the next 12 months. Neutral : We expect the industry to perform in line with the primary market index (JCI) over the next 12 months. Underweight : We expect the industry to underperform the primary market index (JCI) over the next 12 months
Ratings for Stocks
Buy : We expect this stock to give return (excluding dividend) of above 10% over the next 12 months. Hold : We expect this stock to give return of between -10% and 10% over the next 12 months.
Sell : We expect this stock to give return of -10% or lower over the next 12 months
Analyst Certification
The research analyst(s) primarily responsible for the preparation of this research report hereby certify that all of the views expressed in this research report accurately reflect their personal views about any and all of the subject securities or issuers. The research analyst(s) also certify that no part of their compensation was, is, or will be, directly or indirectly, related to the specific recommendations or views expressed in this research report.
Disclaimers
This document has been prepared for general circulation based on information obtained from sources believed to be reliable but we do not make any representations as to its accuracy or completeness. PT Sucorinvest Central Gani accepts no liability whatsoever for any direct or consequential loss arising from any use of this document or any solicitations of an offer to buy or sell any securities. PT Sucorinvest Central Gani and its directors, officials and/or employees may have positions in, and may affect transactions in securities mentioned herein from time to time in the open market or otherwise, and may receive brokerage fees or act as principal or agent in dealings with respect to these companies. PT Sucorinvest Central Gani may also seek investment banking business with companies covered in its research reports. As a result investors should be aware that the firm may have a conflict of interest that could affect the objectivity of this report. Investors should consider this report as only a single factor in making their investment decision.
8
Sales Office & Research
PT. Sucorinvest Central Gani
Research
1. Stanley Liong Senior equity analyst stanley.liong@sucorinvest.com
2. Alexander Budiman Equity analyst alexander.budiman@sucorinvest.com
3. Erni Marsella Siahaan Equity analyst erni.siahaan@sucorinvest.com
4. Sharon Anastasia Tjahjadi Equity analyst
sharon.tjahjadi@sucorinvest.co
m5. Adina Layarda 6. Felicia Putri Tjiasaka
On-the-ground analyst On-the-ground analyst
adina.layarda@sucorinvest.co
m felicia.putri@sucorinvest.com7. Sandy Ham On-the-ground analyst sandy.ham@sucorinvest.com
8. Putri Kinanty Siregar Economist putri.siregar@sucorinvest.com
9. Shirley Saroinsong Editor & translator shirley.saroinsong@sucorinvest.com
HEAD OFFICE
PT. Sucorinvest Central Gani Sahid Sudirman Center 12th Floor
Jl. Jend Sudirman Kav. 86 Jakarta 10220 – Indonesia Ph : (+62-21) 8067 3000 Fax : (+62-21) 2788 9288 JAKARTA
Ruko Inkopal Block A No. 23 A Jl. Boulevard Barat Raya Jakarta Utara 14240 Ph: (+62-21) 4585 9114 Fax: (+62-21) 4585 9227 GALERI INVESTASI Universitas Tarumanegara Fakultas Ekonomi
Lab. Pasar Modal Ged. A Lt. 7 Jl. Tanung Duren Raya No. 1, Jakarta Barat 11470 Kiosk Mall Ambassador Lantai Dasar Blok H No.3A Jl. Professor Doktor Satrio Jakarta Selatan 12940
TANGERANG GALERI INVESTASI Swiss German University Edu Town BSD City Fakultas Business Administration & Humanity Tangerang 15339 BANDUNG
Ruko Paskal Hyper Square Blok B No.47
Jl. Pasir Kaliki No. 25 - 27 Bandung 40181 Ph: (+62-22) 8778 6206 Fax: (+62-22) 8606 0653 JL.Hegarmanah No.57 Bandung 40141 Ph: (+62-22)-203 3065 Fax: (+62-22) 203 2809 MALANG
Jl. Jaksa Agung Suprapto No.40 Kav. B4, Malang 68416 Ph: (+62-341) 346 900 Fax: (+62-341) 346 928 SURABAYA Jl. Trunojoyo no.67 Surabaya 60264 Ph: (+62-31) 563 3720 Fax: (+62-31) 563 3710 Jl. Slamet no. 37 Surabaya 60272 Ph : (+62-31) 547 9252 Fax : (+62-31) 547 0598 Ruko Pakuwon Town Square AA2-50
Jl. Kejawen Putih Mutiara, Surabaya 60112 Ph: (+62-31) 5825 3448 Fax: (+62-31) 5825 3449
GALERI INVESTASI Universitas Negeri Surabaya PIC : Wahyudi Maksum Kampus ketintang
Gedung bisnis centre fakultas ekonomi Jl. Ketintang, Surabaya 60231 Ph: (+62-31) 8297123 GALERI INVESTASI Universitas 17 Agustus 1945 Jl. Semolowaru 45 Surabaya 60118