Effect of Different Calcination
Faculty of Engineering, Universitas Indonesia, Depok 16424, Indonesia1
National Nuclear Agency (BATAN), Kawasan PUSPIPTEK, Serpong, Indonesia
4
Abstract—The characteristics of lithium iron phosphate (LiFePO4) prepared via hydrothermal route and calcined at various temperatures have been examined. Calcinations were performed at temperature variations of 500, 600, and 750C for 5 hours. The properties were characterized through thermal decomposition, structure, morphological and electrical properties. Flake-shaped pure LiFePO4 and LiFePO4/C was successfully synthesized with the addition of 5 wt.% carbon black. The results showed that the addition of carbon effectively protected the material from oxidation and grain growth. The optimum calcination temperature was obtained at 750C with flake diameter of 80 nm and average length of 427 nm. The measured conductivity of the carbon coated LiFePO4 (2.23 x 10⁻⁴ S/cm) was much higher than that of the as-synthesized LiFePO4 (5 x 10⁻⁷ S/cm). The battery performance was obtained with a stable voltage ranging from 3.3 to 3.4 volts.
Keyword- Carbon coating. Hydrothermal, LiFePO4, Cathode, Lithium ion battery
I. INTRODUCTION
Lithium ferro phosphate (LiFePO4) has attracted many investigators since the reversibility of
intercalation-deintercalation lithium ion in electrochemical process was observed [1], primarily as a promising candidate for lithium ion battery cathode. Many advantages of this material have been reviewed such as low production cost, environmental friendly and high capacity and stability cycle [2].
Despite its many advantageous, however, LiFePO4 also has a drawback in that its electronic conductivity is
low, measured only 10-9 S/cm [3]. This low electronic conductivity could lead to a low rate capability. Because of that, several approaches have been proposed by many investigators to improve this conductivity, e.g. refining the grain to nanoscale [4], [5], metal doping [6], [7], carbon coating [2], and co-synthesis with carbon in powder metallurgy method [8].
The synthesis routes of LiFePO4 are mainly divided into two categories. The first route is a solid-state
reaction, which involves a combination of mechanical alloying and solid reaction at high temperature [9] – [11]. The second route is a wet chemical approach, which involves utilization of chemical reaction solution followed by crystallization. This approach includes sol-gel [12], [13], hydrothermal [14] – [18], and solvothermal [19], [20].
Solid state route has attracted many investigators due to the ease of the process; however, solid state synthesis needs high temperature for sintering process in addition to the impurity problems dominated by Li3PO4 and
Fe2O3 [21]. In the electrochemical reaction during charge-discharge process, the material containing these
impurities will degrade and reduce the capacity of the active material [22]. The alternative is to synthesize LiFePO4 by using hydrothermal route, which involves wet chemical process at low temperature followed by
purifying process at relatively high temperature. This route has some advantages such as simple process and relatively low crystallization temperature and thus energy consumption [23]. In addition, the impurities could also be controlled during the reaction process [24].
In this work, LiFePO4 was prepared using the hydrothermal route. The characteristics of the material after
calcination at various different temperatures are presented. Further, the effect of carbon coating on the LiFePO4
II. EXPERIMENTAL A. Synthesis of LiFePO4
The synthesis of LiFePO4 was performed via hydrothermal route. The starting materials LiOH, FeSO4·7H2O
and NH4H2PO4 were purchased from Merck and were used as precursors with no further treatment. The
precursors were weighed in an analytical balance with a molar ratio of Li : Fe : P = 2 : 1 : 1. Lithium hydroxide was dissolve to form 0.05 mole aqueous solution and was mixed with 0.025 mole of NH4H2PO4 under magnetic
stirrer agitation to form a white suspension. A solution of 0.025 mole FeSO4·7H2O was added drop wisely into
the suspension and stirred for 45 minutes to form a bluish green suspension. This green suspension was quickly transferred into 100 mL Teflon-lined stainless-steel autoclave and was heated at 180°C for 20 hours. The resultant light bluish green precipitation was collected and washed by distilled water for several times and lastly by using deionized water. The precipitates were then dried at 80°C in an oven for 4 hours before further treatment and characterization.
B. Preparation of Carbon Coated LiFePO4
The as-synthesized LiFePO4 powder from previous step was mixed with 5 wt.% carbon black (CB) and the
mixture was ball milled until homogenized and labelled as LiFePO4/C. Some of the mixture were analysed using
thermal analyser (Shimadzu DTG-60 Simultaneous Measuring Instrument) for thermal decomposition behaviour. The remain LiFePO4/C was subsequently calcined at various temperatures 500, 600 and 750 °C for 5 hours
under nitrogen atmosphere. For comparison, the as-synthesized LiFePO4 was also prepared by the same
procedure but with no carbon addition and labelled as LiFePO4. X-ray diffraction (XRD, Pan-Analytical)
measurements were conducted using Cu-Kα at 2θ 10-70° and the diffractograms were analysed using JCPDS database as a reference. Scanning electron microscope (SEM, FEI Inspect F50) was used to observe particle morphology and size distribution.
C. Battery Preparation
The carbon coated LiFePO4 from the previous step was used for conductivity measurement and was
performed using an electrical impedance spectroscopy (EIS, Hioki LCR 3532-50) from 1 gram of the active material prepared in cylindrical pellet with 0.9 cm diameter pressed at 6 MPa. For the electrochemical test, 80 wt.% of the as-prepared LiFePO4 was mixed with carbon black and poly-vinylidene fluoride (PVDF) with a
ratio of LiFePO4 : CB : PVDF = 80 : 10 : 10 in N-methyl pyrrolidone (NMP) solvent inside a vacuum mixer.
The mixture was applied onto an aluminium sheet as a current collector (MTI) and dried. After drying, the sample was hot-rolled and heated in a vacuum oven at 80°C. The battery was prepared in the forms of a coin using an Li metal anode for half-cell and LiPF6 was used as an electrolyte. The cell was then tested through
charge/discharge performance using an MTI battery analyser.
III.RESULT AND DISCUSSION
At dissolving process during the initial stage, the following reaction may take place, 6 LiOH (l) + 3 NH4H2PO4(l) + 3 FeSO4.7 H2O (l)
Li3PO4(s) + Fe3(PO4)2(s) + 13 H2O + 3 Li+ + 3 NH2- + 3 HSO4- + 3 H+ (1)
Visual appearance of the resultant reaction is bluish green suspension as an indication of Li3PO4 and
Fe3(PO4)2. These compounds are metastable and will act as intermediate compounds of LiFePO4. The equimolar
of Li3PO4 and Fe3(PO4)2 is a key factor to obtain pure LiFePO4 formation in the precursor either in a solid state
or a wet chemical method and could only be achieved under excessive Li+ molar condition [25]. In the autoclave, at reaction temperature of 180C for 20 hours, the initial precursor suspension will react to form amorphous LiFePO4 and H2SO4 (l) according to the expected reaction below:
Li3PO4(s) + Fe3(PO4)2(s) + 13 H2O + 3 Li+ + 3 NH2- + 3 HSO4- + 3 H+
3 LiFePO4(s) + 3 H2SO4 + 13 H2O + 3 Li+ + 3 NH2- (2)
As can be seen in the reaction, other reaction products Li+ and NH2- excess dissolving in strong acid
supernatant H2SO4 (l) should be remove through the washing process. The bluish green precipitate of amorphous
LiFePO4 was then collected and dried and subsequently was calcined to obtain pure LiFePO4.
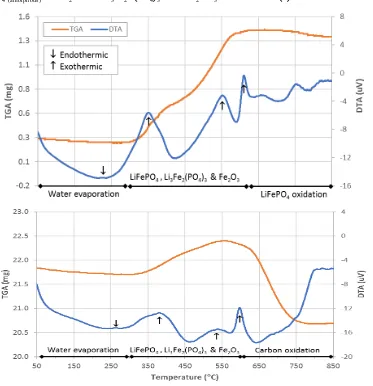
The aforementioned reaction behavior could be observed under thermal decomposition. In this work, samples were characterized using a thermogravimetric analyzer at a heating rate of 10°C/minutes from room temperature to 850 °C under nitrogen environment. Visual observation of the results showed that LiFePO4/C has a dark
colour, whereas LiFePO4 has red colour as an indication of oxidation. Figure 1 shows thermal behavior curves
for both samples.
As can be seen in Fig. 1a, the TG curve of LiFePO4 sample consists of 3 stages. In the first stage, at
temperature 60 – 300°C, there is a slight decrease in mass due to water evaporation. This phenomenon is also characterized by an endothermic reaction culminating at 227⁰C. Therefore, it is clear that LiFePO4
around 3.86% with three exothermic reactions at 348⁰C, 540⁰C and 605⁰C. This reaction is an oxide decomposition of amorphous LiFeIIPO4 into Li3Fe2(PO4)3 and Fe2O3 [9] according to the following reaction:
LiFeIIPO4(amorphous) + ¼ O2 1/3 Li3Fe2III(PO4)3 + 1/6 Fe2 IIIO3 (3)
Fig. 1.Thermal analysis curves of (a) LiFePO4 and (b) LiFePO4/C
The next stage is a constant plane with slight weight reduction in order to continues oxidation of LiFePO4.
This result is in agreement with that obtain by others in which the olivine LiFePO4 will oxidized into
Li3Fe2(PO4)3 and Fe2O3 at temperature range of 250-550C [9], [14], [16] without any other substances that
protect LiFePO4, even when 30 mL/min N2 is still flowing.
Visual observation of LiFePO4/C after thermal characterization shows that most all of the samples were black
with a little red on the surface as can be seen in Fig. 1b. The red part could be Li3Fe2(PO4)3 and Fe2O3,which
occurred as a result of oxidation, whereas the black part would be crystalline LiFePO4. Mass change of the
LiFePO4/C curve can also be divided into 3 stages. In the first part, at temperature of 60-300C, there is a slight
decrease in weight due to water evaporation. The second stage occur within the range of 300-510°C. In this stage, the weight increases 1.93%, and two reactions take place. The first reaction is oxidation of LiFePO4 into
Li3Fe2(PO4)3 + Fe2O3 and the second is decomposition of amorphous LiFePO4 into crystalline LiFePO4
according to the following reaction: C-LiFeIIPO4 (amorphous) + ¼ O2+ nO2
Cn-1-LiFeIIPO4 (crystalline) + 1/3 Li3Fe2III(PO4)3 + 1/6 Fe2 IIIO3 + n CO2 (4)
The third stage is at 510-750°C, where the weight decreases by 4.8% due to carbon oxidation into CO2,
leaving the LiFePO4 coupled with the excess carbons. The carbon content of LiFePO4/C was calculated in which
the remaining carbon is equal to total carbon added minus the burned carbon [9]. In this case, the carbons remained active in the material are 5%-4.8% = 0.2%. From this decomposition behavior, it is clear that the carbon role in the calcination process would be mainly as an oxidation protection of LiFePO4. From the thermal
oxidation of carbon that completes at 750C. This LiFePO4 formation temperature is slightly different from that
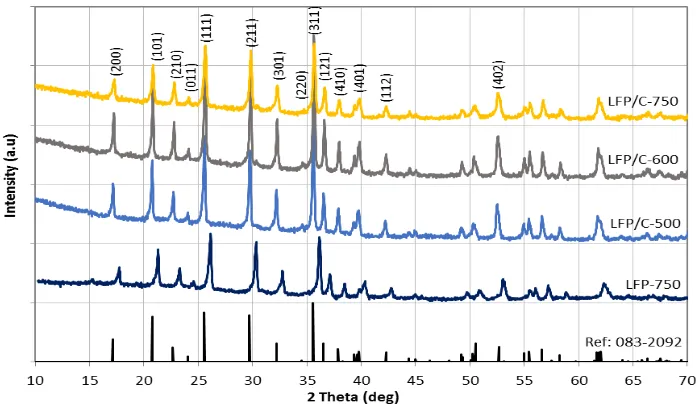
obtained by Frangers [26] at 550 C for 12 hours with the addition of carbon less than 5 wt.%, while Belharouak [9] obtained at 450 C. This difference is expected to be due to the precursors used and the synthesis routes [27]. X-ray diffraction patterns of LiFePO4/C at various temperature and LiFePO4 at 750 C are shown in Fig. 2.
The entire diffraction peaks of LiFePO4/C at various calcination temperatures are in agreement with that of
LiFePO4 standard indexed to the orthorhombic Pnma space group (JCPDS No.083-2092). Strong and sharp
diffraction peaks indicate that LiFePO4/C sample is highly crystalline. For the sample with no carbon, the peaks
shift slightly and are in agreement with that of LiFePO4 standard indexed to the orthorhombic Pnmb space group
(JCPDS No.019-0721). The peak difference between LiFePO4 and LiFePO4/C is expected to be due to the
presence of carbon. There are no other phases nor other impurities are detected in the XRD diffractograms.
Fig. 2. X-ray diffraction patterns of LiFePO4/C at various calcination temperatures and LiFePO4 at 750 °C.
The variations of unit cell volume (V) and lattice parameters at various calcination temperatures were calculated and the results are summarized in Table 1 and Table 2 for LiFePO4/C and LiFePO4, respectively. At
calcination temperature 500ºC, the lattice parameters are in agreement with that reported by other [28] with JCPDS No. 083-2092; however, when the calcination temperature increased to 600 and 700C, lattice parameters decreased. This could be explained by the facts that at high calcination temperature, more atom carbons will be oxidized forming CO2 and thus more room for LiFePO4 crystal to get organized and hence the
volume gets smaller. The lattice parameters of LiFePO4 are in agreement with that of JCPDS No. 019-0721. TABLE I LIFEPO4/C lattice parameters at different calcination temperatures
Sample Lattice parameter
a (Å) b (Å) c (Å) V (Å3)
LiFePO4/C-500 10.343 6.004 4.688 291.117
LiFePO4/C-600 10.295 5.991 4.686 289.007
LiFePO4/C-750 10.280 5.996 4.702 289.820
JCPDS 083-2092 10.334 6.010 4.693 291.470
TABLE 2 LIFEPO4 lattice parameters at calcination temperature 750 C
Sample Lattice parameter
a (Å) b (Å) c (Å) V (Å3)
LiFePO4-750 5.9500 10.196 4.691 291.117
JCPDS 010-0721 5.9970 10.314 4.486 289.840
To understand the effect of carbon addition on the morphology of the LiFePO4/C, secondary electron images
using SEM were taken for LiFePO4 and LiFePO4/C from the same calcination temperature of 750C and the
results are shown in Fig. 3. As seen in the figure, LiFePO4 has large grains of up to 10 µm whereas LiFePO4/C
growth during calcination. During calcination process, the heat will cause the small grains to merge with the large one by grain boundaries diffusion. The small grain in LiFePO4/C, on the other hand, is expected to be the
result of mechanical grinding process, which breaks the precursor grain during the mixing of carbon black and LiFePO4. The carbons then cover the LiFePO4 particles and protect them from grain growth during the
calcination process.
Fig. 3. Secondary electron images of the samples after calcination at 750°C (a) LiFePO4 and (b) LiFePO4/C.
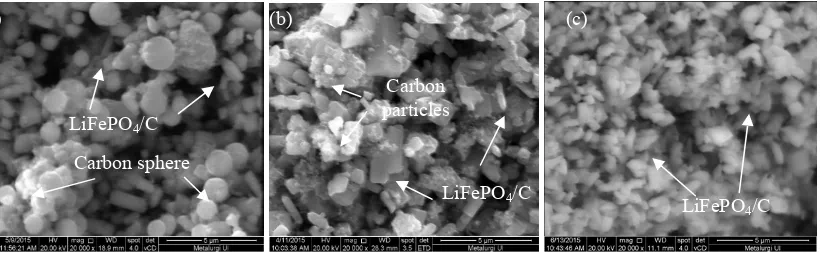
Morphology of LiFePO4/C at different calcination temperatures is shown in Fig. 4. At temperature of 500ºC,
LiFePO4/C formed in two shapes i.e. flakes and spheres as shown in Fig 4(a). Flake shaped LiFePO4/C is
basically the original shape of LiFePO4 coated by carbon, whereas the sphere one is initiated by the carbon
excess. EDX analysis of the flake shape showed that the composition of O = 35.88; P = 23.41 and Fe = 40.71 wt.%, which represents LiFePO4 and sphere composition is dominated by C = 53.72 with the remaining are O =
30.63; P = 05.08; and Fe = 10.57 wt.%. Referring to the LiFePO4/C TGA result shown previously, it can be
inferred that at 500ºC, LiFePO4 formation has finished but still contain most of the added carbon. When
calcination temperature is increased from 500 to 600ºC, globular shape of carbon disappears because most of the carbons have turned into CO2 whereas the other carbons agglomerate in the forms of small particles.
Furthermore, flake shaped of LiFePO4/C is now dominating the grains. At the calcination temperature 750ºC,
only flake shaped LiFePO4 remains coated by carbons on the surface.
Fig. 4. Secondary electron images of LiFePO4/C calcined at (a) 500C (b) 600C and (c) 750C.
Image analysis has been performed in order to calculate the particle size distribution, and the result is shown in Table 3. Within temperature increment from 500 to 600ºC, grain growth occurs in LiFePO4/C flake and make
the size of the flake to become large although it is not as large as pure LiFePO4. This can be understood since
the grain growth mechanism will occur when two grain boundaries in same phase but different size get into contact each other. In this case, carbon will act as a barrier that keeps LiFePO4 grain boundary from being
contacted. At temperature 750ºC, the grain size is supposed to be larger than that of lower temperature. In this case, however, it turns to be small. This is expected because of the effect of mechanical mixing before calcination, and thus the carbon sphere disappears in this temperature. This confirm the result of DTA-TGA curve where the carbon oxidation has completed at 750ºC. Hydrothermal synthesis followed by calcination process without additional carbon is indeed susceptible to grain growth. This confirms that the carbons act as inhibiting additive for the grain growth [15].
LiFePO4/C
Carbon sphere (a)
LiFePO4/C
Carbon particles (b)
LiFePO4/C
(c)
LiFePO4 LiFePO4
TABLE 3. Averaged particle size of LiFePO4/C and LIFEPO4 after calcination
Sample Flake width (nm) Flake length(nm) Carbon Sphere (nm)
LiFePO4/C-500 51 572 629
LiFePO4/C-600 68 664 114 (agglomerated)
LiFePO4/C-750 80 427 -
LiFePO4-750 3000 10536 -
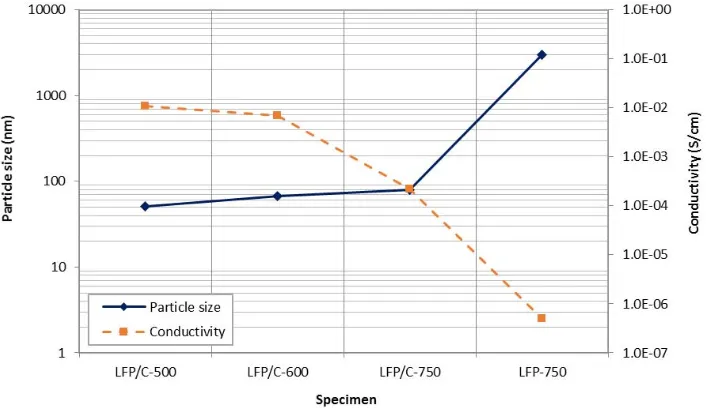
The effect of carbon addition and calcination temperature on the electrical conductivity of crystalline LiFePO4 wasexamined from pressed LiFePO4/C and LiFePO4 sample pellets using EIS. The conductivity test
result is shown in Table 4. Pure LiFePO4 crystal is having insulator property, and thus the test result of LiFePO4
shows only a conductivity in the order of 10-7 S/cm. This result is in agreement with other results [3], [12]. With the addition of carbon, the conductivity increases. In this instance, carbon will act as a conductive agent, and hence, more carbon will increase the conductivity. Conductivity, however, reduces at increasing calcination temperature as shown in Table 4. As has been mentioned previously, at high calcination temperature, more atom carbon will oxidize to form CO2 and thus less carbon will be available to cover the LiFePO4.
TABLE 4 Electrical conductivity test result
Sample Conductivity (S/cm)
LiFePO4/C-500 1.072x10⁻²
LiFePO4/C-600 7.063x10⁻³
LiFePO4/C-750 2.231x10⁻⁴
LiFePO4-750 5.009x10⁻⁷
The conductivity of active material is also related to the particle size, as shown in Fig.5. With the assumption that the flake size is proportional to the grain size, whereas the electron will take the shortest path to travel, the electrical conductivity will be lower at larger particle size. This can be understood since the larger the particle sizes the greater the distance and thus the lower the conductivity.
Fig. 5. Relationship between particle size and electrical conductivity in LiFePO4/C
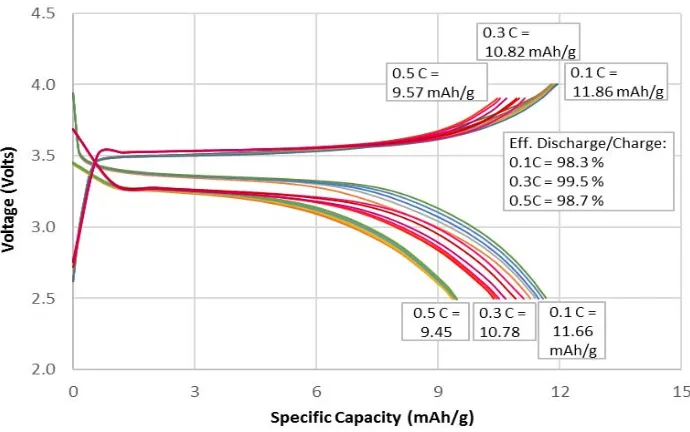
In order to determine the capacity and performance of LiFePO4 cathode, charge–discharge cycle tests were
performed on LiFePO4/C at various rates. Result from LiFePO4/C sample showed that the stable active material
is the sample with carbon addition and calcined at 750C. The charge–discharge voltage curves for the LiFePO4/C-750 in the voltage range of 2.5–4.0 volts and current density of 0.1-0.5C are shown in Fig. 6. A flat
profile over 3.3–3.5 volts potential range indicates that the extraction and the insertion reaction of the lithium ions proceeded by the motion of a two-phase interface between FePO4 and LiFePO4. The specific capacity from
other contaminants could reduce the capacity and damage the electrolyte solution and the cathode [17], [22]. Nonetheless, despite the low capacity, the trend obtained in this work is promising for the next development.
Fig. 6. Charge/discharge test results in the potential range of 2.5–4.0 volts at room temperature for the LiFePO4/C calcined at 750 °C.
IV.CONCLUSION
Pure LiFePO4 and carbon coated LiFePO4 has been synthesized using hydrothermal route. Thermal
decomposition behaviour showed that LiFePO4 formation was completed at 510C followed by carbon
oxidation until 750C. The addition of carbon effectively protected the material from oxidation and grain growth during calcination process. High calcination temperature resulted in large grain particles and reduction of carbon content. The X-ray diffraction diffractograms exhibited well crystallized peaks corresponding to an orthorhombic olivine type structure with Pnma space group. SEM analysis showed that the synthesized powder consists of flake-like shaped grains in the size range of 400–650 nm. The charge-discharge measurements performed at various rates exhibited a good cycling stability under working voltage at 3.3~3.5 volts.
ACKNOWLEDGEMENT
The authors would like to express their gratitude to the Directorate of Research and Community Services (DRPM) Universitas Indonesia and Science and Technology Centre for Advanced Materials, National Nuclear Energy Agency (BATAN), Indonesia. Publication of the paper is supported in part by Hibah PITTA No. 822/UN2.R3.1/HKP.05.00/2017.
REFERENCES
[1] A. K. Padhi, K. S. Nanjundaswamy, J. Goodenough, “Phospho-olivines as Positive-Electrode Materials for Rechargeable Lithium Batteries,” Electrochem. Soc., vol. 144, No.4, p. 1188-1195, 1997.
[2] L-H. Hu, F. Y. Wu, C. T. Lin, A. N. Khlobystov, L. J. Li, “Graphene-modified LiFePO4 cathode for lithium ion battery beyond
theoretical capacity,” Nature Commun., vol. 4 No. 1687, pp. 1-7, 2013.
[3] S. Y. Chung, J. T. Bloking, Y.M. Chiang, “Electronically conductive phospho-olivines as lithium storage electrodes,” Nat. Mater., vol. 1, pp. 123-128, 2002.
[4] J. Lim, S-W. Kang, J. Moon, S. Kim, H. Park, J. P. Baboo, J. Kim, “Low-temperature synthesis of LiFePO4 nanocrystals by
solvothermal route,” Nanoscale Res. Lett. vol. 7 No. 3, pp. 1-7, 2012.
[5] W. Yu, L. Wu, J. Zhao, Y. Zhang, G. Li, “Synthesis of LiFePO4/C nanocomposites via ionic liquid assisted hydrothermal method,” J.
Electroanal. Chem. Vol. 704, pp. 214-219, 2013.
[6] D. Arumugam, G. P. Kalaignan, P. Manisankar, “Synthesis and electrochemical characterizations of nano-crystalline LiFePO4 and
Mg-doped LiFePO4 cathode materials for rechargeable lithium-ion batteries,” J. Solid State Electrochem., vol. 13 No. 2, pp. 301-307,
2008.
[7] H. Liu, J. Xie, K. Wang, “Synthesis and characterization of LiFePO4/(C+Fe2P) composite cathodes,” Solid State Ionics, vol. 179, No.
27-32, pp. 1768-1771, 2008.
[8] R. Dominko, M. Bele, M. Gaberscek, M. Remskar, D. Hanzel, S. Pejovnik, J. Jamnik, “Impact of the Carbon Coating Thickness on the Electrochemical Performance of LiFePO4/C Composites,” J. Electrochem. Soc., vol. 152 No. 3, pp. A607-A610, 2005.
[9] I. Belharouak, C. Johnson, K. Amine, “Synthesis and electrochemical analysis of vapor-deposited carbon-coated LiFePO4,”
Electrochem. Commun., vol. 7 No. 10, pp. 983-988, 2005.
[10] Z.P. Guo, H. Liu, S. Bewlaya, H.K. Liu, S.X. Dou, “A New Synthetic Method for Preparing LiFePO4 with Enhanced Electrochemical Performance,” J. New Mat. Electrochem. Systems, vol. 6, pp. 259-262, 2003.
[11] X. Sun, K. Sun, C. Chen, H. Sun, B. Cui, “Controlled Preparation and Surface Structure Characterization of Carbon-Coated Lithium Iron Phosphate and Electrochemical Studies as Cathode Materials for Lithium Ion Battery,” Int. J. Mater. Chem., vol. 2 No. 5, pp. 218-224, 2013.
[13] J. Yang, J. J. Xu, “Nonaqueous Sol-Gel Synthesis of High-Performance LiFePO4,” Electrochem. Solid State Lett., vol. 7 No. 12, pp.
A515-A518, 2004.
[14] H-G. Deng, S-L. Jin, X. He, L. Zhan, W-M. Qiao, L-C. Ling, “LiFePO4/C Nanocomposites Synthesized from Fe2O3 by a
Hydrothermal Reaction-Calcination Process and Their Electrochemical Performance,” J. Inorg. Mater., vol. 27 No. 9, pp. 997-1002, 2012.
[15] M. Mazman, Ö. Çuhadar, D. Uzun, E. Avci, E. Biçer, T. C. Kaypmaz, Ü. Kadiroğlu, “Optimization of LiFePO4 synthesis by hydrothermal method,” Turk. J. Chem., vol. 38, pp. 297-308, 2014.
[16] Q. Tan, C. Lv, Y. Xu, J. Yang, “Mesoporous composite of LiFePO4 and carbon microspheres as positive-electrode materials for
lithium-ion batteries,” Particuology, vol. 17, pp. 106-113, 2014.
[17] J. Wang, Y. Tang, J. Yang, R. Li, G. Liang, X. Sun, “Nature of LiFePO4 aging process: Roles of impurity phases,” J. Power Sources,
vol. 238, pp. 454-463, 2013.
[18] W. Yu, L. Wu, J. Zhao, Y. Zhang, G. Li, “Synthesis of LiFePO4/C nanocomposites via ionic liquid assisted hydrothermal method,” J.
Electroanal. Chem., vol. 704, p. 214-219, 2013.
[19] N. Zhou, H-Y. Wang, E. Uchaker, M. Zhang, S-Q. Liu, Y-N. Liu, G. Cao, “Additive-free solvothermal synthesis and Li-ion intercalation properties of dumbbell-shaped LiFePO4/C mesocrystals,” J. Power Sources, vol. 239, pp. 103-110, 2013.
[20] M-Y. Cho, K-B. Kim, J-W. Lee, H. Kim, H. Kim, K. Kang, K. C. Roh, “Defect-free solvothermally assisted synthesis of microspherical mesoporous LiFePO4/C,” RSC Adv., vol. 3 No. 10, pp. 3421-3427, 2013.
[21] X. Sun, K. Sun, Y. Wang, X. Bai, C. Chen, B. Cui, “Scale-up synthesis, Structure Characterization and Electrochemical Characteristics of C-LiFePO4 Nanocomposites for Lithium Ion Rechargeable Batteries,” Int. J. Electrochem. Sci. 8, pp. 12816-12836,
2013.
[22] J-F. Martin, M. Cuisinier, N. Dupré, A. Yamada, R. Kanno, D. Guyomard, “More on the reactivity of olivine LiFePO4 nano-particles
with atmosphere at moderate temperature,” J. Power Sources, vol. 196 No. 4, pp. 2155-2163, 2011.
[23] K. Shiraishi, K. Dokko, K. Kanamura, “Formation of impurities on phospho-olivine LiFePO4 during hydrothermal synthesis,” J. Power
Sources, vol. 146 No. 1-2, pp. 555-558, 2005.
[24] X. Ou, G. Liang, L. Wang, S. Xu, X. Zhao, “Effects of magnesium doping on electronic conductivity and electrochemical properties of LiFePO4 prepared via hydrothermal route,” J. Power Sources, vol. 184, pp. 543-547, 2008.
[25] L-H. He, Z-W. Zhao, X-H. Liu, A-L. Chen, X-F. Si, “Thermodynamics analysis of LiFePO4 pecipitation from Li–Fe(II)–P–H2O
system at 298 K,” Trans. Nonferrous Met. Soc. China, vol. 22 No. 7, pp. 1766-1770, 2012.
[26] S. Franger, F. Le Cras, C. Bourbon, H. Rouault, “Comparison between different LiFePO4 synthesis routes and their influence on its
physico-chemical properties,” J. Power Sources, vol. 119-121, pp. 252-257, 2003.
[27] N. Sofyan, D.Y. Putro, A. Zulfia, “Performance of Vanadium-Doped LiFePO4/C Used as Cathode for Lithium Ion Battery,” Int. J.
Technol., vol. 7 No. 8, pp. 1307-1315, 2016.
[28] J. Popovic, “Novel lithium iron phosphate materials for lithium-ion batteries,” Dissertation, University of Potsdam, 2011.
AUTHORPROFILE
Nofrijon Sofyan is an Associate Professor at the Department of Metallurgical and Materials Engineering, Universitas Indonesia. He obtained his B.Sc. in Chemistry from Andalas University, Padang, 1992, and M.Sc. in Materials Science from Universitas Indonesia, Jakarta, 1997. He received his Ph.D. in Materials Engineering from Auburn University, USA, 2008. His research areas include nanomaterials, dye-sensitized solar cells, lithium ion batteries, and superconductors.
Guntur Tri Setiadanu is an Engineer at Research Center for Electricity Technology Development, New and Renewable Energy and Energy Conservation, Ministry of Energy and Mineral Resources. He received his Bachelor of Engineering from Department of Mechanical Engineering, Gadjah Mada University, Yogyakarta, 2003. He received his M.Eng. in Metallurgical and Materials Engineering, Universitas Indonesia, 2014.
Anne Zulfia is a Professor at the Department of Metallurgical and Materials Engineering, Universitas Indonesia. She obtained her B.Eng. in Metallurgical Engineering from Universitas Indonesia. She received her Masters and Ph.D. from Department of Engineering Materials, University of Sheffield, United Kingdom. Her research areas include nanocomposite materials and lithium ion batteries.
Evvy Kartini is a Research Professor at National Nuclear Energy Agency, Republic of Indonesia. She is an expert on the neutron scattering and solid state ionic. She began her research on Superionic glasses early 1990, at Hahn Meitner Institute, Berlin, Germany. The existence of Boson peaks in ZnCl2 and CKN glasses were an