Single Index Model Portfolio Formation
Application
L.P. Dewi
1, A. Handojo
1, Y.M. Chrislie
11Informatics Department, Petra Christian University, Indonesia.
Abstract
—
Inflation is one of the main reasons why we need toinvest, either on funds or assets that already exist or that we will have in order to have a "value" to be sustained and certainly expected to increase. Stocks are generally thought of as good inflation hedges over the long run as people are able to gain higher prices to offset rising costs. People always do the investment planning to choose which stock they will invest. It is necessary to determine the investment portfolio from various stocks to help investors decide the efficient combination stocks investment. This portfolio will assist investors to minimize the risk of stock investments, so that the risk of losses on the stock can be covered by gains on other stocks. This study developed system to form stocks portfolio used the Single Index Model which is a simplification of the Markowitz Model. The system is analyzed and tested using internal and external evaluation. The internal evaluation is based on the specification-based testing. Validation calculation of application is done by comparing the application result to the manual calculation. The system is able to run and show the result as expected. The second evaluation was performed by distributing questionnaires to 80 respondents as users. . In user interface, the score is 4.2, content and information of the application is 4.125, stock data processing is 4.925, provided features is 4.212, ease of use is 4.65 and finally users considered overall this application is 4.5875.
Index Terms—Portfolio; Single Index Model; Stock; Website application
I. INTRODUCTION
Investment is often defined as setting aside money or capital in investment instruments (such as gold, stocks, mutual funds, property etc.) in hopes of obtaining financial returns in the future. Basically the investment is like "buying" now and "reselling" at a higher price in the future [1].
There are several reasons that investment is important, one of the reasons is preparation of the future. As we know, over time the value of the currency may decrease due to inflation, for example the rise in prices of goods and services. Inflation is one of the main reasons why we need to invest, either on funds or assets that already exist or that we will have in order to have a "value" to be sustained and certainly expected to increase.
Stocks are generally thought of as good inflation hedges over the long run as people are able to gain higher prices to offset rising costs. Stock returns, however, may lag inflation, especially over shorter horizons [2]. People always do the investment planning to choose which stock they will invest. Investment planning is a challenging task based on buy-hold strategies. This strategy has a principle to buy market stocks and hold them for a certain period of time. The reason of this strategy is market stocks price has
tendency to increase [3].
In general, investors are risk averse, which mean investors want a form of investment that has a low risk with high returns, and one way to reduce the risk level by the implementation of investment in various forms [4]. It is necessary to determine the investment portfolio from various stocks to help investors decide the efficient combination stocks investment. This portfolio will assist investors to minimize the risk of stock investments, so that the risk of losses on the stock can be covered by gains on other stocks. Finally, the expected return on investment is compensation for the cost and the risk of decline in purchasing power due to inflation effect [5].
There are various methods of industrial stocks market that can be used to form portfolio, such as Markowitz model as developed by Harry Markowitz in 1952 [6], and Single Index Model developed by William F. Sharpe in 1963 [7]. Previous research has suggested that the formation of portfolios using single index model is better than the constant correlation model using weekly stock data from 2002-2004 [8]. Previous research in 2008, with a similar topic of making a portfolio using weekly stock data of 2002-2007. The result proves that the formation of single index model portfolio is better than constant correlation model [9]. Other research in 2015 presented single index model single as a method in analyzing its shares [10]. Francis Mary and G. Rathika research used single-index model was applied by using the monthly closing prices of 10 companies listed in NSE and CNX PHARMA price index for the period from September 2010 to September 2014 [11]
This study developed system to form stocks portfolio used the Single Index Model which is a simplification of the Markowitz Model. Thus, to conclude the purpose of the system development is to produce an application that can assist investor in investment. So it is expected to help investor to obtain information and recommendation related to these stocks.
II. LITERATURE REVIEW
A. Single Index Model
Single Index Model introduced by William Sharpe, is a simplified form of Markowitz model calculation. Single Index Model can also be used to calculate the expected return and portfolio risk. The single index model is based on the observation that the price of a securities fluctuates in the direction of the market index [12]. Single Index Model can be used in optimal portfolio determination by comparing excess return to beta (ERB) with cut-off-rate (C) [13].
stock prices also decreased. This illustrates that the returns from securities may be correlated due to a general reaction to changes in market value [12]. The steps in establishing a portfolio using Single Index Model are as follows:
1) Calculates the return and expected return of each stock. Stock return is stock return rate in investments through a portfolio [14]. Expected stock return is expected return to be obtained by investor in the future [12]. The stock return and mean of stock return formula are presented in Eq. (1) and Eq. (2)
Ri = (Pt– P t-1) / P t-1 (1)
E(Ri) = ∑Ri / n (2)
where:
Ri = Stock return
E(Ri) = Expected stock return P t = Closing stock price at t P t-1 = Closing stock price at t-1 n = Number of data
2) Recalculating the market return and market expected return based on IHSG (Index Harga Saham Gabungan) or ICI (Indonesia Composite Index). These formulas are describes in Eq (3) and (4).
Rm = (IHSGt– IHSG t-1) / IHSG t-1 (3)
E(Rm) = ∑Rm / n (4)
where:
Rm = Market return
E(Rm) = Expected market return
IHSGt = Indeks Harga Saham Gabungan at t IHSG t-1 = Indeks Harga Saham Gabungan at t – 1
3) Calculate the risk of each share (stock variance). Variance is used to measure risk of expected stock return. Risk can be defined as a deviation from the realized return with the expected return [15]. The formulas can be seen in Eq. (5) and (6).
σi2= ∑ (Ri– E(Ri) ) / n (5)
σi= √ σi2 (6)
where:
σi2 = Stock variance
σi = Stock standard deviation
4) Calculating market risk (market variance). Eq. (7) and (8) show the formula.
σm2= ∑ (Rm– E(Rm) ) / n (7)
σm= √ σm2 (8)
where:
σm2 = Market variance
σm = Market standard deviation
5) Calculate the alpha and beta. Beta (β) is the unique risk of individual stocks, calculating the slope of stock realized return with the market realized return (IHSG/ICI) within a certain period. Beta is used to calculate Excess Return to Beta (ERB) and B needed to calculate Cut-Off Point (C) [12].
(9) α = E(Ri) –(β x E(Rm))
(10)
where:β = Beta
σim = Stock covariance
α = Alfa
6) Calculates the residual variance as shown in Eq (11).
(11)
where:
σei2 = Residual variance
βi = Beta
σm2 = Market variance σi2 = Variance
7) Calculating ERB (Excess Return to Beta Securities). Excess Return to Beta (ERB) is an excess of stock return on the risk free rate return, called the return premium per unit of risk as measured by beta [13]. The formula is presented in Eq. (12).
ERB = (Ri– Rf) / βi (12)
where:
ERB = Excess Return to Beta Securities Ri = Stock return
Rf = Risk Free Rate βi = Beta
8) Calculate A and B. A and B are used to find the Cut Off Rate (C) value. Calculations for values of A and B can be done using the Eq, (13) and (14).
A = (13)
B = (14)
where:
E(Ri) = Expected stock return Rf = Risk Free Rate
βi = Beta
σei2 = Residual variance
9) Calculating Cut-Off Rate (C). Cut-Off Rate (C) is Cut-off rate is the minimum rate which will be received by investor, [13]. The formula to count the C is shown in Eq. (15).
C = (15)
where:
Ci = Cut-Off Rate σm2 = Market variance
10) Determine the stock candidates in the formation of a portfolio. Stocks that have ERB equal to or greater than Cut-Off Point (C *) (ERB ≥ C *), are candidates in portfolio formation.
11) Calculates the weight of each stock. Eq. (16) shows formula to count the stock weight. Eq. (17) determine the proportion of each fund shares forming the portfolio.
Wi= Xi / ΣZi (16)
where:
Wi = Weight of stock
Zi = Proportion of each stock = x (ERB - C *) (17) σei2 = Residual variance
βi = Beta
beta and alpha will be used in calculating portfolio expectation returns. Beta and alpha portfolios can be calculated using the formulas are described in Eq. (18) and (19).
13) Calculating Portfolio Return and Portfolio Risk. The last stage is to determine portfolio return (Rp), portfolio expected return (E(Rp)), and portfolio risk which can be calculated basis, thereby reducing administrative time [16]. Several crontab files exist on a Linux system. They are used to run system jobs. Users on the system can also define their own crontab files.
In performing system administration, the settings for crontab are done through a crontab file that contains a schedule of time and scripts to be executed. System on linux for crontab has default / etc / crontab, which can be used for scheduling every hour, daily, weekly, and monthly [16]. The use of crontab is also not too complicated with just the following command:
*/10 8-17 * * 1-5 fetchmail mailserver
In this example, every 10 minutes (*/10) between 8:00 AM and 5:50 PM (8-17), from Monday to Friday (1-5) the fetchmail command is run to fetch incoming emails from the mailserver server.
III. SYSTEM DESIGN
This research was conducted in order to establish website application for optimal portfolio based on the stocks’ performance by using single index model. The system is taken data provide by in the Indonesia Stock Exchange (www.idx.co.id). The historical data of stock prices which are sought and processed.
Figure 1 illustrated the features and scope of system. This application has three users or actor which are Administrator, Member, and also System timer. Each actor has several actions to do. Application administrators are critical to keeping the applications on running. System timer allows application to raise action on a specified interval. Here, the system timer is set at 6 p.m. Member is a person who has been actively engaged in the using of this application.
Administrator
Figure 1: Use case diagram of the system
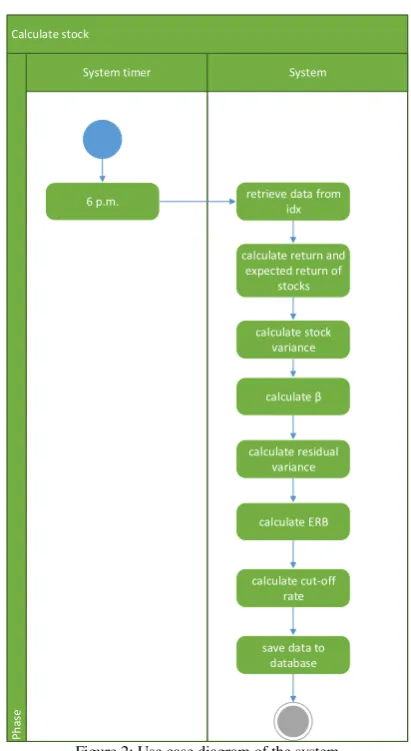
Timer as scheduler works at 6 p.m. The application downloads daily stock from Indonesia Stock Exchange. Figure 2 shows the actions for the system. After calculating daily stock and also IHSG/ICI, the portfolio can be made by the user.
6 p.m. retrieve data from
idx
Figure 2: Use case diagram of the system
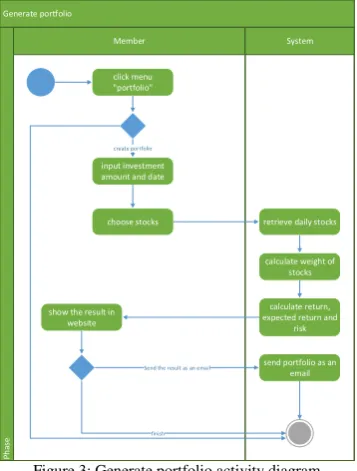
Generate portfolio
Member System
P
h
a
se
click menu "portfolio"
create portfolio
input investment amount and date
choose stocks retrieve daily stocks
calculate weight of stocks
calculate return, expected return and
risk show the result in
website
Send the result as an email send portfolio as an
finish
Figure 3: Generate portfolio activity diagram
IV. RESULT AND DISCUSSION
A. Portfolio Calculation
The system is analyzed and tested using internal and external evaluation. The internal evaluation is based on the specification-based testing. Specification-based testing aims to test the functionality of software according to the applicable
requirements [17]
. This testing requires thorough test cases to be provided to the tester, who then can simply verify that for a given input, the output value (or behavior), either "is" or "is not" the same as the expected value specified in the test case.Test cases are built around specifications and requirements. The application is tested with calculations of the selected stocks are MLPL, CMNP, BMTR, HMSP, INDY. Then, manual calculation is done to compare the result. Figure 4 shows the results for the portfolio.
Figure 4: The return portfolio
Figure 5 presents the expected return and portfolio risk.
Validation calculation of application is done by comparing the application result to the manual calculation. Figure 6 presents the manual calculation. The system is able to run and show the result as expected.
Figure 6: Calculation
B. User Acceptance Testing (UAT)
The purpose of user acceptance testing (UAT) is to gather input from actual system users, those who have experience with the business processes and will be using the system to complete related tasks [18, 19]. An important aspect in human computer interaction is usability evaluation that improves software quality [20].
The evaluation tests was performed by distributing questionnaires to 80 respondents as users. This questionnaire has 6 main questions about this application, and then distributed to users. The questionnaire was built using the Likert scale [21] with the lowest score of 1 and the highest 5. As a summary of the results of this questionnaire can be seen in Table 1.
Table 1
Summary result of the user questionnaire EVALUATED ASPECT
SCORE NO ASPECT
1. User interface 4.2 2. Content and information 4.125 3. Data processing 4.925 4. Features 4.212 5. Ease of use 4.65 6. Overall 4.5875
DESCRIPTION:5.VERY GOOD –1.POOR
The score in the Table 1 represent value of each aspect evaluated. In user interface, the score is 4.2, content and information of the application is 4.125, stock data processing is 4.925, provided features is 4.212, ease of use is 4.65 and finally users considered overall this application is 4.5875. I can be concluded the user is considered satisfied with this application. The Likerts [21] scale assessment that has been determined has a range between 1 is the lowest and 5 is the highest. Based on the above overall score, the system able to support the user on representing stock portfolio.
V. CONCLUSION
Based on the research, it can be concluded as follows: 1. Based on the results of testing the application is
able to run in accordance with its function.
2. Based on the results of manual calculation method "Single Index Model" can be applied and realized into a website-based applications.
application is 4.125, stock data processing is 4.925, provided features is 4.212, ease of use is 4.65 and finally users considered overall this application is 4.5875.
REFERENCES
[1] S. B. Smart and L. J. Gitman, Fundamentals of investing (12th Edition), Pearson Series in Finance, Jan 10, 2013.
[2] PIMCO ETFs, “Inflation and its impact to investments,” retrieved
from http://www.pimcoetfs.com/SiteCollectionDocuments/BAS087-Inflation.pdf, December 15, 2016.
[3] J. Hobbs, and V. Singh, “A comparison of buy-side and sell-side analysts,” Review of Financial Economics, vol. 24, 2015, pp. 42-51. [4] F. K. Reilly, and K. C. Brown, Analysis of investments and
management of portfolios 10th edition, Thomson South-Western
Cengage Learning, 2012.
[5] E. Tandelilin, Portfolio and investment theory and application 1st edition, Yogyakarta: Kanisius, 2010.
[6] H. Markowitz, “Portfolio Selection,”The Journal of Finance, vol. 7 no. 1, 1952, pp. 77-91.
[7] W.F. Sharpe, “Capital asset prices: a theory of market equilibrium under condition of risk,”Journal of Finance, vol. 19, 1964, pp. 425-442.
[8] R. Widyantini, Single index model and constant correlation for optimal portofolio: analisa saham di Bursa Efek Jakarta (thesis, Masteral degree Universitas Indonesia), unpublished, 2005.
[9] E. Umanto, “Analisis dan penilaian kinerja portofolio optimal saham- saham LQ-45,”Bisnis & Birokrasi Jurnal Ilmu Administrasi dan Organisasi, vol. 15 no. 3, 2008, pp. 178-187.
[10] R. Marlina, “Formation of stock portfolio using single index model (case study on banking shares in the indonesia stock exchange)”,
International Journal of Business, Economics and Law, vol. 8 issue 1, 2015.
[11] J.F. Mary and G. Rathika, “The single index model and the construction of optimal portfolio with cnxpharma scrip,” International Journal of Management (IJM), vol. 6 issue 1, 2015.
[12] Jogiyanto, Teori portofolio dan analisis investasi (edisi 10 cetakan ke-2), Yogyakarta: BPFE, 2016.
[13] M. Sukarno, Analisis pembentukan portofolio optimal saham menggunakan metode single indeks di Bursa Efek Jakarta. Semarang: Universitas Diponegoro, 2007.
[14] J. Ganto, M. Khadafi, W. Albra, and G. Syamni, “Pengaruh kinerja keuangan perusahaan manufaktur terhadap return saham di Bursa Efek Indonesia,” Media Riset Akuntansi, Auditing dan Informasi, vol. 8 no. 1, 2008, pp. 85-96.
[15] S. Husnan, S, Dasar - dasar teori portofolio dan analisis sekuritas. Yogyakarta: AMP YKPN, 2003.
[16] C. Negus and F. Caen. 2007, Ubuntu Linux Toolbox: 1000+ Commands for Ubuntu and Debian Power Users 1st Edition, Wiley, 2007.
[17] G. T. Laycock, The Theory and Practice of Specification Based Software Testing" (Doctoral degree). Departement of Computer Science, Sheffield University, UK. 1993.
[18] G. S. Klein, “User acceptance testing,”Quality Assurance, vol. 10 no. 2, 2003, pp. 91–106.
[19] G. B. Larson, “The user acceptance testing process,”Journal of Systems Management, vol. 46 no. 5, 1995, pp. 56–62.
[20] W. Butt, and W. Fatimah, “An overview of software models with regard to the users involvement,”International Journal of Computer Science, vol. 3 no. 1, 2012, pp. 107–112.
[21] H.V. Laerhoven, Zaag‐Loonen, and B.H. Derkx, “A comparison of Likert scale and visual analogue scales as response options in