Jurnal
Teknologi
Customer Mapping for Cable TV Industries in Indonesia Rural Area Using
Geographical Information System
Yulius Hari,a,* Darmantoa, Lily Puspa Dewib
a
Information Technology Department, Widya Kartika University, Surabaya, Indonesia b
Informatics Department, Petra Christian University, Surabaya, Indonesia *Corresponding author: [email protected]
Article history
Received XXXX
Received in revised form XXXX Accepted XXXX
Graphical abstract
Abstract
House numbering is the system of giving a unique number to each building in a street or area, with the intention of making it easier to locate a particular building. The house number is often part of a postal address. The term describes the number of any building (residential or not) or vacant lot with a mailbox. House numbering schemes vary by place, and in many cases even within cities. In some areas, especially in rural area of Indonesia, the house or building are not numbered yet. This is caused by the demography and the geography. This study was done on cable TV industries in Sorong Papua, Indonesia. Where the main problem in this research is how to reduce the number of customer payment arrears and minimize duration of customer dues. There are several aspects of why customers in arrears, on the one hand because of the difficulty of the collector to find the location of the customer and on the other hand due to poor customer habits, so that they do not want to pay. The research model was constructed with a Geographical Information System to determine the mapping customers. The mapping process is done with the customer to establish a classification of association rule between customers. The results of this study could assist companies in finding the location of customers quickly and make the mapping according to customer payment behavior. The approach of the results obtained can be further used to determine the best strategy in dealing with customers.
Keywords Geographical information system, customer mapping, decision support system, association rules analysis, infrastructure planning
© 2014 Penerbit UTM Press. All rights reserved.
1.0 INTRODUCTION
Despite the global economic downturn of recent years, Indonesia's economy continues to grow steadily, and it has now achieved the status of a middle-income country. The process of democratization and decentralization continue, and this has helped contribute to the peaceful resolution of long-simmering regional conflicts, for example in Aceh, Maluku, North Maluku and Papua. As for now Indonesia is the largest economy growth in Southeast Asia. Steady economic growth has led to a gradual development in rural area. In many of these eastern provinces farmers eke out a largely subsistence existence. These provinces are home to many adat, or indigenous communities, who have often been on the margins of development processes. The coastal areas are environmentally degraded, while upland villages are the most disadvantaged and require development programs adapted to the many constraints they face, including isolation and difficulty of access [1, 2].
This research conducted in Sorong as the developing rural area in Indonesia. Sorong is a chartered coastal city in the eastern Indonesian province of West Papua. Its only land borders are with
Sorong Regency [3]. It is the gateway to a famous Indonesia's Raja Ampat Islands, species rich coral reef islands in an area considered the heart of the world's coral reef biodiversity. It also is the logistics hub for Indonesia's thriving eastern oil and gas frontier. Sorong has experienced exponential growth in the last five years, and further growth is anticipated as Sorong becomes linked by road to other frontier towns in Papua's Bird's Head Peninsula.
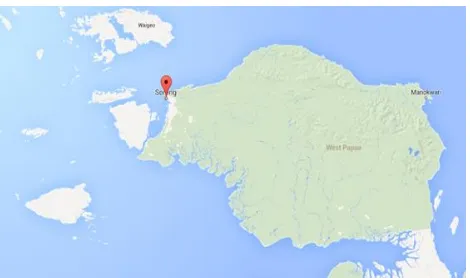
visualize the mapping of the location of the study can be seen in Fig. 1.
Figure 1 Sorong Demographic located in Papua Peninsula
Geographically, as shown in Fig 1, the city has a total area of Sorong 1,105 km2 or about 1:13% of the area of West Papua. Topography varies from city sliding mountains, slopes, hills and partly lowland, east surrounded by dense forest which is protected forest and jungle tours. Demographically based on the results of the 2010 Population Census enumeration, the population of Sorong (provisional figures) is 190.341 inhabitants, which consisted of 99.898 men and 90.446 women. The largest population in the District of North shoves as much as 44.774 people and the smallest population is in Sorong district with a total population of 9.710 islands inhabitants. With a total area of 1,105 km² which is inhabited by the 190.341 population, then the average population density Sorong is for 91 people / km2. Sub district highest density is Sorong District Manoi which amounted to 313 persons / km², while the lowest Islands District shoves the 49 people / km². Growing economic growth, especially in the natural resources sectors such as agriculture, plantation and tourism make the city into a city that has tremendous regional growth [3].
This research was conducted at the cable TV company in the city of Sorong. The company has a lot of problems due to demographic factors, lack of infrastructure and customary or traditional culture. The demographic factors and lack of infrastructure make cable TV network construction should be done independently. In addition to the cost factor demographic conditions also led to the use of wireless network technology is also not possible to use in distributing broadcast to cable TV subscribers. Besides, a problem that often occurs is when a network interruption occurs, it takes a long time to analyze the damage that occurs in a specific point or location.
As the implications of the services rendered, the cable TV subscribers are required to pay within a certain time as a preset, monthly, quarterly, or semi-annually. However, often the awareness of customers to make payments or simply remember due dates are often overlooked. The demographics of the area are often used as an excuse for delinquent payments. Dues payment process, it is given two payment options independently, the first is at headquarters and the second is the payment process through billing collector. Billing collector collection will be divided based on the work area to get around the door-to-door to collect payments from customers. The payment process cannot be done completely independently because of demographic factors, while to process payments through banks or other media is not available because of the limitations of the existing infrastructure.
As a form to prepare for the upcoming customer growth, the company must prepare the infrastructure and the network needed to accommodate those customer. Therefore a system to support the decision making process for the infrastructure planning is urgently needed. Since the development process is costly and carried out in stages and it is unlikely done in the short period of time. While each company is compete to build a better and larger infrastructure to server a larger customer. Thus, the decision of the planning or to build the infrastructure also determines the success of a company's sustainability.
From the above problems, we need a system that is able to assist in resolving customer problems and also able to provide input to the decision making process of making new infrastructure. As a solution to the problem above, it requires a Geographical Information System (GIS) that is able to present information from both text data and spatial data, which are indispensable to the process of decision-making [2,6]. The system design will be explained further in the next section.
2.0 EXPERIMENTAL
The main objective of this research is to form a system that can help the decision-making process. To solve the problem described in the introduction. The methods and approaches used in building this system can be described in more detail in the description below.
The system is built using the principles of Systems Development Life Cycle (SDLC). System Development Life Cycle (SDLC) is also the center of the development of an efficient information system [7]. SDLC consists of four (4) key steps, namely, planning and selection, analysis, design, implementation and operational [7,8]. In addition, the System Development Life Cycle (SDLC) is a process of understanding how the information system can support business needs, designing systems, building systems, and give it to the user [9].
Based on the explanation above, it can be concluded as an SDLC cycle to build the system and give it to the user through the phases of planning, analysis, design and implementation in a way to understand and select the state and processes the user to be able to support the needs of the user. SDLC is required to use the start of user data sources referenced in the planning, analysis, design and implementation. The use of this reference is so that the system can be built to bridge the needs of users of the problems it faces.
As mentioned in the problem above, the customer required a mapping to identify its customers based on parameters [10]. In mapping the customer can be divided into two major parts shows the behavior of customers based on buying habits, customer satisfaction or problems of each customer and shows the location of the customer, resource assets owned or placed in a real map. In this case the system is built using these two approaches so as to indicate the location and behavior of consumers, including to facilitate the process of resolving a customer complaint [10].
results of all these operations. Geographic information science is the science underlying geographic concepts, applications, and systems[11]. does not want any duplication of data and to reduce the burden on the primary server that uses PostgreSQL. Another goal of this merger is an important database is the system is able to synergize with other systems that work in transactional and require massive resource. of residence. The process of digitization is done by conducting a survey site to capture the coordinates of the field that includes both new and existing customers and also to record the device used. Data collection time range is from 2013 and will continue to grow in line with growth in the number of customers.
In the early stages of data collection is done on existing customer data. Then from the customer data is further processed into several areas, making it easier to divide customers based collector. In the old data is done based on the data sharing area districts so that the collector is often difficulty in determining its jurisdiction is too broad and of the difficulty in determining the amount of the company's most appropriate collector to serve the customer. To divide an area by area method is used K-Mean Clustering, that region will be divided based on the area that would later be regarded as nodes.
As for the K-Mean algorithm in question can be described in the following formula: assignments. The algorithm has converged when the assignments no longer change. Since both steps optimize the within-cluster
sum of squares (WCCS) objective, and there only exists a finite
number of such partitioning’s, the algorithm must converge to a
(local) optimum. There is no guarantee that the global optimum is found using this algorithm [12].
The algorithm consists of a simple re-estimation procedure as follows. Initially, the data points are assigned at random to the K sets. For step 1, the centroid is computed for each set. In step 2, every point is assigned to the cluster whose centroid is closest to
that point. These two steps are alternated until a stopping criterion is met, i.e., when there is no further change in the assignment of the data points [12].
In the K-Means algorithm is one of the key variables in determining the number of clusters to be formed or called with variable K in the above formulation. In this case the number of clusters or variable N is determined based on the number of posts for collector. The results of these clustering implants useful not only to divide the customers towards the collector, but furthermore be used to measure the performance of the infrastructure in the area.
Once the data is obtained and divided into multiple nodes by using the K-mean clustering, then the next linked the data to look for relationships data held. The purpose of searching the data relation here is to divide the group based on the parameters of its customers, it will be very helpful in determining the payment policy for each customer as well as to conduct cross-selling of products that have been used. The method used is to use data mining approaches to association rule models.
Association rule mining finds interesting associations and/or correlation relationships among large set of data items. Association rules show attributes value conditions that occur frequently together in a given dataset. It is intended to identify strong rules discovered in databases using different measures of interestingness [13]. A typical and widely-used example of association rule mining is Market Basket Analysis [14].
As an example of association rule approach to the problems above can be described as follows:
Let I = {i1, i2… in} be a set of literals call product items. Let D be a set of all customer where each transaction T is a set of items such that T ⊆ I. Let X, Y be a set of items such that X, Y ⊆ I. An association rule is an implication in the form X ⇒ Y, where X ⊂ I, Y ⊂ I, X ∩ Y = ∅.
The goal is to find the rules that are useful to users. To measure the usefulness is using objective measurement. Objective measures involve statistical analysis of the data, such as support confidence is said to have minimum confidence.
The process of finding relationship of the data with association rules method is done with the help of Weka Program from the university of Waikato [15]. Weka is a collection of machine learning algorithms for data mining tasks. Weka contains tools for data pre-processing, classification, regression, clustering, association rules, and visualization. Weka is open source software issued under the GNU General Public License.
3.0 RESULTS AND DISCUSSION
Figure 2 Customer cluster in one node
From Fig. 2 it can be seen at one of the regional distribution of the nodes. In Figure 2 it can be seen there are parts collected into one point and has a number, it represents a cluster or area that has a lot of customers that are close together so that they can be combined into a single location at the breakdown when the zoom level increases then the location of the respective customers will be visible. If the node has many customers and outside the region or have a large enough then the node can assign more than one person to assist the collection of bill collectors to customers. In determining the distribution of the collector, then in that area back in the cluster based on the number of collectors who are assigned in the area.
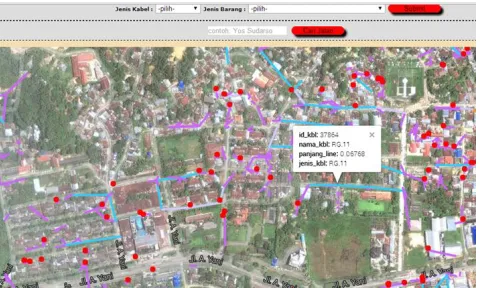
Figure 3 Customer mapping of arrears customer
One of the goals of this research is to reduce the number of customers in arrears, therefore made a mapping based customer payment habits as shown in Fig. 3 Each point on the map represents the location of the customer who can also be seen that customer-related information ranging from customer identity, amount of arrears to the charge collector. From this figure it can be seen that there are many customers who have a habit of delaying payments with varying intensity ranging from one month to more than six months. Although there are customers who have long overdue but are often unable to be followed due to the termination of cable TV networks have to be done manually to the customer site. With the lack of knowledge about who is delinquent and the location where the network termination unilaterally is extremely difficult. But with this system can be mapped based customer payment habits. Of these habits then the system will automatically provide proactive notification to customers automatically via SMS media related to payment. Of
customer service which is then capable of directing the collector to handle the customers. This can increase customer awareness of the obligations.
From the results of the implementation of the system can be seen a significant change from the previous there are more than 6420 customers who are overdue for more than three months after mapped and well done approach to customers through SMS and call center communications. The amount is reduced by reduced by 61.6%. From these results it can be concluded that by building a customer mapping to facilitate the determination of strategic decision-making process, especially in the determination of communication and increase customer awareness. So in this case the approach will change from the previous reactive or waiting on customers to be proactive by increasing communication and awareness of the customer.
In the formation process of mapping customer data is also processed using association rules. From these data sought relationships among the data from the existing characteristics that form a certain pattern according to need. For example, in the process of doing cross selling or offering certain broadcast packets, it can be determined potential customers for the product. It can be seen from the customer parameters such as the amount of TV you have, the number of broadcast packets that take and other information.
Through association rules also obtained an interesting relationship, especially about the potential of a customer in arrears based on the domain region. It turns out that the domain will determine the behavior of a customer pays. For example, customers in the coastal areas more reluctant to pay even though they have access to payments or ground transportation facilities are also compared with the collector of the island community. Communities in the islands tend to be more diligent in fulfilling their responsibilities despite their more distant location and the payment process was also done manually to the counter. This is caused by the level of demand for the island communities of their main entertainment centers namely cable TV broadcasts.
As mentioned at the beginning of the system is also expected to facilitate the decision-making process, especially in the process of forming a new cable TV network. To accommodate this, the system process all the data, the following equipment owned by location then represented into a digital map. The map consist a device located through the Sorong and the cable line connecting from one device to another device. Each of the device and line have its own parameter. For the example of these system is network map with device parameter that can be seen in Fig. 4.
Hence this feature is able to assist in some of the following, among others: (1) facilitate the search for the location of the device and the cable network in a particular area. (2) Assist in knowing the age of the equipment, so as to facilitate the process of rejuvenation or replacement equipment necessary tools. (3) Ability to simulate the installation of equipment and gave the new network in certain areas. (4) Being able to measure the traffic capacity of a particular area that can be expanded if necessary owned network.
Based on Fig. 4, it can be described that each type of appliance color differentiated by type of equipment installed. They have also been carried out on the cable network, which is also the color differentiated by type of cord, while for each tool has the required properties or information such as the model, voltage, altitude elevation, up to the number of ports owned. As for the cable network has a special property where the signal strengths. Signal strength property is required for the majority of cable TV networks still using coaxial cable types with different forms of its variants. Thus, in the simulation process when it reaches a certain distance in order to advise the system reinforced with a signal booster or amplifier.
System measure the Characteristic impedance in ohms (Ω). Neglecting resistance per unit length for most coaxial cables, the characteristic impedance is determined from the capacitance per unit length (C) and the inductance per unit length (L). Those parameters are determined from the ratio of the inner (d) and outer (D) diameters and the dielectric constant (𝜖). The characteristic impedance is adopted the formulation from Elmora, et. al [16]
(2)
Attenuation (loss) per unit length (in decibels per meter) is dependent on the loss in the dielectric material filling the cable, and resistive losses in the center conductor and outer shield. These losses are frequency dependent, the losses becoming higher as the frequency increases. Skin effect losses in the conductors can be reduced by increasing the diameter of the cable. A cable with twice the diameter will have half the skin effect resistance. Ignoring dielectric and other losses, the larger cable would halve the dB/meter loss. As limitation of the simulation the system only consider the loss at the cable and not considering the loss at the connector.
Furthermore, as one other result of the formation of this mapping is to facilitate customers in handling damage. System integrated with customer service so that any damage will be clearly mapped location. Specifically for handling customer complaints damage if there is more than one location in the same area or node it will be seen whether the disturbance caused by the device at the customer site or as a network system errors. This system allows the observation of existing networks so that inferred bias or damage that may occur if there is a change of the network of the affected area can be informed in advance, thereby reducing the number of customer complaints and improve fiber optic cable as the medium, but the system has not been able
to accommodate the network because the network has a different shape to the calculation and distribution of power that is different from the major networks in use today. Third, if there is a customer or device in a nearby location will overlap each other; this is due to limitations of scale in image data map provided by Google
2. Establishment of customer mapping opens up many new opportunities to multiply the potential customer. With the approach of association rule obtained a variety of making process. Where the subsequent activities are more heavily on customer relation management approach.
5. Simulation of the installation of the new network is not able to calculate in detail each of the parameters, but able to give a rough idea about the materials and tools necessary requirement for future expansion process.
Acknowledgement. This research was done with the cooperation of PT Cendrawasih Wiputra Mandiri, Sorong, West Papua.
References
[1] Allerton, C. 2003. Authentic Housing, Authentic Culture?: Transforming a Village Into a 'Tourist Site' In Manggarai, Eastern Indonesia. Indonesia and the Malay World. 31(89): 119-128.
[2] Chan, D.V., A.H. Christine, N.C. Hurch, E.S. Rogers, and S. Gopal. 2014. Measuring Community Integration Using Geographic Information Systems (GIS) and Participatory Mapping for People Who Were Once Homeless. Health & Place. 27(0): 92-101.
[3] Kementerian Dalam Negeri. 2011. Kabupaten Kota Sorong. Retrieved December 10, 2013, from http:///www.kemendagri.go.id/pages/profil-daerah/kabupaten/id/92/name/papua-barat/detail/9271/kota-sorong.
[4] King, P. 2004. West Papua and Indonesia Since Suharto: Independence, Autonomy or Chaos?Australia: University of New South Wales Press
[5] Mote, O., and D. Rutherford. 2001. From Irian Java to Papua: The Limits of Primordialism in Indonesia's Troubled East. Indonesia. 1(1): 115-140.
[6] Park, S., S. Jeon, S. Kim, and C. Choi. 2011. Prediction And Comparison of Urban Growth by Land Suitability Index Mapping Using GIS And RS in South Korea. Landscape and Urban Planning. 99(2): 104-114.
[7] Al-Zahrani, S. 2006, An Information Management System Model for the Industrial Incidents in Saudi Arabia: A Conceptual Framework Based on SDLC Methodology. Journal of Computer Science. 2(5): 447-454.
[9] Weitzel, J.R., and L. Kerschberg., 1989. Developing Knowledge-Based Systems: Reorganizing the System Development Life Cycle. Communications. ACM. 32(4): 482-488.
[10] Chakraborty, A., Mandal, J.K. Mandal, S.B. Chandrabanshi, and S. Sarkar. 2013. A GIS Anchored System for Selection of Utility Service Stations through Hierarchical Clustering. Procedia Technology. 10: 762-772.
[11] Maliene, V., V. Grigonis, V. Palevicius, and S. Griffiths. 2011. Geographic Information System: Old Principles with New Capabilities. Urban Design International. 16(1): 1-6.
[12] K. Krishna and M. Murty. 1999. Genetic K-means Algorithm. IEEE Transactions on Systems, Man and Cybernetics – Part B: Cybernetics. 29(3): 433–439.
[13] Agrawal, R., T. Imielinski, and A. Swami. 1993. Mining Association Rules between Sets of Items in Large Databases. Proceedings of the 1993 ACM SIGMOD international conference on Management of data, Washington, D.C., USA. 207-216.
[14] Boztuğ, Y., and T. Reutterer. 2008. A Combined Approach for Segment-Specific Market Basket Analysis. European Journal of Operational Research. 187(1): 294-312.
[15] Mark H., E. Frank, G. Holmes, B. Pfahringer, P. Reutemann, and I.H. Witten. 2009. The WEKA Data Mining Software: An Update. SIGKDD Explorations. 11(1): 10-18.