LAMPIRAN A
Percobaan Validasi Metode Analisa Propranolol HCl
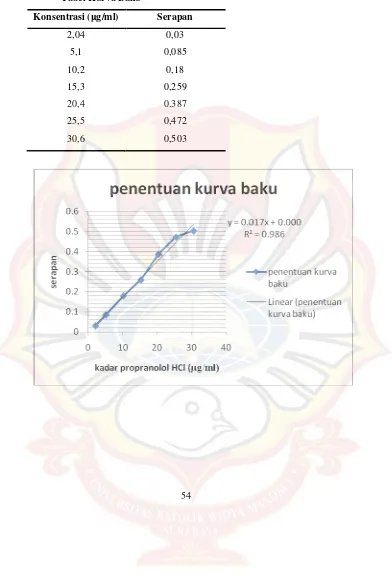
1. Penentuan Kurva Baku
Berikut ini adalah data dari kurva baku selama tiga hari C1
( g/ml)
A1 C2
( g/ml)
A2 C3
( g/ml) A3
2,04 0,03 2 0,03 2 0,03
5,1 0,085 5 0,086 5 0,084
10,2 0,180 10 0,183 10 0,182
15,3 0,259 15 0,257 15 0,261
20,4 0.387 20 0.389 20 0.387
25,5 0,472 25 0,468 25 0,470
30,6 0,503 30 0,501 30 0,504
a = b = r = 0,000214 0,0175 0,9934 a = b = r = 0,001934 0,0177 0,9930 a = b = r = 0,0006 0,0179 0,9938
Tabel Kurva Baku
Konsentrasi ( g/ml) Serapan
2,04 0,03
5,1 0,085
10,2 0,18
15,3 0,259
20,4 0.387
25,5 0,472
2. Perhitungan LOD dan LOQ
LOD diperoleh dari rumus Q = 3 Sy/x / b, sedangkan LOQ diperoleh dari
rumus Q = 10 Sy/x / b.
C A Yi Yi - Yt ( Yi - Yt )2
2,04 0,03 0,03599 0,00599 3,588E-05 5,1 0,085 0,08968 0,00468 2,19E-05 10,2 0,18 0,1791 -0,0009 8,1E-07 15,3 0,259 0,2686 0,0096 9,216E-05 20,4 0.387 0,3581 -0,0289 8,3521E-04 25,5 0,472 0,4475 -0,0245 6,0025E-04 30,6 0,503 0,5369 0,0339 1,1492E-03 Jumlah 2,73535E-03
Sy/x =
= 0,023389527
Nilai b diperoleh dari kurva baku = 0,0175 LOD = 3 Sy/x / b
= 4,0096 g/ml LOQ = 10 Sy/x / b
3. Uji Akurasi
Penimbangan C teoritis
( g/ml )
Serapan C pengamatan
( g/ml )
%
recovery
50 mg/ml 30 0,518 29,52 98,4
50 mg/ml 30 0,527 30,03 100,1
50 mg/ml 30 0,523 29,80 99,3
50 mg/ml 30 0,528 30,09 100,3
49 mg/ml 30 0,517 29,46 98,2
51 mg/ml 30 0,531 30,26 100,9
Rata – rata % recovery = ( 98,4 + 100,1 + 99,3 + 100,3 + 98,2 + 100,9) / 6 = 99,53 ± 1,37
4. Uji Presisi
C teoritis
( g/ml)
Serapan C pengamatan
( g/ml)
% recovery
30 0,670 38,1825 127,275
30 0,644 36,7 122,333
30 0,671 38,2395 127,465
30 0,664 37,8404 126,1347
30 0,641 36,5292 124,2493
30 0,687 39,1516 127,946
Rata – rata % recovery = ( 127,275 + 122,333 + 127,465 + 126,1347 124,2493 + 127,946 ) / 6
SD = 2,1922
KV = x 100%
LAMPIRAN B
DATA – DATA dan PERHITUNGAN MOISTURE CONTENT
Formula (-1)
W1 (gram) W2 (gram) ( W1 – W2) % moisture
content
0,3451 0,3346 0,0105 3,04 %
0,3372 0,3286 0,0086 2,55 %
0,3623 0,3495 0,0128 3,53 %
Rata – rata 3,041 ± 0,492 % Formula (a)
W1 (gram) W2 (gram) ( W1 – W2) % moisture
content
0,1930 0,1920 0,0010 0,518 %
0,1987 0,1980 0,0007 0,35 %
0,2463 0,2405 0,0058 2,355 %
Rata – rata 1,074 ± 1,281 %
Formula (b)
W1 (gram) W2 (gram) ( W1 – W2) % moisture
content
0,4429 0,4333 0,0096 2,168 %
0,2324 0,2301 0,0023 0,989 %
0,2578 0,2491 0,0087 3,374 %
Formula (ab)
W1 (gram) W2 (gram) ( W1 – W2) % moisture
content
0,4531 0,4500 0,0031 0,684 %
0,4602 0,4489 0,0113 2,455 %
0,4820 0,4759 0,0061 1,261%
Rata – rata 1,468 ± 0,987 %
Anova: Single Factor
SUMMARY
Groups Count Sum Average Variance
Column 1 3 9,15 3,05 0,2404
Column 2 3 3,22 1,073333 1,229633
Column 3 3 6,51 2,17 1,4281
Column 4 3 4,4 1,466667 0,824133
ANOVA Source of
Variation SS df MS F P-value F crit
LAMPIRAN C
Jumlah Propranolol HCl yang Melintasi Membran sebagai Fungsi
Akar Waktu
Waktu
(menit)
Jumlah proranolol HCl yang melintasi membran ( g/ml)
(-1) (a) (b) (ab)
15 3.454438 1.39199 23.81634 2.367238
30 3.7592 2.463962 30.23539 3.472
LAMPIRAN D
Jumlah Propranolol HCl yang Melintasi Membran sebagai Fungsi
Waktu
Waktu
(menit)
Jumlah proranolol HCl yang melintasi membran ( g/ml)
(-1) (a) (b) (ab)
Lampiran E
Perhitungan Anava Untuk Model Pelepasan
Response 1 PELEPASAN
ANOVA for selected factorial model
Analysis of variance table [Partial sum of squares - Type III]
Sum of Mean F p-value Source Squares df Square Value Prob> F Model 35.63 3 11.88 173.61 < 0.0001 A-HPMC 33.49 1 33.49 489.60 < 0.0001 B-PEG 400 2.03 1 2.03 29.62 0.0006 AB 1.00 0.11 1.62 0.2389
Pure Error 0.55 8 0.068
Cor Total 36.17 11 1 The Model F-value of 173.61 implies the model is significant. There is only a 0.01% chance that a "Model F-Value" this large could occur due to noise.Values of "Prob > F" less than 0.0500 indicate model terms are significant. In this case A, B are significant model terms. Values greater than 0.1000 indicate the model terms are not significant. If there are many insignificant model terms (not counting those required to supporhierarchy), model reduction may improve your model. Std. Dev. 0.26 R-Squared 0.9849
Mean 6.42 Adj R-Squared 0.9792 C.V. % 4.07 Pred R-Squared 0.9660 PRESS 1.23 Adeq Precision 27.569
The "Pred R-Squared" of 0.9660 is in reasonable agreement with the "Adj
R Squared" of 0.9792
Final Equation in Terms of Coded Factors:
PELEPASAN =
+6.42
-1.67 * A
-0.41 * B
Lampiran F
Perhitungan Anava Untuk Model Penetrasi
Response 2 penetrasi
ANOVA for selected factorial model
Analysis of variance table [Partial sum of squares - Type III]
Sum of Mean Source Squares df Square
Model 2.243E-005 3 7.478E-006
A-HPMC 1.200E-005 1 1.200E-005
B-PEG 400 8.003E-006 1 8.003E-006
AB2.430E-006 1 2.430E-006 5.73
Pure Error 3.393E-006 8 4.242E-007
Cor Total 2.583E-005 11
The Model F-value of 17.63 implies the model is significant. There is only
a 0.07% chance that a "Model F-Value" this large could occur due to noise.
Values of "Prob > F" less than 0.0500 indicate model terms are significant. In this case A, B, AB are significant model terms. Values greater than 0.1000 indicate the model terms are not significant. If there are many insignificant model terms not counting those required to support, model reduction may improve your model.
Std. Dev. 6.513E-004 R-Squared
Mean9.867E-003 Adj R-Squared 0.8193
C.V. % 6.60 Pred R-Squared
PRESS7.635E-006 Adeq Precision 9.663
The "Pred R-Squared" of 0.7044 is in reasonable agreement with the "Adj R-Squared" of 0.8193.
Coefficient Standard 95% CI 95% CI
Factor Estimate df Error Low High VIF
Intercept 9.867E-003 1 1.880E-0049.433E-003 0.010 A-HPMC 1.000E-003 1 1.880E-0045.665E-004 1.434E-003 B-PEG 400 8.167E-004 1 1.880E-0043.831E-004 1.250E-003 AB4.500E-004 1 1.880E-004 1.645E-0058.835E-004 1.00
Final Equation in Terms of Coded Factors:
penetrasi = +9.867E-003
+1.000E-003 * A +8.167E-004 * B +4.500E-004 * A * B
Lampiran G
Kondisi Uji Optimal
Lower Upper Lower Upper
Name Goal Limit Limit Weight
A:HPMC maximize -1 1 1
B:PEG 400 is in range -1 1 1
pelepasan maximize 4.159 8.758 1
penetrasi maximize 0.0079 0.0123 1
Solutions
Number HPMC PEG 400 pelepasan penetrasi Desirability
1 0.28 0.86 5.57715 0.01095 0.515