THESIS – TI 142307
SHIFTING ORDERS AMONG SUPPLIERS
CONSIDERING RISK, PRICE AND
TRANSPORTATION COST
CINDY REVITASARI 2515206003
SUPERVISOR
Prof. Ir. NYOMAN PUJAWAN, M.Eng., Ph.D., CSCP
GRADUATE PROGRAM
OPERATIONS AND SUPPLY CHAIN ENGINEERING INDUSTRIAL ENGINEERING DEPARTMENT
FACULTY OF INDUSTRIAL TECHNOLOGY INSTITUT TEKNOLOGI SEPULUH NOPEMBER SURABAYA
i
STATEMENT OF AUTHENTICITY
I, the undersigned,
Name : Cindy Revitasari
NRP : 2515206003
Study Program : Master Program of Industrial Engineering
Declare that my thesis entitled:
“SHIFTING ORDERS AMONG SUPPLIERS CONSIDERING RISK, PRICE
AND TRANSPORTATION COST”
Is a complete independent work of mine, completed without using any illegal information, nor the work of others that I recognize as my own work.
All cited and references are listed in the bibliography.
If it turns out that this statement is not true, I am willing to accept the consequences in accordance with the regulations.
Surabaya, July 2017 Sincerely,
ii
iii
ACKNOWLEDGEMENT
Alhamdulillah, my greatest gratitude to Allah SWT because of his grace and blessing, author successfully complete this thesis with tittle “SHIFTING
ORDERS AMONG SUPPLIERS CONSIDERING RISK, PRICE AND TRANSPORTATION COST”
This thesis is done as one of requirement in completing Master’s Studies in Department of Industrial Engineering, Faculty of Industrial Technology, Sepuluh Nopember Institute of Technology. This report is completed with the help and support from various parties. In this occasion, the author wishes to thank you. 1. My beloved parents Lilik Endrawati (Mother) and Drs. Sentot Djamaluddin
(Father) that gives author their fully support, prayer, materials, blessing and their time so that author can finish her thesis on time. And also, my sister Rissa Elerina Meytasari and my brother Anton Hamidin, thank you for being my motivations and thank you for your prayer and support.
2. Prof. Ir. I Nyoman Pujawan, M.Eng., Ph.D., CSCP. as the author supervisor for his guidance, knowledge, advice, and patience so that author can finish this thesis on time.
3. Prof. Ir. Moses L. Singgih, M.Sc., M.Reg.Sc., Ph.D. and Niniet Indah Arvitrida, S.T., M.T., Ph.D. as my thesis examiners for carefully reviewing my thesis and for all your advice and suggestion to improve my thesis.
4. My bestfriends that always support me and keep communication with me. 5. All my friends from Master Degree of Industrial Engineering year 2015.
6. Lecturers from Industrial Engineering Department, thank you for the knowledge and advices.
7. Staffs from Industrial Engineering Department. 8. All parties that are impossible to mention one by one.
Author realizes that this research is still far from perfect, so author hope that this research can be developed into future research.
Surabaya, July 2017
iv
v
SHIFTING ORDERS AMONG SUPPLIERS
CONSIDERING RISK, PRICE AND
TRANSPORTATION COST
Name : Cindy Revitasari
NRP : 2515206003
Supervisor : Prof. Ir. Nyoman Pujawan, M.Eng., Ph.D., CSCP
ABSTRACT
Order allocation for supplier is an important decision for an enterprise to realize a sustainable production. It was related to the suppliers function as a raw material provider and other supporting materials that will be used in production process. Initially most of previous research only focus on system analysis of order allocation supplier without doing analysis of risk and overall supply chain cost. Problem encountered in this research is to determine shifting order among suppliers that considering risk and transportation cost for single commodity multi supplier. The supply chain risk management process is investigated and a procedure was proposed in the risk mitigation phase as a form of risk profile. In this research model is proposed an initial procurement plan by using linear programming and also is revised the first optimal solution by including the risk profile factor. The objective of analysis risk profile in order allocation is to maximize the product flow from a risky supplier to a relatively less risky supplier. This supply chain risk management procedure including this proposed procedure is applied to a sugar company. The model is able to demonstrate that the result are different than the initial model.The result suggested that order allocations should be maximized in suppliers that have a relatively less risk profile value and minimized on suppliers that have a relatively larger risk profile value based on the risk factor, capacity, purchasing cost, transportation cost for each supplier and also demand from each manufacturer.
vi
vii
TABLE OF CONTENTS
STATEMENT OF AUTHENTICITY ... i
ACKNOWLEDGEMENTS ... iii
ABSTRACT ... v
TABLE OF CONTENTS ... vii
LIST OF FIGURES ... ix
LIST OF TABLE ... xi
CHAPTER 1 INTRODUCTION ... 1
1.1 Research Background ... .1
1.2 Research Questions ... 5
1.3 Objectives ... 5
1.4 Benefit ... .5
1.5 Limitations ... 6
1.6 Assumptions ... 6
1.7 Research Outline ... 7
CHAPTER 2 LITERATURE REVIEW ... 9
2.1 Supply Chain Risk Management (SCRM) ... 9
2.2 Supply Chain Risk Management Processes ... 9
2.2.1 Risk Identification ... 11
2.2.2 Risk Measurement ... 11
2.2.3 Risk Evaluation ... 13
2.2.4 Risk Mitigation ... 13
2.3 Risk Management Strategy ... 14
2.4 Linear Programming ... 15
2.5 Supplier Selection and Order Allocation ... 16
2.6 Research Position and Gap ... 18
CHAPTER 3 RESEARCH METHODOLOGY ... 21
3.1 Identification of Supply Chain Network ... 21
3.2 Formulation the Minimum Cost of Procurement ... 22
viii
3.4 Product Quantity Transferred ... 23
3.5 Risk Evaluation ... 25
3.6 Verification ... 25
CHAPTER 4 DATA COLLECTION AND PROCESSING ... 27
4.1 Collecting Data ... 27
4.2 Risk Profile ... 29
4.3 Procurement Plan ... 31
4.4 Procurement Plan based on Risk Value ... 34
4.5 Model Verification ... 39
4.6 Sensitivity Analysis ... 40
4.6.1 Sensitivity Analysis for demand ... 40
4.6.2 Sensitivity Analysis for Risk Profile ... 42
4.6.3 Sensitivity Analysis for Price ... 47
CHAPTER 5 ANALYSIS AND DISCUSSION ... 49
5.1 Order Allocation to Suppliers Considering Risk and Transportation Cost ... 49
5.2 Solution Based on Different Objectives Functions ... 49
5.3 Risk Parameter used in the model ... 50
5.4 Shifting Order Supplier According Risk ... 50
5.5 Sensitivity Analysis Parameter ... 52
CHAPTER 6 CONCLUSIONS AND RECOMMENDATION ... 55
6.1 Conclusions ... 55
6.2 Recommendation ... 56
6.2.1 Recommendation for Future Research ... 56
6.2.2 Managerial Implications... 56
REFERENCES ... 59
APPENDIX ... 65
ix
LIST OF FIGURES
x
xi
LIST OF TABLES
Table 2.1 Risk Mitigation Strategies in Supply Chain ... 12
Table 2.2 Proactive and Reactive Strategy ... 14
Table 2.3 Research Position and Gap ... 19
Table 3.1 Normalized Risk Value... 24
Table 3.2 Parameters Used in the Model ... 24
Table 4.1 Capacity and Unit Purchasing Price of Each Supplier ... 27
Table 4.2 Demand of Each Manufacturer/Assembler... 28
Table 4.3 Transportation Costs from Suppliers to Manufacturers From Expedition Company ... 28
Table 4.4 Unit Transportation Costs From Suppliers to Manufacturers ... 29
Table 4.5 Risk Profile ... 30
Table 4.5 Risk Profile (Cont.) ... 31
Table 4.6 Risk Profile of Each Supplier... 31
Table 4.7 Optimal Solution Lingo ... 34
Table 4.8 Normalized Risk Value... 35
Table 4.9 Parameters Used in the Model ... 35
Table 4.10 Recapitulation The Difference Between The Normalized Risk Values Of Suppliers (Rij) ... 36
Table 4.11 Optimal Solution Lingo Considering Risk ... 37
Table 4.12 Optimal Solution of Order Allocation According Risk ... 38
Table 4.13 Modified Procurement Plan ... 39
Table 4.14 Demand for Scenario 1a ... 40
Table 4.15 Optimal Solution Lingo without Considering Risk Scenario 1a ... 40
Table 4.16 Demand for Scenario 2a ... 41
Table 4.17 Optimal Solution Lingo without Considering Risk Scenario 2a ... 41
Table 4.18 Risk Profile For Scenario 1b ... 42
Table 4.19 Optimal Solution Lingo without Considering Risk Scenario 1b ... 42
Table 4.19 Optimal Solution Lingo without Considering Risk Scenario 1b (Cont.) ... 43
xii
Table 4.21 Optimal Solution Lingo without Considering Risk Scenario 2b ... 43
Table 4.22 Risk Profile for Scenario 3b ... 44
Table 4.23 Optimal Solution Lingo without Considering Risk Scenario 3b ... 44
Table 4.24 Risk Profile for Scenario 4b ... 45
Table 4.25 Optimal Solution Lingo without Considering Risk Scenario 4b ... 45
Table 4.26 Risk Profile for Scenario 5b ... 46
Table 4.27 Optimal Solution Lingo without Considering Risk Scenario 5b ... 46
Table 4.28 Purchasing Price of Each Supplier Scenario 1c ... 47
Table 4.29 Optimal Solution Lingo without Considering Risk Scenario 1c ... 47
Table 4.30 Purchasing Price of Each Supplier 2c... 47
Table 4.31 Optimal Solution Lingo without Considering Risk Scenario 2c ... 48
Table 5.1 Modified Procurement Plan ... 51
Table 5.2 Recapitulation of Optimal To Solution Sensitivity Analysis For Demand Factor... 52
Table 5.3 Recapitulation of Optimal Solution to Sensitivity Analysis For Risk Profile Factor ... 53
Table 5.4 Recapitulation of Optimal Solution to Sensitivity Analysis For Price Factor ... 54
1
CHAPTER I
INTRODUCTION
This chapter will explain about research background, research questions, objectives and benefits of the research, limitations, and assumptions.
1.1 Research Background
In today’s competitive environment, improvement of the whole supply chain performance is an important thing for every company. Every company is attempting to meet demand, improving the quality and reducing costs to optimize the business processes (Chen & Wu 2013). In most industries, cost of raw materials and components formed as a major part of production cost until up to 70% (Sawik 2013). Raw material costs can increase up to 80% from total production cost. An efficient and effective supply chain also depends on the company in selecting the best supplier to manage the right materials at the right time, by managing the processes that significantly will reducing not only purchasing cost but also enhancing the competitiveness of the company (Pazhani et al., 2016). Therefore, selecting appropriate suppliers is a thing that needed a full attention because suppliers have a significant effect on reducing purchasing costs, increasing customer satisfaction, and strengthening the competitiveness of company (Sodenkamp et al. 2016). In addition, among the various components in the supply chain, sourcing and transportation are recognized as primary.
2
the supplier selection process is identified each supplier to ultimately choose the supplier with the highest potential to be able to work together and meet the demand. There are two kinds of supplier selection systems, the first is single sourcing system where 1 supplier is able to meet all the needs of the company so that the management only needs to make a decision to choose one of the best suppliers. While the second one is the multiple sourcing system, where no supplier is able to meet the needs of the company, so that in these conditions management must divide the order on each supplier with a variety of considerations of certain conditions. The problem is what will be resolved in this research.
Beside that, company have to concern to organize overall supply chain cost to control and minimize the procurement cost, transportation cost as a part of supply chain cost is also an important aspect to be considered (Pazhani et al. 2016). However, a lot of inventory management models in the literature assume that transportation costs are included in the purchase cost of the product (Zepeda et al. 2016). Transportation costs should be considered in determining the amount of the order and also the removal order to improve the efficiency of the overall supply chain (Yu et al. 2016).
3
selection and the corresponding order quantities are affected with changes in the supply chain cost parameters. Moreover, the proposed integrated approach is compared with the sequential approach, where the inventory planning and supplier selection problems are solved sequentially (Oguzhan & Erol 2016). The results from the analysis show that the integrated approach yields significant savings in terms of logistics and overall supply chain costs.
Some researchs only focused on creating an optimal order allocation for each suppliers to fulfill demands of each manufacturer as conducted in Sodenkamp et al. (2016), Nazari-shirkouhi et al. (2013), Pazhani et al. (2016), Guo & Li (2014) and (Jadidi et al., 2014). All of that researches have considered the various parameters of overall supply chain cost in determined order allocations for suppliers, but it does not conducted risk analysis to reduce error of results for order allocations for each suppliers. In research conducted by Oguzhan & Erol (2016), it is described risk factors which is very important to be included in formulation model to calculate the optimal order allocation for suppliers. Risk factors are used as parameters for formulation to produce an optimal order allocation that can maximize orders suppliers to supplier that have a relatively less risk factors value. Each supplier has different risks, therefore it is necessary to analyze risk for each supplier, then calculate the order allocation by entering the risk factor in formulation model (Sawik 2013).
4
Then the results will be processed by conducting risk assessment of all suppliers qualitatively. Risk assessment is obtained in the form of risk profile, where the risk profile will be used as a parameter to change the order allocations from the order allocations that have not considered risk factors. Risk profile is incorporated into linear programming formulation model as an effort to optimize the allocation of orders for each supplier considering the supplier’s capacity and demand of each manufacturer.
Risk identification used in this research is in the form of risk profile. Because by using a risk profile it would be easier to categorize and list the possible risks which is caused by suppliers that can influence pattern and number of allocation of orders for each supplier in fulffilling the demand of each manufacturer. Risk profile is also used as a parameter which the function is to reflect the risk status of each supplier which used as a parameter to modify the initial procurement plan. By using these parameters, the results of the order allocations will be maximized to suppliers that have a relatively less risk profile value and minimize the order allocations insuppliers that have a relatively larger risk profile value, but also have to stay attention of two factors, the order allocation which should not exceeds capacity of each supplier and must fulfill the demand of each manufacturer. If purchasing unit cost of supplier is cheaper but supplier has a higher risk profile value than the other, number of allocations orders that have been planned through minimization of costs should consideration risk profile value dan well purchasing power of manufacturers that have a relatively less risk profile value that also have to considering capacity of supplier. The Allocations from the suppliers that have a relatively lower risk are modeled as a network to facilitate the allocation of such order allocations.
5
benefit of this research is to refer the strategy for manufacturing with a single product from multiple suppliers procurement to make an optimal of order allocation by considering risk factor to reduce impact from supplier problem, to maximize flow of materials from supplier to manufacture, to optimize production process and increase the company profit.
1.2 Research Questions
With regards to the research gap explained in the previous section, this research focuses on these following aspects.
1. How to incorporate cost and price into the decisions of procurement quantity
allocation among available suppliers?
2. How are the changing parameter value like demand, risk profile and price affect
the order allocation?
1.3 Objectives
This research aims to develop a procedure of determining shifting orders process in the supplier selection. The proposed method tested through case studies which have the following specific objectives.
1. To develop a model of procurement plan that incorporates cost and price into the decision making of procurement plan.
2. To analyze the sensitivity of demand, risk profile and price toward order allocation.
1.4 Benefit
The benefits from the implementation of this research are. 1. Theoretical Contribution.
6 2. Practical implications.
a. The method of determining the proposed risk mitigation strategies in supplier selection can be generalized to other supply chain risk management, not limited to this study. Linier Programming is very promising to be applied in process of shifting orders among suppliers. b. The proposed risk mitigation strategy can be used as a risk management
policy recommendations for companies that have business processes and risk profile as a factor as shown in this study. Through mitigation strategies, companies can reduce the probability of occurrence of risk and reducing the impact if the risk actually occurs.
1.5 Limitations
Limitation used in this research are.
1. The supply chain network involves two steps, namely supplier and manufacturer.
2. We only consider the case of a single material in the numerical example, namely soda caustic.
1.6 Assumptions
The assumptions used in this research are.
1. Transportation costs from third party parties assumed are constant. 2. The number of suppliers is fixed.
3. In this research assumed that all soda caustic delivered by trucks with capacity 22 ton.
1.7 Research Outline
As an outline, the systematic writing of this study is as follow.
CHAPTER 1 INTRODUCTION
7
research objectives, research benefit, research limitation and assumptions, as well as the systematic writing for the final report.
CHAPTER 2 LITERATURE REVIEW
This Chapter describes about the general description of the theories that being used and literature relating to previous research as a references.
CHAPTER 3 RESEARCH METHODOLOGY
This chapter describes the research method, which contains systematic stages to answer the problem identification on research.
CHAPTER 4 DATA COLLECTION AND PROCESSING
This chapter describes the model used in solving issues that will be discussed, along by plans development models and mathematic formulation according to data from company.
CHAPTER 5 ANALYSIS AND DISCUSSION
This chapter describes the data collection and running of model.
CHAPTER 6 CONCLUSIONS
8
9
CHAPTER 2
LITERATURE REVIEW
This chapter contains some references and theories conducted from various journals, books and previous research. Where the theory and references is expected to be used as a reference in solving the problem that related with risk and allocation order to support this research.
2.1 Supply Chain Risk Management (SCRM)
Supply chain risk management (SCRM) is the implementation of strategies to manage both daily and exceptional risks along the supply chain based on continuous risk assessment with the objective of reducing vulnerability and ensuring continuity (Tang et al. 2012). According to Musa (2012). SCRM also define as an activity which integrated recognition of risk, risk assessment, developing strategies to manage it, and mitigation of risk using managerial resources. Some traditional risk managements are focused on risks stemming from physical or legal causes. Supply chain risk management aims to develop an approach to identify, assess, analyze, and address areas that are vulnerable in the supply chain. Hallikas & Lintukangas (2016) was present as the intersection between risk management and supply chain management
2.2 Supply Chain Risk Management Processes
10
as increase product variety. There are many risks inherent in this more open, dynamic system.
Enterprises may inadvertently overlook internal risks (Qi & Lee 2015). These may include those posed by a rogue employee, as well as those posed by inadequate policies, strategies, or 5 organizational structures. The external environment in which an enterprise, and its suppliers, must work will also pose differing risks. For example, some suppliers will face meteorological risks, while others, because of their distance, may have greater transportation risks. Mapping its supply chain can help an enterprise identify the risks it faces and how best to prioritize and address them (Heckmann et al. 2015). To prioritize and address risks, firms will need to identify criteria for determining what may pose a risk to its operations. One potential starting point is the supply chains for the products most affecting firm profitability (Ghadge et al. 2017).
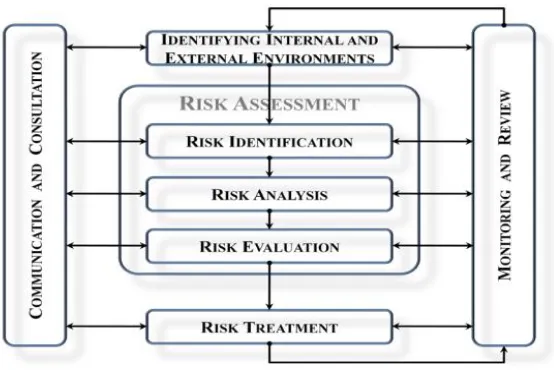
Once a firm understands how to identify risks, it may undertake risk identification and assessment, which includes risk identification, risk analysis, and risk evaluation (Tang et al. 2012). Risk identification may entail using a list of common risks including external risks such as natural disasters, accidents, sabotage, or labor uncertainty; supplier risks such as production problems, financial issues, or subcontractor problems; distribution risks such as cargo damage, warehouse inadequacies, or supply pipeline constrictions; and internal risks such as personnel availability or facility unavailability (Chen & Wu 2013). Such process will also involve prioritizing risks by the threat (as measured by likelihood and consequence) they can pose to a firm’s operations.
11
Figure 2.1 Supply Chain Risk Management Process Source : Chopra, S (2015)
2.2.1 Risk Identification
Risk identification of a particular system, facility or activity may yield a very large number of potential accidental events and it may not always be feasible to subject each one to detailed quantitative analysis. In practice, risk identification is a screening process where events with low or trivial risk are dropped from further consideration (Musa 2012).
Risk identification is the first and the most important stage of the risk management (Peng et al. 2014). For an efficient risk management, supply chain must be divided into elements such as suppliers, manufacturers, warehouses, and distribution channels (Schmitt & Singh 2012). And the risks associated with each element should be examined and identified specifically and elaborately. This is called supply chain mapping and risk registering. Firms should form an SCRM department in their organization structure.
2.2.2 Risk Measurement
12
value of probability (Zepeda et al. 2016) . In order to use probability functions, we must have historical data on that event first. The type of distribution function must be identified by fitting tests. Then, the parameters of the distribution function must be calculated and the probability of a risky event can be found (Heckmann et al. 2015). Data might be available for some risks such as currency rate and lead time but might be rare and insufficient for events as earthquake, terrorism etc. In this situation, the likelihood of an event can be used. Likelihood is related to the frequency of occurrence of an event. This method is more practical than and might be as accurate as the other method when experts evaluate the risky event meticulously (Peng et al. 2014).
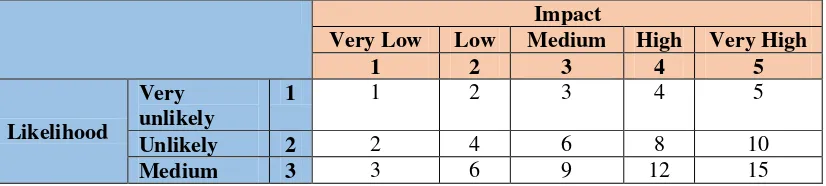
The second component of the risk measurement is the impact of a risky event. It is very difficult to estimate and compute the impact in advance because a disruption in any part of the supply chain usually affects other parts as well (Li et al. 2016). Risk impact is usually expressed in terms of cost but performance loss, physical loss, psychological loss, social loss, time loss etc. are also other types of impacts (Platon & Constantinescu 2014). Moreover, the impact of environmental events varies according to the firm’s size. For instance, small companies might be affected more than large-scale companies from an economic crisis or currency rate risk. As mentioned earlier, expected impact is the product of impact and probability of a risky event.Based on (Sherwin et al. 2016) showed that the probability impact matrix is a useful tool to visualize and define the expected impacts (Table 2.1) and is widely used in literature. A risky event which is unlikely but has a high impact has an index of 8 out of 25. Both the likelihood and impact index of a risky event increases as we move towards the lower right of the matrix.
Table 2.1 Risk Mitigation strategies in supply chain
13
Table 2.1 Risk Mitigation strategies in supply chain
Impact
Very Low Low Medium High Very High
1 2 3 4 5
Likelihood
Likely 4 4 8 12 16 20 Very Likely 5 5 10 15 20 25
Adapted : Fahimnia et al. (2015)
2.2.3 Risk Evaluation
Risk evaluation is the process of comparing the results of risk analysis with
risk criteria to determine whether the risk is acceptable or tolerable (Oguzhan & Erol 2016). Risk criteria are based on organizational objectives and can be derived from standards, laws, policies and other requirements (ISO Guide 73, 2009). It is impossible and unreasonable to refrain from all risks. At the end of the risk evaluation phase, a risk owner can select one of the four different strategies: avoid risk, reduce the probability and/or impact of risk, accept the occurrence of risk and prepare contingency plans (Chen & Wu 2013). Selection of the strategy mainly depends on the trade-off between the expected impact and the cost associated with the implementation of the selected strategy. García et al. (2013)
propose a quantitative decision support system (DDS) to select appropriate mitigation measures for supply chain risks. They do not propose a new mitigation measure but formulates a stochastic integer linear programming framework, which elaborates the supply chain managers’ judgments’ by way of utility functions and fuzzy-extended pairwise comparisons.
2.2.4 Risk Mitigation
Risk mitigation planning is the process of developing options and actions to enhance opportunities and reduce threats to project objective (Qi & Lee 2015). Risk mitigation implementation is the process of executing risk mitigation actions. Risk mitigation progress monitoring includes tracking identified risks, identifying new risks, and evaluating risk process effectiveness throughout the project.
14
General guidelines for applying risk mitigation handling options are based on the assessed combination of the probability of occurrence and severity of the consequence for an identified risk. These guidelines are appropriate for many, but not all, projects and programs. Risk mitigation handling options include Sherwin et al. (2016):
a. Assume/Accept, Acknowledge the existence of a particular risk, and make a deliberate decision to accept it without engaging in special efforts to control it. Approval of project or program leaders is required.
b. Avoid: Adjust program requirements or constraints to eliminate or reduce the risk. This adjustment could be accommodated by a change in funding, schedule, or technical requirements.
c. Control: Implement actions to minimize the impact or likelihood of the risk d. Transfer: Reassign organizational accountability, responsibility, and authority to
another stakeholder willing to accept the risk.
e. Watch/Monitor: Monitor the environment for changes that affect the nature and/or the impact of the risk.
2.3Risk Management Strategy
Supply chain risk management strategies can be classified as a strategy of proactive and reactive strategies. Risk mitigation measures referred to as reactive in dealing with the risks of the supply chain. Table 2.2 is show the example of differences between proactive and reactive strategy.
Table 2.2 Proactive and Reactive Strategy
Risk Management Strategy Proactive Risk Management Strategy Reactive
Developing supply chain, risk sharing through contracts, multi sourcing
Contingency planning, incident management risk, increase flexibility Supply chain contracts, developing
incentive contracts, contract flexibility mix and volume, VMI / buffer stock
Disaster Management, robust recovery, rebuild the supply chain, use a management of resources for scenario analysis at future disruptions
Product management process, postponement, product design, delivery management
Demand Management, operational rerouting, moving the consumer demand, dynamic pricing
15 2.4 Linear Programming
Linear programming theory and technique have been successfully applied to various supply chain problems almost since its early beginning (Shaw et al. 2012). There are study that use Linear programming to manage demand and inventory risk in a consumer electronics supply chain (Pazhani et al. 2016). Linear programming is an effective tools for analyzing and understanding supply chain risk problem.
Nazari-shirkouhi et al. (2013) dealed with actual problems on production and work force assignment in a housing material manufacturer and a subcontract firm. The research formulated two kinds of two-level programming problems: one is a profit maximization problem of both the housing material manufacturer and the subcontract firm, and the other is a profitability maximization problem of them. Applying the interactive fuzzy programming for two-level linear and linear fractional programming problems, he obtained the satisfactory solution to the problems. Brandenburg et al (2014) show that a mixed integer programming model is used to determine optimal supplier relationship, optimal supply work design, optimal supplier order allocation and optimal supply contract.
Yu et al. (2016) used a fuzzy approach to deal with the supplier selection problem in supply chain. The method is based on hierarchical multiple criteria decision making (MCDM) using fuzzy approach to select suitable supplier. In such type of decision making problems, all the decision makers are assumed to be equally important resulting in impractical aggregation of decision. Therefore, an analytic hierarchy process (AHP) like, the procedure based on Eigen value has been proposed to derive the weightages of decision makers. Then, the weightages of decision makers are incorporated with fuzzy decision making paradigm to arrive at robust selection of suppliers in SCM. The methodology has been demonstrated with the help of a case study in a steel plant.
16
technique for the selection of suppliers and proposed three phase multi criteria method that uses AHP and goal programming to the supplier selection problem.
2.5 Supplier Selection and Order Allocation
Supplier selection is one of the major problem of organizational competitiveness. The decisions on supplier selection are inherently complicated because of the necessity to consider simultaneously a variety of conflicting issues in a broad set of criteria from strategic to operational, and from quantitative to qualitative Hamdan & Cheaitou (2017). Order allocation is one of the most critical activities of purchasing management in a supply chain those are related with
multiple criteria decision making problem including cost, quality, delivery and service etc. Integrated supplier selection and order allocation is an important
decision for both designing and operating supply chains. This decision is often influenced by the concerned stakeholders, suppliers, plant operators and customers in different tiers.(Nazari-shirkouhi et al. 2013).Lee et al. (2015) provided optimum decision making for selecting and allocating order by applying the proposed method for integrated fuzzy TOPSIS and MCGP (Multi Choice Goal Programming) to make a final decision for supplier selection and order allocation that obtained by integrating the closeness coefficients model. Chen & Wu (2013) modified failure mode and effects analysis (FMEA) method to select new suppliers from the supply chain risk’s perspective and applies the analytic hierarchy process (AHP) method to determine the weight of each criterion and sub-criterion for supplier selection. The sub criterion can be used to determine unsatisfactory suppliers with valuable feedback that will help them improve and become its partners in the future.
17
problem where minimization of price, rejects and lead time. The aim is to achieve some levels of consistency among different objectives for the best supplier that will be chosen and defined the optimal allocation order for supplier. Guo & Li (2014) summarized the particular characteristics of the supply chain of Chinese petroleum enterprises, analyzed the limitations of the traditional methods of supplier selection, and brought forward the method based on case reasoning system for petroleum enterprises. The method based on data mining techniques which solves three key problems of CBR, includes calculating the weights of the attributes with information entropy in case warehouse organizing process objectively, evaluating the similarities with k-prototype clustering between the original and target cases in case retrieving process exactly, and extracting the potential rules with back propagation neural networks from conclusions in maintenance and revising process efficiently and the last determine optimum order allocation considering the weight of attributes.
18
on the relative importance ratings. Recently, García et al. (2013) proposed a fuzzy AHP approach for group decision making. To initialize and integrate the preferences of the group of decision makers, the author mixed fuzzy AHP with the geometric average method. The other example of combining supplier selection process and determine order allocation is in the research of Scott et al. (2015), that research proposed an integrated method for dealing with such problems using a combined Analytic Hierarchy Process Quality Function Deployment (AHP–QFD) and chance constrained optimization algorithm approach that selects appropriate suppliers and allocates orders optimally between them.
2.6Research Position and Gap
19 Table 2.3 Research Position and Gap
No. Author (Year)
Supplier Selection
Identification Sourcing Type Unit Analysis Method
Focus on Analysis supplier selection and supplier evaluation.
2. Nazari-shirkouhi
et al. (2013) √ √ √ √ √
Supplier selection and order allocation problem via an interactive decision making process.
3. Cheaitou (2017) Hamdan & √ √ √ √
20
Table 2.3 above shows the comparison of model previous research. In general, the proposed model resembles with previous model. Wherein, the model is used to determine order allocation suppliers according risk and transportation cost. However, unlike the models has been proposed by previous researchers, this research will observe an additional factor to the allocation order supplier problem. In this research the formulation of allocation orders suppliers is considering risk and transportation cost.
21
CHAPTER 3
RESEARCH METHODOLOGY
In this chapter will be explained about all of the steps to do in this research.
3.1 Identification of Supply Chain Network
Identify of an efficient risk management can be maintained by dividing supply chain into elements such as suppliers, manufacturers, warehouses, distribution channel, etc. Fig 3.1 shows an example of supply chain network that consist of five suppliers and three manufacturers. Data that required to enable model development for supply chain network below are:
a. Capacity and unit purchasing price of each supplier. b. Demand of each manufacturer/assembler.
c. Risk profile of each supplier.
d. Transportation cost from supplier to manufacturer/assemblers.
Figure 3.1 Supply Chain Network 1
2
3
4
1
2
3 Suppliers
22
3.2 Formulation the Minimum Cost of Procurement
In this procedure cost is considered to be the first priority goal. The problem can be solved by develop a model using a concept of a bipartite directed graph G(V1 ∪ V2 A), where V2 is suppliers and the vehicles line V2 is represent the
manufacturing/assembly plants. The arcs in 𝐴 = 𝑉1 x 𝑉2 represent product flows between the suppliers and the manufacturing/assembly plan. In this step, an initial procurement plan is created using linier programming.
This formulation is initial procurement plan without considering risk factor. The objective function of formulation (3.1) is to minimize cost which consist of purchasing cost and transportation cost. The constraints include consideration of capacity and demand.
𝑀𝑖𝑛𝑐𝑜𝑠𝑡 = ∑ 𝑃𝑖 𝑖𝑒𝑉1
∑ 𝑦𝑖𝑗 𝑗𝑒𝑉2
+ ∑ ∑ 𝑇𝑖𝑗 ∗ 𝑦𝑖𝑗 𝑗𝑒𝑉2
𝑖𝑒𝑉𝑖
∑ 𝑦𝑖𝑗 ≤ 𝐶𝑖 𝑖 ∈ 𝑉1 𝑗𝑒𝑉2
∑ 𝑦𝑖𝑗 ≤ 𝐷𝑗 𝑖 ∈ 𝑉2 𝑖𝑒𝑉1
𝑦𝑖𝑗 ≥ 𝑖 ∈ 𝑉1 , 𝑖 ∈ 𝑉2
Where :
i : suppliers
J : manufacturers/assemblers
Pi : unit purchasing price of supplier i
yij : quantity to be transported from supplier i to manufacturer j Tij : unit transportation cost from supplier i to manufacturer j
Ci : capacity of supplier i
Dj : demand of manufacturer j
23
3.3 Risk Analysis
This stage performs risk identification and risk analysis. Risk identification is identified by Head of the General Secretariat based on assessment points as applied by the company and also the existing research. Risk identification will generate risk profile value for each supplier. Risk profile value use as a parameter in modifying the order of each supplier to each manufacturer. From risk parameter that used, risk profile will be modified that depends on the order quantity from a supplier which is found by minimum cost criterion to the risk profile of that supplier and the amount is transferred to a more reliable suppliers.
3.4 Product Quantity Transferred
There is not an actual product movement in this transfer but it is a transfer in
plans. In other words, the revised procurement plan is put in action and products are ordered only after the analysis is done. Suppliers with relatively less cost and lower risk profiles are highly utilized considering capacity constraint. Since the model includes capacity constraints, the quantity to be transferred from suppliers with high risk profiles to suppliers with low profiles are limited to the capacity of the latter. After the transfer quantity is calculated, how much of it will be transferred to which supplier is determined via a linear programming model. In this directed network, there is an arc from supplier i to a relatively less risky supplier j. Decision variables (Xij) in the linear programming model are the product quantities transferred from supplier i to supplier j. The objective is to maximize the product flow from a risky supplier to a relatively less risky supplier. So the parameters of the decision variables in the objective function are the positive differences between the normalized risk values of suppliers.
24
suppliers). These normalized risk values represent the risk status of suppliers according to the least risky supplier. So, they can also be used to find the quantity to be transferred as a percentage of the initial procurement quantity (Table 3.2).
Table 3.1 Normalized Risk Value
Table 3.2 Parameters used in the model
Suppliers since the objective function is maximization, it is explain the condition of transfer from a risky supplier to a less risky supplier. There is one constraint for the lowest and the highest risky nodes (suppliers) each and two constraints for all other nodes.
𝑀𝑎𝑥𝑧 = ∑ 𝑁𝑖𝑗 𝑖𝑗
25 ∑ 𝑋𝑖𝑗 ≤ 𝑄𝑇𝑖∀ 𝑖 ≠ 𝑗
𝐽
𝑗
∑ 𝑋𝑘𝑖 − 𝐾
𝑘
∑ 𝑋𝑖𝑗 ≤ 𝐶𝑅𝑖 𝐽
𝑗
Where :
Nij : Positive difference between the normalized risk value of the node
(supplier) i and node j
J : indicates all suppliers less risky than supplier i Qn : quantity to be transferred less risky than supplier i
K : all suppliers more risky than supplier i Crj : remained capacity of supplier i
3.5 Risk Evaluation
The risk management process is a cycle and the risk monitoring and control phase enables this process to be dynamic. Since risk is related to the future, events should be observed and the data about events should be updated and assessed all the time. This phase includes both observations about previous assessments and observations about changing situations and environment. New risks may be identified and or new judgments about previously identified risks may be revised by means of this phase. Information systems should be utilized and a high coordination and information sharing system should be established for efficient monitoring and control. Real time observation and tracking is also very critical for efficient risk monitoring.
3.6 Verification
26
Formulation of this research will be declared verified if the output of formulation meet two criteria below:
1. The number of orders to be delivered by each supplier does not exceed the capacity of each supplier.
27
CHAPTER 4
DATA COLLECTION AND PROCESSING
At the stage of data collection and processing will be explained regarding data required in conduct of processing data, such as data of suppliers, determination of risk profile criteria for each supplier, and data required to perform processing order allocation on each supplier.
4.1Collecting Data
In this sub section describe data that used in this research will be described, the data included primary and secondary data. In this research, a case study conducted in PTPN X, especially in the general secretariat department for data of several sugar factory as member of PTPN X, such as PG.Lestari, PG. Djombang Baru and PG.Meritjan. The data used in this study includes data supplier soda caustic products are used as supporting data for order allocation decisions to supplier.
PTPN X has 4 suppliers for providing soda caustic as material that supports sugar production process. The first supplier is PT.Verona Multikimia Abadi that located at Wonokitri Indah Blok S-31, Surabaya. The second supplier is PT.Cipta Teknik Abadi that located at Jalan Dr.Ciptomangunkusumo No.16, Semarang. The third supplier is PT. Kharisma Putra Jaya that located at Jalan Pahlawan No.70, Surabaya at Jalan Pahlawan No.70, Surabaya. Fourth supplier is PT. Widya Cipta Teknik at Jalan Ketintang Baru Selatan I/30, Surabaya.
The information below is decision supporting data of order allocation for all suppliers that provide soda caustic for sugar production process, purchasing capacity and unit price of each supplier is in table 4.1, demand of each sugar factory is in table 4.2
Table 4.1 Capacity and Unit Purchasing Price of Each Supplier
Suppliers 1 2 3 4 Total Capacity (Ci) per kg 31800 30200 29450 28800 120250
Unit Price (Pi) per kg 8300 8100 8400 8650 33450
28
Table 4.2 Demand of each Manufacturer/Assembler
Manufacturers/assemblers 1 2 3 Total (kg) Demand (Di)-kg 38400 34600 29650 102650 Source : PTPN X
Transportation Costs from suppliers to manufacturers/assemblers (Tij)
Table 4.3 Transportation Costs from Suppliers to Manufacturers from Expedition Company
Manufacturers/assemblers (j)
1 2 3
Suppliers (i) 1 Rp 1.400.000 Rp 1.220.000 Rp 1.550.000 2 Rp 2.150.000 Rp 2.250.000 Rp 2.100.000 3 Rp 1.450.000 Rp 1.250.000 Rp 1.600.000 4 Rp 1.300.000 Rp 1.250.000 Rp 1.500.000
Source : PTPN X
From transportation costs in Table 4.3, it can be seen that unit transportation cost for each supplier to the manufacturers according to the pattern of distribution. Formulations for calculating unit transportation cost is as follows:
Unit transportation cost (Tij) = Transportation Cost
𝑇𝑟𝑢𝑐𝑘 𝐶𝑎𝑝𝑎𝑐𝑖𝑡𝑦 (𝑘𝑔)
In this research, it is assumed that all soda caustic delivered by trucks with capacity 22 ton = 22000 kg.
Example calculation for Unit Transporation Cost (Tij) from supplier 1 to
manufacturer 1
Unit transportation cost (T11) = Rp 1.400.000
22000 𝑘𝑔 = Rp 63,64/kg
Example calculation for Unit Transporation Cost (Tij) from supplier 2 to
manufacturer 2
Unit transportation cost (T22) = Rp 2.250.000
29
Table 4.4 Unit Transportation Costs from Suppliers to Manufacturers
Manufacturers/assemblers (j)
1 2 3
Suppliers (i) 1 63.64 55.45 70.45
2 97.73 102.27 95.45
3 65.91 56.82 72.73
4 59.09 56.82 68.18
4.2 Risk Profile.
There are some criteria in determining risk profile of each supplier that’s done through brainstorming with the company based on the approach of Dickson's Vendor Selection Criteria. Based on the results of literature review and brainstorming that we obtained a set of criteria by PTPN X to determine risk profile for each supplier, in this study:
1. Price
Price of material is the main criteria for assessing the risks that could be caused by inconsistencies in pricing and the price is too high that can cause financial loses for the company. Supplier with cheaper prices of material will be a priority in the selection process.
2. Quality
Quality of products delivered by the suppliers are the criteria that should be considered in assessing suppliers. Because the quality of delivered material will have an influence in sugar production process. Suppliers that has a good quality of materials, then it will be a priority in the supplier selection and order allocation because it can reduce the risk of delays in the production process.
3. Delivery
30 4. Service
Service provided by suppliers have a variety of risks that can be caused, such as low flexibility, level of difficulty to be contacted, low responsibility of after sales service, difficulty of compliance procedure. All that risk is very detrimental for sugar factory therefore all of risk factors must be controlled and received special attention.
5. Supplier ability
The ability of suppliers to know and understand give positive effect to the company. But if it can’t be fulfilled then it will be detrimental to the sugar factory as a result of the risks posed, such as the low professionalism of suppliers and suppliers can’t fulfill the demand.
6. Safety
Safety is an important factor for all business units including suppliers because errors and losses can occur because safety is less controlled, There are some risks that can be appear due to low protection of safety management and low protection of extreme weather condition.
The following information is a table of risk profiles for suppliers, which will be filled by a part of the general secretariat as the people that directly have a process with suppliers.
Table 4.5 Risk Profile
Risk Sub Risk 1 2 3 4 5 Total
Price Unstable of Product price High Delivery cost
Quality Product quality is below the standard Specification of product in not appropriate
Delivery
Delay in delivery process Low Distribution capability Transportation failure
Service
Low Flexibility
31 Table 4.5 Risk Profile (Cont.)
Risk Sub Risk 1 2 3 4 5 Total
Supplier ability
Low professionalism of supplier Supplier can’t fulfill the demand
Safety
Low protection of Safety management
Low protection of extreme weather condition
TOTAL
Adapted from Prasannavenkatesan & Goh (2016) and Nazari-shirkouhi et al. (2013)
Risk Assessment Profile for each suppliers was conducted by head of the Department of the General Secretariat and the data obtained as follows.
Table 4.6 Risk Profile of each Supplier.
Supplier 1 Supplier 2 Supplier 3 Supplier 4
Risk profiles (RTi) 58 24 44 32
According to the risk profile data at Table 4.6, Supplier 2 has the lowest risk profile value and Supplier 1 has the highest risk profile value. Lower risk profile value equals to lower risk, hence the order allocation should be assigned firstly to the supplier that has the lowest risk profile value.
4.3 Procurement Plan
32 Figure 4.1 Supply Chain Network
From scheme of supply chain network in Figure 4.1, it can be seen that all of the four suppliers has to supply all manufacturers. To make an optimal order allocation, we use the following model to minimize procurement cost:
𝑀𝑖𝑛𝑐𝑜𝑠𝑡 = ∑ 𝑃𝑖 𝑖𝑒𝑉1
∑ 𝑦𝑖𝑗 𝑗𝑒𝑉2
+ ∑ ∑ 𝑇𝑖𝑗 ∗ 𝑦𝑖𝑗
𝑗𝑒𝑉2 𝑖𝑒𝑉𝑖
∑ 𝑦𝑖𝑗 ≤ 𝐶𝑖 𝑖 ∈ 𝑉1 𝑗𝑒𝑉2
∑ 𝑦𝑖𝑗 ≤ 𝐷𝑗 𝑖 ∈ 𝑉2 𝑖𝑒𝑉1
𝑦𝑖𝑗 ≥ 𝑖 ∈ 𝑉1 , 𝑖 ∈ 𝑉2
PT. Altha Bakti Pekasa
Suppliers
Manufacturers/Assemblers
PT. Cipta Teknik Abadi
PT. Widya Cipta Teknik PT. Kharisma Putra
Jaya
PG. Lestari
PG. Jombang Baru
PG.Meritjan
33 Where :
i : suppliers
J : manufacturers/assemblers
Pi : unit purchasing price of supplier i
yij : quantity to be transported from supplier i to manufacturer j Tij : unit transportation cost from supplier i to manufacturer j
Ci : capacity of supplier i
Dj : demand of manufacturer j
The objective function of formulation (4.1) is to minimize cost which consist of purchasing cost and transportation cost. The constraints include consideration of capacity and demand.
Objective function : minimize procurement cost :
Mincost = (8300 + 63.64) y11 + (8300 + 55.45) y12 + (8300 + 70.45) y13 + (8100+
97.73) y21 + (8100 + 102.27) y22 + (8100 + 95.45) y23 + ( 8400 +
65.91y31 + (8400 + 56.82) y32 + (8400 + 72.73) y33 + ( 8650 + 59.09) y41
+( 8650 + 56.82) y42 + (8650 + 68.18) y43
Mincost = 8364y11 + 8355y12 + 8370y13 + 8198y21 + 8202y22 + 8195y23 + 8466y31
+ 8457y32 + 8473y33 + 8709y41 + 8707y42 + 8718y43
Subject To
y11 + y12 + y13≤ 31800
y21 + y22 + y23≤ 30200
y31 + y32+ y33≤ 29450
y41 + y42 + y43≤ 28800
y11 + y21 + y31 + y41 ≤ 38400
y12 + y22 + y32 + y42≤ 34600
34
Optimal Solution of processing the formulation using LINGO software, as follows.
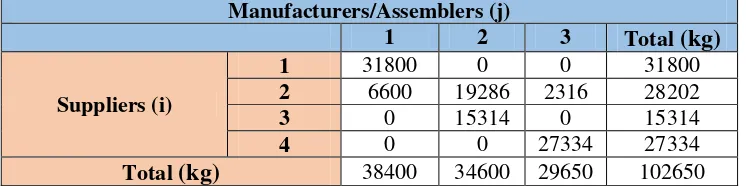
Table 4.7 Optimal Solution Lingo
Manufacturers/Assemblers (j)
1 2 3 Total (kg)
Suppliers (i)
1 0 31800 0 31800
2 550 0 29650 30200
3 26650 2800 0 29450
4 11200 0 0 11200
Total (kg) 38400 34600 29650 102650
Table 4.7 shows the optimal order allocation for each supplier to each manufacturer, In accordance with the objective function, constrains and data of PTPN X (PG.Lestari, PG. Djombang Baru and PG.Meritjan). So to fulfill the demand of each Sugar Factory Supplier 1 have to supply 31800 kg for manufacturer 2, Supplier 2 have to supply 550kg for Manufacturer 1 and 29650 kg for manufacturer 3, Supplier 3 have to supply 26650 kg for manufacturer 1 and 2800 kg for manufacturer 2 and Supplier 4 have to supply 11200 kg for manufacturer 1.
However, the order allocation in Table 4.7 is not optimal because it had not considered the risk factor. In this study, risk factor was included in the procurement plan to reduce risk in determining the order allocation between supplier and manufacturer. By using risk as factor to determine order allocation, it will produce an optimal order allocation. Optimal order allocation in this study was presented that order allocation started from a supplier that has a low risk factor to minimize the order on suppliers that have the higher risk factor. The risk factors in this study presented in the form of risk profile.
4.4 Procurement Plan based on Risk Value
35
base value and the differences between the risk profiles of suppliers remain the same. Finally, these values are normalized.
The product transfer network based on risk profiles of suppliers is presented in fig. 4.2 and parameters used in the model are presented in Table 4.10 and Table 4.11.
Table 4.8 Normalized Risk Value
Suppliers Total Risk Value Relative total risk
values Normalized values
Table 4.9 Parameters used in the Model
Suppliers
36
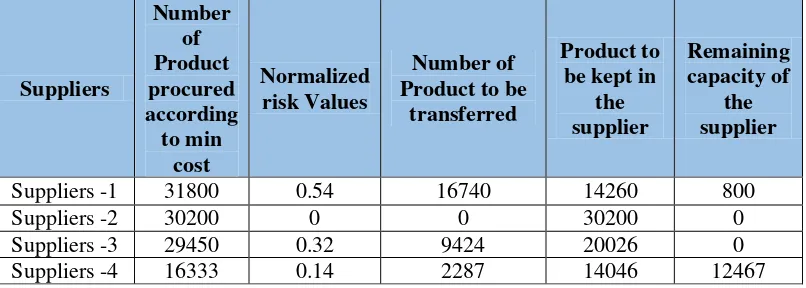
Figure 4.2 Illustration of shifting order between suppliers
Table 4.10 Recapitulation The Difference between the Normalized Risk Values of Suppliers (Rij)
R12 R32 R42 R14 R34 R13 0.54 0.32 0.14 0.40 0.18 0.22
Table 4.10 shows the recapitulation of normalized value of risk between suppliers. Normalized risk value will be used as a value in objective function for formulation (4.2) The objective function of formulation (4.2) does not represent any quantity but since the objective function is maximization, it determines condition of transfer from a risky supplier (supplier with relatively higher risk profile value) to a less risky supplier (supplier with relatively less risk profile value). The model to transfer the product from a risky supplier to a relatively less risky supplier is:
Number product to be transferred = 17172 Remaining Capacity = 0
Number product to be transferred =0 Remaining Capacity = 0
Number product to be transferred = 1568 Remaining Capacity = 17600
Number product to be transferred = 9424 Remaining Capacity =0
0.32
37 ∑ 𝑋𝑘𝑖 −
𝐾
𝑘
∑ 𝑋𝑖𝑗 ≤ 𝐶𝑅𝑖 𝐽
𝑗
Where :
Nij : Positive difference between the normalized risk value of the node
(supplier) i and node j
J : indicates all suppliers less risky than supplier i Qn : quantity to be transferred less risky than supplier i
K : all suppliers more risky than supplier i 𝐶𝑅𝑖 : remained capacity of supplier I
Xij : number of products to be transferred from supplier i to supplier j
Objective Function : maximize transfer product according to normalized risk value: Max Z = 0.54*X12+ 0.32X32+ 0.14*X42+ 0.40*X14+ 0.18*X34 + 0.22*X13
Subject To
X12 + X13 + X14≤ 17172
X12 + X32 + X42≤ 0
X13 – X32– X34 ≤ 0
X32 + X34 ≤ 9424
X14 + X34– X42 ≤ 17600
X42 ≤ 1568
Xij ≥ 0
The formulation is solved via LINGO and the optimal solution is presented in Table 4.13 below.
Table 4.11 Optimal Solution Lingo Considering Risk
R12 R32 R42 R14 R34 R13
0 0 0 17172 kg 9424 kg 0
38
R14 = 17172 kg, means that Supplier 1 have to minus 17172 kg of their supply and
supplier 4 have to add 14431kg of their supply. Supplier 1 = 31800– 17172 = 14628 kg
Supplier 4 = 11200 + 17172 = 28372 kg
R34= 9424 means that Supplier 3 have to minus 9424 kg of their supply and supplier
4 have to add 9424 kg of their supply. Supplier 3 = 29450 – 9424 = 20026 kg Supplier 4 = 28372 + 9424 = 37796 kg
Table 4.12 Optimal Solution of Order Allocation According Risk
Manufacturers/Assemblers (j)
1 2 3 Total (kg)
Suppliers (i)
1 0 14628 0 14628
2 550 0 29650 30200
3 17226 2800 0 20026
4 20564 17172 0 37796
Total (kg) 38400 34600 29650 102650
39 Table 4.13 Modified Procurement Plan
Current Procurement Plan Modified Procurement
Plan Decrease Increase optimal solution of data processing that not considering risk and optimal solution of data processing that including risk. Table 4.13 also shown order allocation changing in supplier 1,3, and 4. Supplier 1 should decrease 54% of total supply order, supplier 3 should decrease 32% of their supply order; while supplier 4 should increase 42% of supply order. This condition occurred because supplier 1 and supplier 3 has relatively higher risk profile value so both of supplier 1 and 3 have to decrease their order allocation and reallocate their order to the supplier that has relatively less risk profile value (supplier 4), therefore supplier 4 should increase their supply order. There was no changing order allocation for supplier 2 because the number of supply is already reach the maximum capacity.
4.5 Model Verification
In this research, verification process can be analyzed from the output of the computation. Referring to formula (4.1) and (4.2), the formulation of these problems will be verified against the two criteria below :
1. The number of orders to be delivered by each supplier does not exceed the capacity of suppliers.
2. The number of orders for each supplier have to fulfill the demand of each manufacturer.
3. For Order Allocation according risk profile, the order have to maximized at supplier that have relatively lower risk profile
40 4.6 Sensitivity Analysis
After performing the calculation and data processing using the proposed model, sensitivity analysis is conducted to determine the impact in system if some of the parameters changed.
4.6.1 Sensitivity Analysis for demand
Sensitivity analysis is done by changing the value of demand. Changes in the value of demand will have a different variation in in each scenario. In this scenario, the parameter that will be changed is only for demand, so the risk factors that is in this research risk profile using the same parameters as shown in Table 4.8.
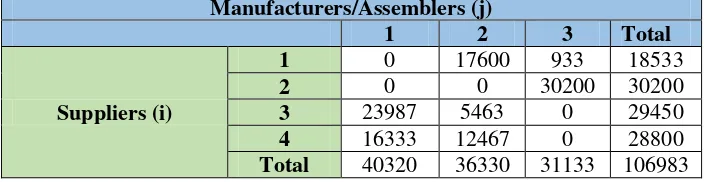
a. Scenario 1 : Increase 5% of each manufactures demand
Table 4.14 Demand for Scenario 1a
Manufacturers/assemblers 1 2 3 Total (kg) Demand (Di) - kg 40320 36330 31133 107783
By using the formula (4-1) and (4-2), the optimal solution is obtained as follows:
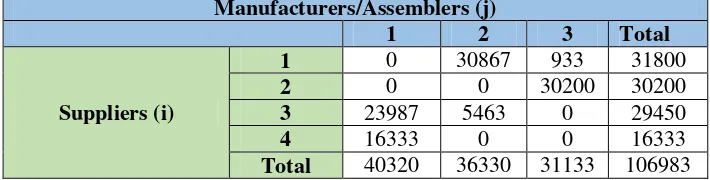
Table 4.15 Optimal Solution Lingo Considering Risk Scenario 1a
Manufacturers/Assemblers (j)
1 2 3 Total (kg)
Suppliers (i)
1 0 17600 933 18533
2 0 0 30200 30200
3 23987 5463 0 29450
4 16333 12467 0 28800
Total (kg) 40320 36330 31333 107783
41
orders greater than previous supply for manufacturer 2. Supplier 2 that previously served to supply demand for manufacturer 1 and 3, now supplier 2 have to supply manufacturer 3 with the number of supply orders lower than previous supply for manufacturer 3. Supplier 3 in previous optimal solution and new optimal solution have the same pattern to supply order, those are supply order for manufacturer 1 and 2 with the number of supply order is greater for both manufacturers. And the last, for supplier 4 also have the same pattern for order allocation, those are supply order for manufacturer 1 and 2 with the number of supply fewer than previous order.
b. Scenario 2 : Give variation with increase and decrease 10% of each manufacturer demand
Table 4.16 Demand for Scenario 2a
Manufacturers/assemblers 1 2 3 Total (kg)
Demand (Di) -kg 42240 38060 32615 112915
By using the formula (4.1) and (4.2), the optimal solution is obtained as follows:
Table 4.17 Optimal Solution Lingo Considering Risk Scenario 2a
Manufacturers/Assemblers (j)
1 2 3 Total (kg)
Suppliers (i)
1 0 29385 2415 31800
2 0 0 22865 22865
3 20775 1340 0 22115
4 21465 14670 0 36135
Total (kg) 42240 38060 32615 112915
42
orders greater than previous supply for manufacturer 2. Supplier 2 that previously served to supply demand for manufacturer 1 and 3, now supplier 2 have to supply manufacturer 3 with the number of supply orders lower than previous supply for manufacturer 3. Supplier 3 in previous optimal solution and new optimal solution have the same pattern to supply order, those are supply order for manufacturer 1 and 2 with the number of supply order is greater for both manufacturers. And the last, for supplier 4 also have the same pattern for order allocation, those are supply order for manufacturer 1 and 2 with the number of supply fewer than previous order. So, it can be concluded that by increasing 5% and 10% of demand have the same effect to the number of order allocation and pattern of shifting order among suppliers.
4.6.2 Sensitivity Analysis for Risk Profile
In this study, the emphasis is the determination of the order allocation to the supplier by considering risks factor Therefore sensitivity analysis is also associated with risk aspects, the form of risk aspect is risk profile. Sensitivity analysis according to risk profile is needed to know the changing pattern of order allocation. In this sensitivity for a number of Product procured According to the minimum cost is fixed use the calculation done using the lingo in Table 4.9.
a. Scenario 1 : Changing the risk of each supplier, suppliers who previously has the smallest risk change into greatest value of risk profile, also have same rule with opposite
Table 4.18 Risk Profile for Scenario 1b
Supplier 1 Supplier 2 Supplier 3 Supplier 4 Risk profiles (RTi) 54 46 20 30
43
Table 4.19 Optimal Solution Lingo Considering Risk Scenario 1b
Manufacturers/Assemblers (j)
1 2 3 Total (kg)
Suppliers (i)
1 0 17118 0 17118
2 550 0 29650 30200
3 26650 2800 0 29450
4 11200 17482 0 25882
Total (kg) 38400 34600 29650 102650
From Table 4.19 can be determined that changes in the value of risk profile give affect to the changing of order allocation for each supplier. That condition occurs because the order allocation is maximized for supplier that had relatively less risk profile value and minimized the order allocations for suppliers with relatively high risk value. Results from Table 4.19 can be determined that the lowest number of order allocation was for supplier 1 because supplier 1 have highest number of risk profile value. All of the supply order in Table 4.19 have the same pattern of order allocation compare with optimal order allocation in Table 4.12, but have different number of order allocation depend on the value of risk profile.
b. Scenario 2 : Changing the risk of each supplier, Supplier 4 that previously have the second greater number of risk profile now supplier 4 have the second fewer number of risk profile.
Table 4.20 Risk Profile for scenario 2b
Supplier 1 Supplier 2 Supplier 3 Supplier 4
Risk profiles (RTi) 39 48 35 26
By using the formula (4-2), the optimal solution is obtained as follows:
Table 4.21 Optimal Solution Lingo Considering Risk Scenario 2b
Manufacturers/Assemblers (j)
1 2 3 Total (kg)
Suppliers (i) 1 0 31800 0 31800
44
Table 4.21 Optimal Solution Lingo considering risk scenario 2b (Cont.)
Manufacturers/Assemblers (j)
1 2 3 Total (kg)
Suppliers (i) 3 26410 2800 0 29210
4 11200 0 15330 26630
Total (kg) 38400 34600 29650 102650
From Table 4.21 can be determined that changes in the value of risk profile give affect to the changing of order allocation for each supplier. The condition occurs because the order allocation is maximized for supplier that had relatively less risk profile and minimized the allocation of orders for suppliers with the relatively high risk value. From Table 4.21 can be seen that supplier 1 have to supply 31800 kg for manufacturer 2, supplier 2 have to supply order 790 kg to manufacturer 1 and 14320 kg to manufacturer 3. In addition the supplier 3 have to supply 26410 kg to manufacturer 1 and 2800 kg for manufacturer 2 and also for supplier 4 have to supply 11200 kg to manufacturer 1 and 15330 kg for manufacturer 3. It is known that supplier order allocation is maximized at supplier 1,3 and 4 because those supplier had a relatively less number of risk profile. And the smallest number of order allocation is for supplier 2 because supplier 2 had the greatest number of risk profile.
c. Scenario 3 : Changing the risk of each supplier, Supplier 2 has the largest risk profile value and supplier 1 has the lowest risk profile value
Table 4.22 Risk Profile for scenario 3b
Supplier 1 Supplier 2 Supplier 3 Supplier 4
Risk profiles (RTi) 22 56 42 34