THE EXPERT’S VOICE
®IN SQL SERVER
Pro
SQL Server 2008
Analytics
Delivering Sales and Marketing Dashboards
Brian Paulen
and
Jeff Finken
Foreword by Bryan Nielson
Director, Worldwide Product Marketing
Microsoft Dynamics CRM and CRM Analytics
Microsoft Corporation
Pro SQL Server 2008
Analytics
Delivering Sales and
Marketing Dashboards
■ ■ ■
Pro SQL Server 2008 Analytics: Delivering Sales and Marketing Dashboards
Copyright © 2009 by Brian Paulen and Jeff Finken
All rights reserved. No part of this work may be reproduced or transmitted in any form or by any means, electronic or mechanical, including photocopying, recording, or by any information storage or retrieval system, without the prior written permission of the copyright owner and the publisher.
ISBN-13 (pbk): 978-1-4302-1928-6
ISBN-13 (electronic): 978-1-4302-1929-3
Printed and bound in the United States of America 9 8 7 6 5 4 3 2 1
Trademarked names may appear in this book. Rather than use a trademark symbol with every occurrence of a trademarked name, we use the names only in an editorial fashion and to the benefit of the trademark owner, with no intention of infringement of the trademark.
Lead Editors: Mark Beckner, Jonathan Gennick Technical Reviewer: Vidya Vrat Agarwal
Editorial Board: Clay Andres, Steve Anglin, Mark Beckner, Ewan Buckingham, Tony Campbell,
Gary Cornell, Jonathan Gennick, Michelle Lowman, Matthew Moodie, Jeffrey Pepper, Frank Pohlmann, Ben Renow-Clarke, Dominic Shakeshaft, Matt Wade, Tom Welsh
Project Manager: Sofia Marchant
Distributed to the book trade worldwide by Springer-Verlag New York, Inc., 233 Spring Street, 6th Floor, New York, NY 10013. Phone 1-800-SPRINGER, fax 201-348-4505, e-mail [email protected], or visit http://www.springeronline.com.
For information on translations, please contact Apress directly at 2855 Telegraph Avenue, Suite 600, Berkeley, CA 94705. Phone 510-549-5930, fax 510-549-5939, e-mail [email protected], or visit http:// www.apress.com.
Apress and friends of ED books may be purchased in bulk for academic, corporate, or promotional use. eBook versions and licenses are also available for most titles. For more information, reference our Special Bulk Sales–eBook Licensing web page at http://www.apress.com/info/bulksales.
The information in this book is distributed on an “as is” basis, without warranty. Although every precaution has been taken in the preparation of this work, neither the author(s) nor Apress shall have any liability to any person or entity with respect to any loss or damage caused or alleged to be caused directly or indirectly by the information contained in this work.
iii
Contents at a Glance
Foreword
. . . ixAbout the Authors
. . . xiAbout the Technical Reviewer
. . . xiiiAcknowledgments
. . . xv■
CHAPTER 1
An Overview of Analytics
. . . 1■
CHAPTER 2
Seven Keys to Successful Reporting Projects
. . . 23■
CHAPTER 3
Key Performance Indicators
. . . 37■
CHAPTER 4
Microsoft Platform Components for Dashboards
. . . 53■
CHAPTER 5
Core Components of SQL Server 2008
. . . 99■
CHAPTER 6
SQL Server Analysis Services
. . . 143■
CHAPTER 7
Performance Management
. . . 171■
CHAPTER 8
Implementation and Maintenance of the Integrated System
. . . 195■
CHAPTER 9
Case Studies
. . . 223v
Key 2: Identifying Organizational Key Performance Indicators
. . . 24Key 3: Delivering Structured, Ad Hoc Reports
. . . 25Selecting Appropriate Technologies
. . . 25Reviewing the Appropriate Microsoft BI Tools for Various
User Roles
. . . 27Key 7: Delivering Organization-wide Performance Management
. . . 34■C O N T E N T S vii
viii ■C O N T E N T S
Performing Overall Project Management Tasks
. . . 217Categorizing Project Management Tasks
. . . 217Using SharePoint As a Project Management Tool
. . . 220Summary
. . . 221■
CHAPTER 9
Case Studies
. . . 223Case Study 1: Reporting in a Hosted Business Application
Environment
. . . 223Identifying the Customer’s Challenges
. . . 223Exploring the Solution
. . . 224Seeing the Results
. . . 234Case Study 2: Implementing Embedded Analytics
. . . 235Identifying the Customer’s Challenges
. . . 236Exploring the Solution
. . . 236Seeing the Results
. . . 243Case Study 3: Adding Web Analytics
. . . 244Identifying the Customer’s Challenges
. . . 245Exploring the Solution
. . . 246Seeing the Results
. . . 247Summary
. . . 249ix
Foreword
M
ost of you have long since started a promising analytics journey and have experienced the deceptively rocky road firsthand, with only fleeting glimpses of the promise of fully realized analytics. These challenges vary by organization, and issues can be data-driven, process-driven, technology-driven, or often people-driven.The result is that one or more of these obstacles, left unchecked, can lead to poor decision making and operational misalignment with business strategy, which can be catastrophic for a business, especially in the current economic climate where there is very little room for error.
Using applications, like Microsoft Dynamics CRM, that are designed to work the way your people work, through familiar Microsoft Office and Outlook user interfaces, is one of the key ways in which you can ensure that end users rapidly adopt your solution to capture necessary customer data and context.
Oftentimes, organizations build analytics and dashboards solely for executives to monitor and track historical activities. Keeping with the theme that analytics is a journey, this is similar to driving a Maserati in first gear on a straight road—while fun to do, it doesn’t take advantage of the car’s full potential or the reality of curved and winding roads. As a result, these organiza-tions can be left far behind. Analytics and dashboards are not only the province of the executive suite but have tremendous value to managers and individual sales and marketing professionals. Implemented correctly, these can help users make better decisions and find root causes, empower front-line marketing and sales users, improve operational efficiency, and drive action. The right analytics delivered to the right users at the right time ensures organizational alignment for executives, accountability for managers, and agility for end users. Business insight requires an approach that is as sophisticated as the results you are trying to achieve.
Analytics is a journey on which your organization cannot afford to be left behind. Effective and fully realized analytics will help you measure the past, understand the present, and even project the future. Unlike using a Magic 8 Ball, marketing and sales analysis and forecasting is a legitimate way for organizations to see a potential future based on today’s reality and to help you make better decisions now to avoid upcoming disasters or improve capacity plans for impending success.
To help in this journey, Microsoft Business Intelligence provides flexible and powerful low-cost analytical tools that can help organizations of all sizes with a wide variety of analytical needs. Because this journey is different from organization to organization, relevant guidance on how to take the key concepts and tasks associated with successful analytics projects and implement them efficiently is required.
x ■F O R E W O R D
In the end, being able to appropriately set the stage for your analytics engagement by correctly defining requirements, selecting the appropriate Microsoft technologies, and working through a proven implementation methodology will position you on the road to success. Brian Paulen and Jeff Finken have written this book with you, the reader, in mind.
For analysts and executives, this book will provide the planning, requirement-gathering, and project management tools necessary to ensure your implementation goes smoothly.
Developers, this book will enable you to further understand the tools available from Microsoft and how they can most successfully be implemented in your organization by beginning with basic steps and progressing to more advanced concepts.
Finally, for those using Microsoft Dynamics CRM 4.0 and Microsoft Office SharePoint, additional exercises are provided to further enhance your usage of these applications.
This book is full of sensible concepts and direction for a successful analytics deployment based on the authors’ real-world analytics and CRM projects and experiences. I’m confident that this book can help your organization run a little smoother, and I hope you find this guide as informative and useful as I have.
I wish you every success with your marketing and sales analytics journey.
Bryan Nielson
xi
About the Authors
■BRIAN PAULEN cofounded Madrona Solutions Group in July 2005. He has overall responsibility for the firm’s growing business and for managing client and partner relationships. Additionally, Brian works to ensure that Madrona can offer an exciting and challenging “work” environment for its employees.
Prior to founding Madrona Solutions, Brian was the director of the CRM practice at a large consulting firm in the northwest, where he had responsibility for sales and client delivery of CRM solutions. Earlier, Brian was a member of the CRM team at Equarius (now EMC), working primarily with clients in the pacific northwest. His career began at Accenture (formerly Andersen Consulting), working out of their New York office.
Throughout his career, Brian has developed extensive project and program management experience and is an expert in delivering strategic sales and marketing solutions for organiza-tions large and small.
■JEFF FINKENcofounded Madrona Solutions Group in July 2005 and brings years of experience to Madrona’s Business Intelligence practice. He brings a particular focus on working with sales, marketing, and IT leaders to define key performance indicators that drive improved organizational performance.
xiii
About the Technical Reviewer
■VIDYA VRAT AGARWAL is a Microsoft .NET purist and an MCT, MCPD, MCTS, MCSD.NET, MCAD.NET, and MCSD. He is also a lifetime member of the Computer Society of India (CSI). He started working on Microsoft .NET with its beta release. He has been involved in software develop-ment, evangelism, consultation, corporate training, and T3 programs on Microsoft .NET for various employers and corporate clients. He has been the technical reviewer of many books published by Apress and an author for the Apress titles Beginning C# 2008 Databases: From Novice to Professional,Beginning VB 2008 Databases: From Novice to Professional, and Pro ASP.NET 3.5 in VB 2008: Includes Silverlight 2Pro. His articles can be read at www.ProgrammersHeaven.com and his reviews of .NET preparation kits at www.UCertify.com.
xv
Acknowledgments
W
e would like to begin by thanking the team at Madrona Solutions Group for their assistance and patience as we worked through this process for the first time. Specifically, we would not have been able to complete the work without technical guidance and extensive editing support from Katie Plovie, Tri Pham, Phong Nguyen, and Megan Conyers. We truly appreciate the long hours you have committed to make the book what it is. We can’t imagine how this could have come together without your dedication, insight, and knowledge of SQL Server. We’d also like to thank Julie Paulen for taking the time to review the book and helping us improve the overall structure and flow. Finally, we would like to thank the team at Apress for giving us this opportunity. Particularly, we are grateful for the work that Mark Beckner did getting us engaged in the process. You have all been great people to work with.Brian Paulen and Jeff Finken
I would like to thank my wife, Phoebe, for giving me the time and freedom to work on this project. It took more time than I’d ever imagined. I want to also thank my daughter, Zoe, who continues to grow and motivate me every day. Finally, I would like to thank Jeff for owning the tough parts of this book. As always, it was a pleasure working with you on this project.
Brian Paulen
1
■ ■ ■
C H A P T E R 1
An Overview of Analytics
M
ost organizations’ existing business applications deliver the capacity to store a wealth of valuable data. The challenge is that this data loses its value when it is not readily available to information workers and business executives in the right format on demand. Far too often, sales managers don’t have visibility into their pipeline, and they can’t make clear decisions about discounting, hiring, and resource allocation. Equally challenging are the situations when finance professionals can’t effectively break down revenue and costs by product line and geog-raphy. Yet, with client after client, we encounter situations where significant time and effort have been spent designing and deploying business applications without putting any investment into the reporting. The result is that executives have little visibility into how their business is performing, and information workers and IT professionals spend exorbitant amounts of time manually pulling reports that become outdated almost as soon as they are delivered.Understanding Analytics
A practical definition of “analytics” would be to think of them as the ways an organization arrives at its decisions. Long-time organization employees may base decisions on historical experience or gut feelings, while those more focused on data analytics or financials will focus on the reports or information generated by frequently used applications.
2 C H A P T E R 1 ■ A N O V E R V I E W O F A N A L Y T I C S
Projects involving analytics frequently include data from a wide range of sources. In addition to the standard sources like customer relationship management (CRM) or enterprise resource planning (ERP) applications, initiatives support the inclusion of data from an organization’s web site, disparate spreadsheets, and single-purpose applications like dispatching tools or e-mail marketing technologies.
While some of an organization’s data exists in these formats, much of it exists in an unstructured format. Merrill Lynch estimates that more than 85 percent of all business infor-mation exists as unstructured data, commonly appearing in e-mails, notes, web pages, instant message discussions, letters, general documents, and marketing information. With the growth of the Internet, considering unstructured data is important. However, this book will focus primarily on structured data and on providing the most valuable information to end users.
The Value of Analytics
Imagine running a business without the benefits of monthly financial information:
Put yourself in sales representatives’ shoes: what if they don’t have access to customer satisfaction information before they head into a sales call?
Picture running the same marketing campaign over and over again, without being able to completely understand the results, conversion rate, and overall return on investment.
These scenarios are examples of struggles that many organizations have when they’re not able to synthesize data and present it in a manageable fashion.
Analytics are valuable because they can help individuals within an organization make well-informed decisions. Whether evaluating employee performance, judging the historical and predicted success of the business, or identifying the next investment opportunity, without intelligent information people are simply guessing at the correct answer.
Why Analytics Implementations Fail
One significant source of concern is the ultimate failure of business intelligence initiatives once the data has been gathered and presented. While this and other concerns seem obvious, many implementations fail because of the following reasons:
• Differing priorities: End users, managers, and executives within an organization frequently have varying priorities when it comes to managing data. Finding a solution that addresses all user needs is critical. This can be accomplished by identifying a solution that delivers the right level of analytics for each role within an organization, specifically:
C H A P T E R 1 ■ A N O V E R V I E W O F A N A L Y T I C S 3
• Managers need information that helps them evaluate the performance of their specific business and/or employees. This information must be a summary but contain enough detail for managers to provide feedback or change course as needed.
• Executives want data at a very high level. Information is often presented in a data-dense format and at a high, rolled-up level.
• Data explosion: Organizations are capturing increasing amounts of data across a broad array of locations. Many companies now have customer and prospect data spread between business applications located on premises, in the cloud, and on local hard drives in Excel and Access files. One of the great challenges facing analytics initiatives is the need to standardize applications that serve as the system of record for key customer interactions. At the same time, those organizations must architect analytics solutions that are adept at pulling data from local servers and cloud-based web applications while applying effective approaches to scrub and standardize this data to ensure that it performs well in business metrics.
Failure to appreciate the need to define the system of record for key business data and to architect for a heterogeneous data environment will lead to a failed analytics implemen-tation: users won’t waste their time with scorecards and dashboards that report on only a subset of key business data. As more and more data is introduced into an analytics solution, the complexity of developing the solution and making the results consistent rises. Identifying quick wins and a manageable set of data for each phase will greatly improve the likelihood of project success.
• Trust: Employee trust in the data available to them and willingness to work with the results are crucial to the ultimate success or failure of an analytics solution. While the direct problem of having to work through reporting issues during a meeting is signifi-cant, the permeation of the subsequent distrust throughout the organization should be given equal weight when addressing issues.
• Application adoption: Many times, BI initiatives fail because the underlying systems have either poor-quality or incomplete data, which leads to limited usefulness from the analytics tools. Failures of this kind demonstrate the need for BI projects to be concerned with having a focus on delivering tools that help drive adoption of key underlying busi-ness systems.
4 C H A P T E R 1 ■ A N O V E R V I E W O F A N A L Y T I C S
Environment Preparations
To successfully navigate the exercises and code presented in future chapters, you need to familiarize yourself with SQL Server 2008. You may already have a SQL Server 2008 environment to use throughout this book; if you don’t, Microsoft also publishes a trial version of SQL Server 2008 Enterprise Edition for use. Please navigate to www.microsoft.com/sqlserver/2008/en/us/ trial-software.aspx to download the software and install it in your environment. Additionally, for many of the scenarios presented in this book, having a platform or an application on which to build reports and dashboards is important. Based on our experiences, we have chosen Dynamics CRM and SharePoint as the tools used in these application-specific exercises. If you’re using these tools, you will be able to implement the exercises in your environment. If you’re using a different CRM or SharePoint-like application, the same concept can be implemented using your application.
As anyone familiar with analytics knows, good data often makes or breaks reports, so as we move through the exercises in the rest of this chapter, we will focus on setting up the SQL Server environment and associated data to allow for the best exercises and examples in future chapters.
Finally, from time to time, Microsoft releases a 180-day trial Dynamics CRM Virtual PC environment for evaluation by prospects and partners. If you would like to use this application, please navigate to www.microsoft.com/downoads/en/default.aspx and search for Dynamic CRM v4.0 to see if the VPC is currently available.
Exercise 1-1. Restoring the Database
Exercise 1-1 walks you through the steps associated with restoring a database in your SQL Server environment. This data will be used in subsequent chapters to build reports and provide a structure for upcoming exercises.
1. Restore the CRMDB.bak file located on this book’s page of the Apress web site. Navigate to Start ➤
All Programs ➤ SQL Server 2008 ➤ SQL Server Management Studio.
2. Create a new database by right-clicking the databases folder and clicking New Database. Type Contoso_MSCRM in the “Database name” field, as shown in Figure 1-1.
C H A P T E R 1 ■ A N O V E R V I E W O F A N A L Y T I C S 5
Figure 1-1. Type the database name.
6 C H A P T E R 1 ■ A N O V E R V I E W O F A N A L Y T I C S
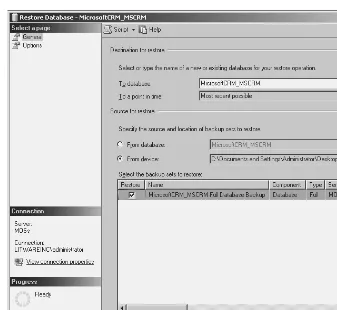
4. Select “From device”, and navigate to the location of the .bak file (see Figure 1-3).
Figure 1-3. Backup file location
5. Navigate to Options. Make sure “Overwrite existing database” is checked. Click OK to begin the restore process. Once the database has restored successfully, close SQL Server Management Studio.
6. The restored database has built-in security that does not allow individuals to query the filtered views without meeting specific security requirements. To ensure that you are able to see data in the views, edit the SystemUserBase table and change the DomainName for AntonK to your own DomainName. For example, if your domain is Adventureworks and your domain name is jsmith, you will input Adventureworks\JSmith for the DomainName column of the SystemUserBase table on the row associated with AntonK.
C H A P T E R 1 ■ A N O V E R V I E W O F A N A L Y T I C S 7
Exercise 1-2. Installing the Data Mining Add-In in Excel
This exercise will walk through installation and use of the Data Mining Add-In in Excel. To use the Data Mining Add-In outside of the demonstration environment, Microsoft Office 2007 and Microsoft .NET Framework 2.0 must be installed.
1. Open Internet Explorer in your environment. Type the URL http://www.microsoft.com/DOWNLOADS/ details.aspx?familyid=896A493A-2502-4795- 94AE-E00632BA6DE7&displaylang=en. Download the item displayed in Figure 1-4.
Figure 1-4. The Data Mining Add-In download
2. Run the Windows Installer Package you just downloaded. Accept the license agreement, and fill out any remaining questions appropriately. In the Feature Selection page, click the drop-down next to each item displayed in Figure 1-5, and select “This feature, and all subfeatures, will be installed on local hard drive.”
8 C H A P T E R 1 ■ A N O V E R V I E W O F A N A L Y T I C S
3. Configure SQL Server 2008 for the Office 2007 Data Mining Add-ins by navigating to Start ➤ All Programs ➤ Microsoft SQL 2008 Data Mining Add-ins ➤ Server Configuration Utility. Accept all the defaults and click Next on each screens until Finish. Install the Microsoft SQL Server Data Mining Add-In by navigating to Start ➤ All Programs ➤ Microsoft Office ➤ Microsoft Office Excel 2007. Open the file ‘DMAddins_ SampleData.xlsx’. Navigate to the Data Mining tab. Click the sample data button to run the Sample Data Wizard. Click Next to get past the introductory page. The screen in Figure 1-6 will be displayed.
Figure 1-6. Data Mining Add-In setup continued
4. On the Select Sampling Type page, select the Random Sampling option, and click Next.
5. Select the Table option and a table of your choice, and click Next.
C H A P T E R 1 ■ A N O V E R V I E W O F A N A L Y T I C S 9
Figure 1-7. The final setup step for the Data Mining Add-In
7. Exit the Configuration Wizard.
8. Exit the Data Mining Add-In introduction page.
9. The sample data will be launched into the selected page. Take some time to look over the information provided.
10. Click the Data Mining tab, and navigate to the No Connection icon shown in Figure 1-8.
10 C H A P T E R 1 ■ A N O V E R V I E W O F A N A L Y T I C S
11. Click New, and type localhost in the “Server name” field and DMAddinsDB in “Catalog name.” The friendly name shown in Figure 1-9 will be filled in automatically. Click OK.
Figure 1-9. The Data Mining Add-In’s friendly name
12. When the “Connect to Analysis Services” window is closed, the Analysis Services Connections window will open automatically. Utilize this window to make the sure that DMAddinsDB (localhost) is the current connection by clicking the Make Current button displayed in Figure 1-10. Click Close.
Figure 1-10. The Make Current button
13. Navigate to the Training Data sheet and the Analyze tab. This can be found by looking at the sheet names at the bottom of the workbook. The sheet will be called Training Data. Click a cell in the table, and click Detect Categories.
C H A P T E R 1 ■ A N O V E R V I E W O F A N A L Y T I C S 11
Figure 1-11. Column selection
15. Click Run, and the window displayed in Figure 1-12 will be shown.
Figure 1-12. Detecting categories
16. Once the Detect Categories dialog closes, a series of graphs and charts will be displayed. Use the filter on the category characteristics to see different categories outlined in Figure 1-13. Rename the categories to something more fitting by editing the entries in the Category Name column of the category graph shown in Figure 1-14.
12 C H A P T E R 1 ■ A N O V E R V I E W O F A N A L Y T I C S
Figure 1-14. Category names
17. Navigate back to the Training Data sheet. All customers are categorized by their names. Customers can be filtered based on categories and targeted for marketing campaigns. For example, people in the “Medium Income, Children” category could be sent e-mails at the winter holidays describing new children’s bikes. People in the “Educated, Short Commute” category could be sent e-mails in the spring detailing the benefits of bicycle riding for individual health and the environment.
Figure 1-15. Additional information
18. Spend some time navigating through the other tabs and information shown in Figure 1-15. Explore the different ways the tools can be used.
C H A P T E R 1 ■ A N O V E R V I E W O F A N A L Y T I C S 13
Exercise 1-3. Building a Basic SQL Server Reporting Services Report
The exercise will walk through the initial creation of a reporting services report. The report, entitled Sales Report, will render information regarding opportunities won in the past year and any open opportunities. Selected parameter values will determine the data displayed.
1. SQL Server Business Intelligence Development Studio (BIDS) ships with SQL Server 2008. When you install SQL Server you must make an active decision to install BIDS. Navigate to Start ➤ All Programs ➤
SQL Server ➤ SQL Server Business Intelligence Development Studio.
2. Navigate to File ➤ New ➤ Project. Select the Report Server Project, as shown in Figure 1-16.
Figure 1-16. Select Report Server Project.
3. Give the report a name, and click OK.
4. When the Solution Explorer window shown in Figure 1-17 opens, right-click Reports, click Add, and then click Add New Item.
14 C H A P T E R 1 ■ A N O V E R V I E W O F A N A L Y T I C S
5. Select Report, and type Opportunities.rdl for the report name. Click OK. The report will open to the dataset page. Click the New drop-down in the Report Data section to create a new data source. The Data Source Properties dialog box, shown in Figure 1-18, is used to create a connection to the database.
Figure 1-18. The Data Source Properties dialog box
6. Click the Edit button to configure the connection string.
7. In this example, the report will be built on information based in Microsoft CRM. Since the database for Microsoft CRM is located on the same sever the report is being built on, the server is localhost. The database that contains information from CRM is called Contoso_MSCRM. Set the server name to localhost and the database name to Contoso_MSCRM, as shown in Figure 1-19, and click OK. Click OK again to close the Data Source Properties window.
8. Right-click the newly created data source, and click Add DataSet. Change the name of the dataset to OpenOpportunities. In the query window, type the following text:
SELECT AccountIDName AS AccountName, Name AS OpportunityName,
EstimatedValue AS EstimatedValue, EstimatedCloseDate
C H A P T E R 1 ■ A N O V E R V I E W O F A N A L Y T I C S 15
When these tasks are complete, the dataset will resemble Figure 1-20.
Figure 1-19. The Connection Properties dialog
16 C H A P T E R 1 ■ A N O V E R V I E W O F A N A L Y T I C S
9. Click OK to close the window.
10. Create a new dataset by right-clicking the data source and clicking New Dataset. In the dialog displayed in Figure 1-21, type WonOpportunities in the Name field.
Figure 1-21. Adding a new dataset
And type the following SQL code into the Query text box:
SELECT DATENAME(MONTH, ActualCloseDate) AS ActualCloseMonth, MONTH(ActualCloseDate) AS AcutalCloseDateMonthNumber, SUM(EstimatedValue)
AS EstimatedValue FROM FilteredOpportunity WHERE StateCodeName = 'Won'
AND YEAR(ActualCloseDate) = YEAR(GetDate()) AND OwnerID IN (@SalesRep)
GROUP BY DATENAME(MONTH, ActualCloseDate),MONTH(ActualCloseDate) ORDER BY MONTH(ActualCloseDate) ASC
11. Click OK. A window will pop up requesting that you define the query parameters. This box is useful to check the SQL syntax. However, it isn’t necessary in this scenario. Click OK to close the window.
12. Create a new dataset named SalesReps. Insert the following SQL code into the Query box:
C H A P T E R 1 ■ A N O V E R V I E W O F A N A L Y T I C S 17
13. Click OK to close the window. Expand the Parameters folder in the Report Data window. Double-click the SalesRep parameter to configure the parameter properties.
14. Figure 1-22 shows the general screen for the parameter properties. Set the properties of the SalesRep parameter, which will list all of the sales representatives in the SalesRep dataset. Users will have the ability to select one, all, or a few representatives. The report’s default behavior will be to run for all sales representatives. Set the values in the Report Parameter Properties dialog as follows:
The General tab:
• For Name, type SalesRep.
• For Prompt, type Sales Rep.
• For “Data type,” type Text.
• Check “Allow multiple values,” and leave “Allow null value” and “Allow blank value” blank.
• Set the parameter visibility to Visible.
The Available Values tab:
• Set available values to From Query.
• Set the Available Values to “Get values from a query,” the Dataset field to SalesRep, the Value field to SystemUserID, and Label field to FullName.
The Default Values tab:
• Set the Default Values to “Get values from a query.” Set the dataset to SalesReps and the Value field to SystemUserID.
18 C H A P T E R 1 ■ A N O V E R V I E W O F A N A L Y T I C S
15. Click OK to leave this screen. Check to see if the toolbox is located on the left-hand side of the project. If it is not, navigate to View ➤ Toolbox to add the toolbox to the view.
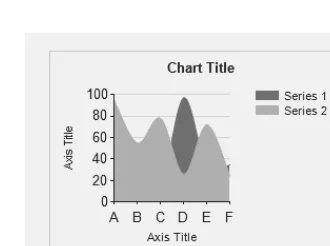
16. One informative and visually appealing way to display revenue from won opportunities over time is to chart the information in a graph. Click the chart icon, and drag it onto the canvas. Once the chart is on the canvas, a window will automatically be displayed that requires the report creator to select a chart type. Select the smooth area chart. Click OK. The results are shown in Figure 1-23.
Figure 1-23. A smooth area chart
17. Change the chart title from Chart Title to Won Opportunities by clicking the chart title and typing in the new title. Set the title format to Calibri. Right-click the graph, select Chart Properties, and set the color palate to “pastel.”
18. Drag the EstimatedValue field from the WonOpportunites dataset on to the section of the graph entitled “Drop data fields here.” Drag ActualCloseMonth from the WonOpportunities dataset into the “Drop category fields here” section. The graph will resemble Figure 1-24.
Figure 1-24. A sample graph design
19. Click the legend to highlight it. Delete the legend.
C H A P T E R 1 ■ A N O V E R V I E W O F A N A L Y T I C S 19
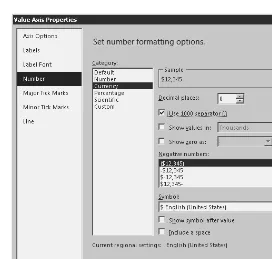
21. Right-click the y axis, and navigate to the properties. Navigate to the Number tab. Select Currency. Set the decimal places to 0, and check the “Use 1000 separator (,)” box. The properties page will look like Figure 1-25.
Figure 1-25. The Value Axis Properties dialog
22. Drag a text box on to the canvas. Click the text box, and type Sales Report. Make the text box larger, and move it to the top of the canvas, as shown in the upper left-hand corner of Figure 1-26.
Figure 1-26. Adding a text box
20 C H A P T E R 1 ■ A N O V E R V I E W O F A N A L Y T I C S
Figure 1-27. Updating the report font
24. Open the toolbox. Sales representatives need to keep track of a number of open opportunity metrics, and open opportunity information is easiest to view in a table. Click and drag a table onto the canvas. The table has three rows: one for the header, one for the footer, and one for the details. The details row is marked by three black lines. The table also has three columns.
25. Insert a column to the right by right-clicking a column and clicking Insert Column ➤ Right, as displayed in Figure 1-28.
Figure 1-28. Inserting a column
26. Figure 1-29 shows what the table will look like with data allotted for each cell. Navigate to the OpenOpportunities dataset. Expand the dataset to view that dataset’s fields. Click and drag the following fields from the dataset into the appropriate columns on the table:
• OpportunityName: The detail cell of the first column on the table • AccountName: The detail cell of the second column
C H A P T E R 1 ■ A N O V E R V I E W O F A N A L Y T I C S 21
Figure 1-29. The updated report
27. Highlight the table, and use the toolbar to change the font to Calibri.
28. Highlight the top row, and change the background to MediumSeaGreen by clicking the background color button on the toolbar.
29. Right-click the header row, and click Insert row ➤ Above. Highlight the new row and right-click. Choose Merge Cells. Use the properties window to change the background color to SeaGreen, text color to White, font size to 14pt, and text alignment to Center. Type Open Opportunities into the new row.
30. To create a totals row at the bottom of the table, right-click the details row, and click Insert Row ➤
Outside Group—Below. Navigate to the totals row. Mouse over the cell where the totals row and the Estimated Value column intersect. A table icon will appear. Click the icon, and select EstimatedValue. The new cell will read [Sum(EstimatedValue)]. The result is shown in Figure 1-30.
Figure 1-30. Adding row totals
31. Format the dollar values for Estimated Value by highlighting the applicable cells and navigating to Properties. Set the Format cell to $#,###.
22 C H A P T E R 1 ■ A N O V E R V I E W O F A N A L Y T I C S
Figure 1-31. Previewing the report
33. For extra practice, try to do the following on your own:
a. Add more columns to the open opportunities table for the Owner and Modified On.
b. Alphabetize the names of the sales representatives in the drop-down.
c. Enable sorting on the Opportunity Name, Account Name, and Estimated Value fields.
Summary
This chapter provides a background on analytics and on a number of the tools that will be used throughout this book. The exercises in future chapters will add more detail and complexity to both the product and the analytics system.
23
■ ■ ■
C H A P T E R 2
Seven Keys to Successful
Reporting Projects
F
inding the balance between the functional components of an analytics implementation, like process design, key performance indicator (KPI) development, development, look and feel, and the technical items, like tool selection and complex feature development, is a daunting task. You typically must evaluate the trade-offs associated with spending time in one area vs. another. This chapter will focus on providing you with the key tasks and tools necessary to lay an effec-tive groundwork for any analytics implementation, large or small.The Seven Keys Approach
Our approach to BI is based on three fundamental beliefs:
• All successful BI projects start with an understanding of the key metrics that drive the business and work through a proven design and implementation approach.
• Cost-effective BI projects focus on leveraging only the components of the BI platform necessary to deliver the key metrics in an accurate and timely manner. There is no one-size-fits-all solution when selecting the right components of the BI platform. A large part of defining the technical solution has to be driven by selecting the right tool for the skill level and preferences of the user community.
• Integrity of the business processes and underlying data will ultimately define the success or failure of any created reports, dashboards, and scorecards.
With these beliefs in mind, we recognize that successful business intelligence initiatives will require different tools from the Microsoft BI platform for different organizations, but we use a set of seven common key tasks that allow our clients to select the right technologies and to make the appropriate implementation choices to achieve their desired outcomes.
Key 1: Developing Executive Sponsorship
24 C H A P T E R 2 ■ S E V E N K E Y S T O S U C C E S S F U L R E P O R T I N G P R O J E C T S
Department Managers
As we mention briefly in Chapter 1, a number of factors contribute to failed business intelli-gence initiatives, including a lack of trust. Oftentimes, when senior executives use analytics to quantify the success or failure of a specific group or department, managers will immediately dismiss the quality of the data or will challenge the availability of the displayed information. In addition to posing an employee-management challenge, this lack of trust creates other issues throughout the team.
Paramount among the additional issues created is proliferation of distrust throughout the rest of the employees in the business unit. Once managers distrust the analytics presented to them, members of their teams will not only follow suit but may begin to use critical business applications less frequently.
Senior Executives
From a senior executive perspective, there are two distinct values to having a great reporting solution. First, it is important to have metrics to point to when gauging the health of a business. Second, analytical information is invaluable when managing employees and providing feed-back during evaluations.
To ensure adoption of the delivered solution, senior executives can choose between the carrot and the stick approaches. While both of these approaches have merit, the decision on direction depends on management style and the existing adoption situation within an organi-zation. Based on our experience, few managers have the stomach to make the stick work in the absence of carrots, so keep that in mind as your planning process progresses.
Regardless of their positions in the organization, the executive sponsors’ roles in the process are to drive requirements, facilitate the key performance indicator and deliverable prioritization process, and drive the overall process to completion. Ultimately, the sponsor should ensure that the organization seeks outside help where needed but owns the overall implementation.
Key 2: Identifying Organizational Key
Performance Indicators
The second key step to effectively leverage the Microsoft BI tools is to identify the key organiza-tional metrics that drive business performance; such metrics are called key performance indicators (KPIs). This may sound obvious, but it’s critical to have a clear business-oriented target when selecting the appropriate components of the platform to use. In addition, it’s important to not only identify the metrics that stakeholders find interesting but to focus on identifying and clearly defining the metrics that serve as leading indicators for where the business is headed for each key stakeholder group.
C H A P T E R 2 ■ S E V E N K E Y S T O S U C C E S S F U L R E P O R T I N G P R O J E C T S 25
• Is the data that it takes to evaluate this KPI trustworthy and readily available?
• Is the metric well defined, and will it make sense to those who evaluate it?
• Does the identified metric align with the goals of the organization?
Figure 2-1 provides a high-level example of what makes a good metric. Significantly more information on developing KPIs can be found in Chapter 3.
Figure 2-1. Ideal KPIs
Key 3: Delivering Structured, Ad Hoc Reports
Once you have secured executive sponsorship and reviewed and developed the KPIs that are pertinent to the business, it is appropriate to move into the evaluation and solution design process. Keep in mind that, in phase one at least, you should deliver only the most necessary solution components. Your solution and evaluation process should include selecting the appro-priate technologies, reviewing the approappro-priate Microsoft BI tools for various user roles, and identifying and prioritizing final phase-one solution components.
Selecting Appropriate Technologies
Evaluating the technologies to use for phase one of the implementation is an important process. This evaluation should include the high-level decision points and questions described in the following subsections.
Assessing Existing Technology Investments
26 C H A P T E R 2 ■ S E V E N K E Y S T O S U C C E S S F U L R E P O R T I N G P R O J E C T S
• What technologies does my organization currently own?
• Do I need to purchase additional technologies?
• If so, what is the associated cost?
Leveraging products that are already part of the organization, and thereby reducing the phase-one investment, may also enable the business to be more patient when evaluating the results of the initial implementation. Based on our experience, many organizations rush to judgment when the results are not immediately clear.
Taking time and having the patience to allow the results to morph during the months immediately following the implementation will benefit the organization. While data-availability and quality issues may arise, if the initial investment is manageable, both time and funds (if needed) will then be available to make these adjustments.
Assessing Technology Complexity
Think about the complexity of the available solutions. Some questions to consider follow:
• Do Excel pivot tables and graphs achieve my goals?
• Can I develop and understand my KPIs using SQL Server Reporting Services (SSRS)?
• How should the reports and dashboards I develop be made available to users?
Assessing Power User and I.T. Skill Sets
One reason to think about the complexity of the solutions you might implement is that, ultimately, people have to use and apply those solutions. A sure road to failure is to pick a solution that is too complex for the users in question. So consider these questions:
• Do I have data or reporting analysts as part of the business units consuming the reports?
• With what technologies are my IT and development staff members comfortable working?
Leveraging functional expertise as needed is important. However, you should ultimately own your analytics implementation. This notion of ownership is also true when it comes to building and supporting the tools developed. Like most business applications, if reports aren’t consistently tweaked and updated, the information they present will become stale and hold less value for the organization. Table 3-1 provides a high-level overview of the development and administration capabilities needed to work with many of the available Microsoft tools.
C H A P T E R 2 ■ S E V E N K E Y S T O S U C C E S S F U L R E P O R T I N G P R O J E C T S 27
Reviewing the Appropriate Microsoft BI Tools for Various
User Roles
From a technology perspective, evaluating tools relative to those needing to use them is likely the most important factor in selecting which components belong in phase one. Specifically, when provided with tools that don’t meet their daily or reporting needs, business users may begin to utilize data and tools that are not part of the organization-wide strategy for business intelligence.
The following roles should be considered when reviewing the appropriateness of users’ tools:
• Reporting and data analysts: Employees who are responsible for generating reports and evaluating the success of KPIs developed for the business
• Business application users: Users like sales or service representatives who are the source of much of the organization’s valuable data and who spend most of their time within lines of business applications or Microsoft Outlook
• Senior executives and managers: Individuals within the organization who need to see quick, often graphical representations of information and statistics
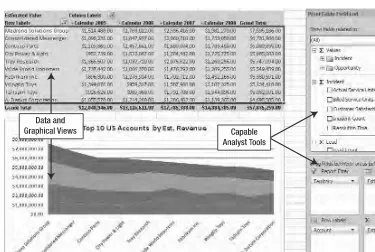
Reports available for analysts, such as the example in Figure 2-2, typically offer options allowing analysts to see both the data and associated graphical representations. Additionally, those reports often offer tools that analysts can use to slice, dice, and filter the data as needed to accomplish the desired results and answer the analyst’s questions. Finally, many analyst-focused reports and dashboards emphasize the way in which data is trending.
Table 3-1. Microsoft Product Development Skills
Microsoft Product Development Skills and Environment Data Access
Excel Business users can develop reports through knowledge of pivot tables and Excel functions.
Users will have built-in access to online analytical processing (OLAP) OLAP cubes and authoring for SQL Server data sets.
28 C H A P T E R 2 ■ S E V E N K E Y S T O S U C C E S S F U L R E P O R T I N G P R O J E C T S
Figure 2-2. An analyst-focused tool example
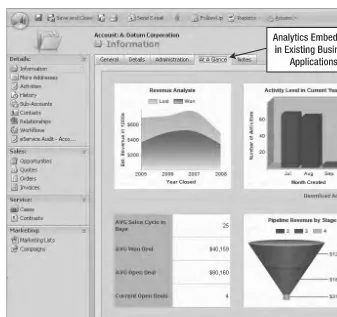
Reporting tools used by a more typical user within the business, such as sales or service representatives, need to be available quickly. They also need to be aligned with those users’ regular activities, as shown by the example in Figure 2-3. This example shows how a user can open a specific CRM account and find detailed, contextually relevant information inside the Account window. Users of ERP or accounting applications often use quick views or lists to manage information or metrics that are important. Similarly, users of CRM applications benefit from analytics that are embedded in various places throughout the tool that provide information at a glance.
C H A P T E R 2 ■ S E V E N K E Y S T O S U C C E S S F U L R E P O R T I N G P R O J E C T S 29
Figure 2-3. An example of embedded analytics for business application users
30 C H A P T E R 2 ■ S E V E N K E Y S T O S U C C E S S F U L R E P O R T I N G P R O J E C T S
Throughout the remainder of this book, we’ll discuss how simple tools like Microsoft Excel can offer many of the benefits needed by organizations during phase one of their business intelligence initiative. Applications like SharePoint can provide more content and flashiness, but you are often better off saving those for a later phase of your analytics implementation.
■
Note
The images provided in Figures 2-4, 2-6, and 2-9 are part of the CRM Analytics Accelerator released by the Microsoft Dynamics CRM product team. To download the available CRM accelerators or find additional information, please visit www.codeplex.com/crmaccelerators.Identifying and Prioritizing Final Phase-One
Solution Components
Once you have considered the preceding technical items, it’s time to move on to evaluating and prioritizing the items to be included in phase one of the implementation. The type of prioritization exercise, as well as who is involved, may vary depending on the size and complexity of the implementation. Some typical questions that may assist with the evaluation follow:
• Is the KPI being reported core to my business, or is it something that can wait until a later phase?
• Is the data that feeds that KPI currently available, or will data consolidation be necessary?
• Can I use existing software to complete phase one?
• Do I have the skills in-house to complete the development needed for this phase, or should I work with a technology partner?
• Can I compare the metrics I defined?
• Are the data sources needed clearly defined?
• Can the information be presented in a timely fashion?
• Will the reports and dashboard being considered allow me to draw user attention to the information, rather than the bells and whistles?
• Will the structure allow users to interact with the data to the extent they need to?
• Can users interact with the reports online, offline, on mobile devices, or by printing the reports, whichever format is the most useful?
• Are the displays being considered data dense, thereby providing the most information in a consolidated format?
C H A P T E R 2 ■ S E V E N K E Y S T O S U C C E S S F U L R E P O R T I N G P R O J E C T S 31
of the metrics they would like to see and subsequently clarify their requirements within the context of the actual data with each new version of reports. In this scenario, no detailed design document is generated. Instead, the development team builds iteratively toward a solution.
Figure 2-5. Iteratively designing and building an analytics solution
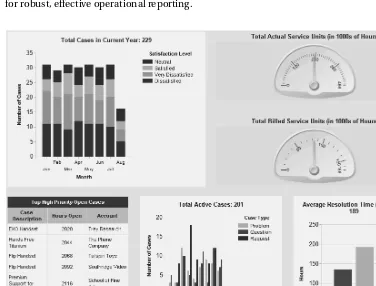
The solution is actively developed with the business users; business owners see a quick return on their investments, and the project has built-in flexibility to adapt to meet the business needs as they evolve. The final solution, which could end up as shown in Figure 2-6, provides for robust, effective operational reporting.
32 C H A P T E R 2 ■ S E V E N K E Y S T O S U C C E S S F U L R E P O R T I N G P R O J E C T S
With functional and technical components of the implementation evaluated, it becomes practical to manage the relevant attributes from the core systems that will serve as the source data for the business intelligence initiative. At this stage in the process, the next two key steps, which both focus on data, become important.
Key 4: Ensuring Data Availability
After deciding on the KPIs and associated tools, the next step to consider is to identify where the relevant data exists and how it relates to the other attributes that make up any given KPI. This is normally a relatively straightforward exercise of reviewing the data models of the affected applications, identifying related keys to link information together, and identifying any under-lying inconsistencies in the granularity of the data.
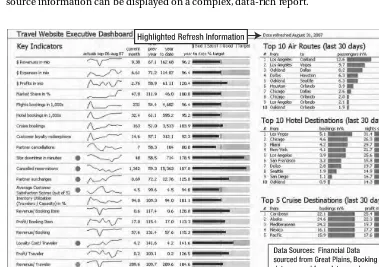
Once you’ve identified the data, you should make sure both data source and data refresh information is available on all the reports that you generate. That source and refresh informa-tion will quickly answer quesinforma-tions about the source of the data should inconsistencies arise and will allow users to compare apples to apples when viewing multiple versions of a report.
Figure 2-7 provides an example of how refresh information can be provided and where source information can be displayed on a complex, data-rich report.
C H A P T E R 2 ■ S E V E N K E Y S T O S U C C E S S F U L R E P O R T I N G P R O J E C T S 33
Key 5: Proactively Reviewing Data Quality
Conduct a proactive, thorough review of the quality of the underlying data. By ensuring the data is of good quality and up to date, you can avoid confusion about report accuracy and ensure that your project does not fail due to business stakeholders’ inability to trust the data.
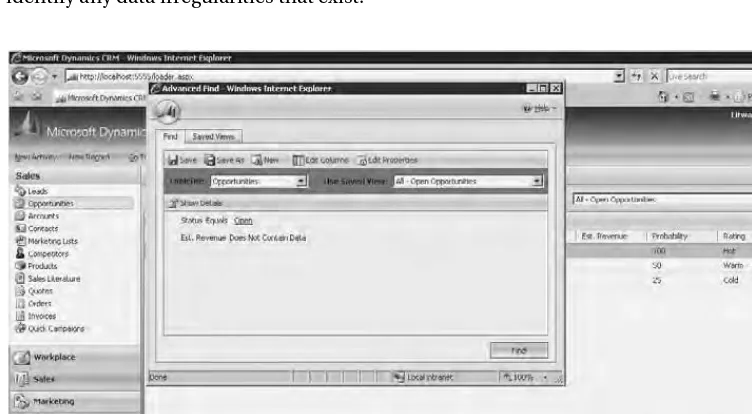
In many instances, data quality can be reviewed within the lines of business applications themselves. By performing advanced searches and reviewing simple lists of information, many data issues will become apparent. Additionally, many applications contain algorithms that help to identify issues that exist with the data.
Figure 2-8 illustrates a simple CRM application query that can identify sales opportunities that would otherwise corrupt pipeline reports. Most business applications will provide the same functionality, and organizations must be able to rely on power users of key applications to complete this analysis. A simple review of this type of operational and ad hoc report will identify any data irregularities that exist.
Figure 2-8. A data-quality search example
Key 6: Adjusting Core System Business Rules
34 C H A P T E R 2 ■ S E V E N K E Y S T O S U C C E S S F U L R E P O R T I N G P R O J E C T S
Based on our implementation experience, the most effective way to get improved return on any BI initiative is to allocate 15–20 percent of the total project time to support the business and associated applications after the initial reporting rollout has gone into production. This level of planning allows the team to improve the business performance by combining the insights from the reporting systems with their underlying business applications’ ability to manage business rules. Here are some enhancements that may happen during this postdeployment phase:
• Development of improved accuracy and consistency within reports:
• Modify field values available in pick lists to ensure all individuals are using common terms.
• Modify the attributes that are required in underlying business systems to ensure reporting is complete.
• Deliver ad hoc training to resolve data inconsistencies among users in different geographies.
• Implementation of systematic resolution plans for newly found problems:
• Apply a business rule that prevents sales representatives from submitting orders unless a legal review is completed of the contract.
• Apply a business rule that will reroute assigned leads if left untouched for more than three days.
• Organized pursuit of newly discovered opportunities:
• Apply a business rule to automatically create new opportunities for maintenance contract renewals in advance of existing contracts closing.
• Apply a business rule to automatically seek to replenish inventory if enough qualified opportunities exist that shortages would occur.
Key 7: Delivering Organization-wide
Performance Management
Following the completion of the preceding steps, and more importantly, delivery of an opera-tional, ad hoc, phase-one reporting solution, organizations are ready to commit additional time and project cycles to report enhancement and growth of their existing analytics solution.
C H A P T E R 2 ■ S E V E N K E Y S T O S U C C E S S F U L R E P O R T I N G P R O J E C T S 35
performing to its target. To achieve this goal, Microsoft provides the PerformancePoint appli-cation that consolidates access to all other reporting tools and allows for extremely robust and visual analysis of the business.
Figure 2-9. An effective performance management example
Implementing organization-wide performance management is the goal for many organi-zations undertaking BI initiatives, but it is critical to take a step-by-step approach toward achieving this goal.
Summary
By working through the key steps in this chapter in small, manageable stages, you will ultimately provide for a more successful analytics implementation. These keys to implementation also allow you to avoid some of the primary pitfalls associated with implementations discussed in Chapter 1, especially:
• Differing Priorities
• Data Explosion
• Lack of Trust.
36 C H A P T E R 2 ■ S E V E N K E Y S T O S U C C E S S F U L R E P O R T I N G P R O J E C T S
Figure 2-10. Continued analytics process and technology improvement
37
■ ■ ■
C H A P T E R 3
Key Performance Indicators
T
his chapter outlines key considerations in defining key performance indicators (KPIs) that will be meaningful when rolled out in scorecards across the organization. This is not intended to be a comprehensive presentation on KPIs (a topic that could itself span the length of an entire book), but it will outline core principles that we have seen leveraged by organizations as they have set up their first few versions of dashboards and scorecards. In addition, we will attempt to provide a practical example of how a company might apply these principles to develop a list of meaningful KPIs.Keeping KPIs Forward Looking
Analytics initiatives often begin with organizations requesting that business users document their requirements for dashboards and reports. Users will work as individuals or in small teams to list a set of metrics that they believe are used to quantitatively evaluate their performance. The technical team will follow up with a proposed approach for rendering these metrics in a dashboard or set of reports while deprecating any metrics for which they cannot effectively capture the data. At first glance, this approach is a common-sense way to begin to deliver dash-boards to the organization, but it does miss a larger truth.
The larger truth is that, in many organizations, the metrics currently in place for evaluating sales and marketing performance are strictly backward looking and reflect performance of past periods. For example, a typical request for a sales manager dashboard might include the following components:
• Sales forecast: Show all the deals set to close within the current quarter weighted by probability or sales stage.
• Sales pipeline: Show the value of all the open deals in my pipeline and the trend over time.
• Performance: Show the performance of my sales team to date (e.g., win value and win rate).
38 C H A P T E R 3 ■ K E Y P E R F O R M A N C E I N D I C A T O R S
Figure 3-1. Basic sales scorecard
Figure 3-1 might appear to represent a comprehensive solution for a sales dashboard. In reality, this dashboard is almost entirely focused on tracking performance using metrics that look backward. By this, I mean that each measure on this dashboard shows you the sales orga-nization from a different perspective based on where it is today (and historical context of where it has been), but it does not provide insight into where it is going to be one, two, or three quarters from now.
A fully functioning analytical solution will combine critical metrics that show performance to date with metrics that are indicative of future performance. The difference is that one set of metrics tells you where you are. The other provides strong evidence for where you will be.
Organizations have a tendency to fall back on the metrics that demonstrate where they are right now, because those metrics generally mirror the way that peoples’ job performances are evaluated (i.e., the sales manager is measured on total revenue, so a sales forecast seems like the best metric to review on a routine basis), and these metrics are easier for technical teams to capture and reproduce in repeatable reports and dashboards. The power of a complete set of KPIs is that they can not only illuminate where the organization is today but project where the organization will be and provide visibility into where key individuals can engage to correct the course for the organization if the forward-looking KPIs are off track.
C H A P T E R 3 ■ K E Y P E R F O R M A N C E I N D I C A T O R S 39
Understanding the Core Principles for KPIs
The set of core principles outlined in this section can be used by any organization to validate a set of foundational KPIs that can serve as the core business metrics for a comprehensive sales and marketing analytics program. For deeper information on the development of KPIs and their role in organizational strategy the following are excellent resources, see Key Performance Indicators by David Paramenter (Wiley, 2007) and Balanced Scorecard Step-By-Step by Paul Niven (Wiley, 2006).
In order for KPIs to be useful in driving business performance, you need to have a standard for what constitutes a good KPI. Further, you need to have an awareness of this standard in order to be active participants in managing the KPIs and refining them over time. Core princi-ples that we encourage clients to follow include the following:
• The metric is specific.
• The metric is clearly owned by a given department or group.
• The metric is measurable.
• The metric can be produced in a timely manner.
• The quantity of KPIs must be limited to a manageable few items for a given scorecard.
• KPIs must have targets.
• KPIs must be aligned with overall organizational goals.
Let’s examine each of these principles in detail.
Using Specific Metrics
Using specific metrics means that each metric has a precise definition that can be easily explained and will be understood by any reasonable person within the organization. The most common example of a sales and marketing metric that fails the specificity test is forecasted revenue. We’re not saying that having a measure for forecasted revenue isn’t important, but we do mean to say that this metric must be completely clear and must be well understood across the orga-nization. For many organizations that we work with, when we ask what forecast revenue is, the response will be that obviously this is revenue associated with open deals that our sales team currently has in progress. This definition may be true, but it lacks a great deal of specificity.
A good, specific forecast revenue metric definition might be as follows: forecast revenue is the weighted value for all deals recorded in Microsoft Dynamics CRM that have been qualified and are expected to close this quarter. The value for all deals has been converted to US dollars based on current exchange rates. This calculation can be completed by summing the forecast value and multiplying this amount by the close probability field in Dynamics CRM.
40 C H A P T E R 3 ■ K E Y P E R F O R M A N C E I N D I C A T O R S
Ensuring Clear Metric Ownership
Ownership takes a metric from being merely interesting into something that will be acted upon. The key here is that, in order for a metric to be useful in driving the organization forward, some individual or department must be accountable for keeping it on track. Knowing the rate at which maintenance is attached to product sales may be interesting, but that knowledge is unlikely to be relevant enough to be a KPI if no individual is clearly accountable for this attach-ment. By holding your metrics to a standard that there must be someone clearly accountable for them in order to spend time measuring and displaying them, you are performing one key filtering activity that will help to maintain your focus on a critical few metrics that truly drive the business.
Keeping Metrics Measurable
All elements that are displayed in a scorecard must be quantifiable. Measuring employee satis-faction is a great concept. However, without a business process and system in place to track both current and ongoing satisfaction, it is not a relevant KPI, because you simply can’t use the metric in decision making without guessing. Perhaps you will identify a metric as critical, and this will lead you to define the process and systems around it in order to include it in your scorecard. Making a metric measurable can be an excellent use of time and resources, but we would strongly recommend against referring to metrics as KPIs unless you have in place the ability to measure them. Making a metric measurable includes not only the systems to capture the metric but also the business processes that create consistency, audit tracking, and oversight.
Using Timely Metrics
One other seemingly small detail in the management of KPIs is paying attention to the time interval within which a metric can be tracked. If you have a weekly scorecard where two of the seven metrics are only reported monthly, those metrics are of questionable value. We do realize that not all measures will follow the same cadence, but we assert that, in order for your KPIs to be useful in decision making, you must be able to repeatedly produce each metric in a routine, consistent time interval so that it can be used in conjunction with the other KPIs to get an overall picture of the current state of the organization.
Limiting the Quantity of KPIs for a Given Scorecard
One key client of ours asked us to review its management reporting. The company called us in and, with great pride, displayed a 50-page manual that was produced monthly and included metrics for virtually every operation in a 200-person department. The executives explained that the book took too long to assemble (about 20 days) and that, unfortunately, was not widely reviewed. Their conclusions were that the current reports needed to be more automated and that a big rollout of the new book was needed, so people would know that they should refer to it to improve their performance.
We asked the general manager who owned the document if he referred to it on a regular basis. He said, “No, it’s really just too much information for me to make sense of it. I don’t have a full day to devote to figuring out what it all means.”