AGRICULTURAL DEVELOPMENT IN INDONESIA:
CURRENT PROBLEMS, ISSUES, AND POLICIES
Joyo Winoto and Hermanto Siregar
1 Lecturer at Department of Economics, Faculty of Economics and Management (FEM), Bogor Agricultural University (IPB); Head of National Land Agency of Republic of Indonesia.
2 Lecturer at Department of Economics, FEM-IPB.
ABSTRAK
Setelah satu dekade krisis finansial Asia, pertumbuhan ekonomi Indonesia cenderung telah meningkat namun dengan laju yang masih lebih rendah dibandingkan sebelum krisis. Dengan laju dan kualitas pertumbuhan yang relatif rendah, laju pengangguran dan kemiskinan yang tinggi sulit untuk diturunkan. Pembangunan pertanian dan perdesaan, yang pada dasarnya potensial untuk mengatasi masalah pengangguran dan kemiskinan, ternyata masih berjalan lamban. Upaya-upaya pembangunan, baik pertanian maupun nonpertanian, sejauh ini cenderung masih terkonsentrasi di pulau Jawa, di mana ketersediaan lahannya sangat terbatas sehingga mempersulit upaya mengatasi kedua masalah tersebut. Kemiskinan dan pengangguran yang relatif tinggi cenderung semakin meningkatkan praktik usahatani yang tidak berkelanjutan, sehingga meningkatkan degradasi lahan dan mendorong perambahan hutan, yang pada gilirannya dapat mengancam keberlanjutan sumberdaya air. Untuk mengatasi masalah kemiskinan dan pengangguran, diperlukan kebijakan pertanian dan pembangunan pedesaan yang komprehensif. Keefektifan kebijakan tersebut sangat tergantung pada keterpaduan terobosan-terobosan dalam hal peningkatan produktivitas, serta pengembangan infrastruktur dan kelembagaan pedesaan.
Kata kunci: Indonesia,kemiskinan, pembangunan pertanian, pertumbuhan ekonomi
ABSTRACT
After around a decade since the Asian Financial Crisis, the Indonesian economy has still experienced a relatively slow growth. The growth has tended to increase, but is considerably lower than that of the pre-crisis era. With a relatively low level and the quality of growth, the high rates of unemployment and poverty have been difficult to reduce. Despite its potential role of reducing the rates of poverty and unemployment, agricultural growth and rural development have yet tended to be stagnant. Development efforts, on both agriculture and non-agriculture, have still been concentrated in Java whereby land availability is very limited. The problems of poverty and unemployment seem to have intensified less-sustainable agricultural practices, giving rises—at least partially—to more land degradation and threats to water sustainability. To overcome the problems, the country needs sound/comprehensive agricultural and rural development policy. Effectiveness of such policy in overcoming the problems would depend much on the integration of serious efforts to enhance agricultural productivity as well as to improve rural infrastructure and social-economic institutions.
INTRODUCTION
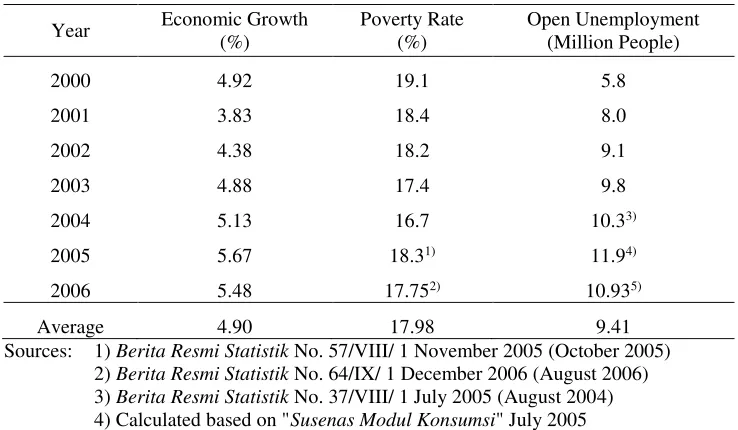
After the onset of the Asian Financial Crisis, the Indonesian economy has grown slower than that before the crisis. During pre-crisis era (1970-1996), the average growth rate of the economy was around 7 percent; whereas during post-crisis (2000-2006) the average was only 4.9 percent. In line with this quite slow progress, the open unemployment has constantly rising from 5.8 million people in 2000 to 11.9 million in 2005 before bouncing to around 10.9 million a year later (which is approximately 10 percent of the labor force). Poverty has actually tended to decrease, i.e. from 19.1 percent in 2000 to 17.75 percent in 2006 (Table 1). However, the last figure can be considered as still too high, i.e. amounting to 39.05 million people. Combination of the relatively slow growth and high unemployment to large extent has made poverty quite difficult to reduce.
Table 1. Economic Growth, Poverty and Open Unemployment, Post-Crisis
Year Economic Growth
(%)
Poverty Rate (%)
Open Unemployment (Million People)
2000 4.92 19.1 5.8
2001 3.83 18.4 8.0
2002 4.38 18.2 9.1
2003 4.88 17.4 9.8
2004 5.13 16.7 10.33)
2005 5.67 18.31) 11.94)
2006 5.48 17.752) 10.935)
Average 4.90 17.98 9.41
Sources: 1) Berita Resmi Statistik No. 57/VIII/ 1 November 2005 (October 2005) 2) Berita Resmi Statistik No. 64/IX/ 1 December 2006 (August 2006) 3) Berita Resmi Statistik No. 37/VIII/ 1 July 2005 (August 2004) 4) Calculated based on "Susenas Modul Konsumsi" July 2005 5) Berita Resmi Statistik No. 47/IX/ 1 September 2006 (Marh 2006).
not be equally enjoyed across sectors.1 The growth mainly increases in capital intensive sectors but is approximately stagnant in labor intensive sectors, especially of agriculture and of manufacturing industry. Thus if the critical problems are to be solved, labor intensive sectors, particularly of agriculture which provides jobs to most of the workers, must be seriously redeveloped. There is good tendency that the current government of Indonesia does so.
Therefore, it is important to reexamine recent progress of agricultural sector, problems and challenges faced by the sector, as well as policies for the sector. The objective of this paper is to offer a contribution to such reexamination.
RECENT TRENDS, PROBLEMS AND ISSUES
There are a number of problems/issues facing the Indonesia economy. Discussion on such issues is undertaken by relating it to recent trends of relevant data as follows.
Slow Growth of Agriculture
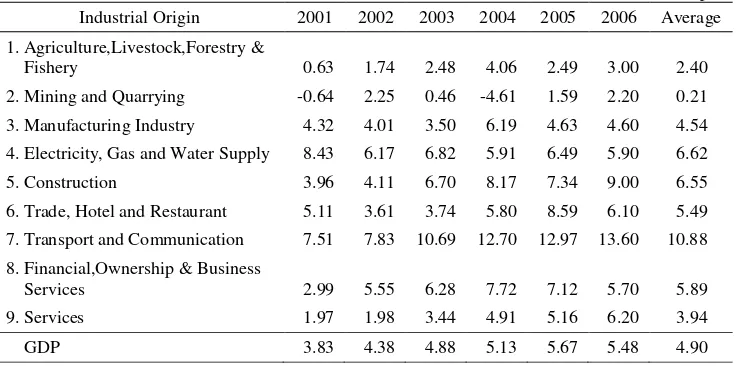
After the crisis, particularly during the period 2001-2006, it is recorded that agricultural output (GDP) growth is the second lowest (after mining and quarrying output growth) with an average of 2.40 percent p.a. (Table 2). This is less than a half of the economy (GDP) average growth. The relatively slow growth of agricultural output has been associated with the negative trends in the growth of non-food crops output and in the growth of livestock output (Appendix 1). Similar situation has happened with the growth of farm food crops, which are the main contributor of the agricultural GDP, especially during the last four years.
The relatively slow growth of agricultural output actually would not be considered as a problem if it has occurred within the frame of ‘structural
transformation’.2 That is, manufacturing industry experiences high growth and
1 In order to be able to reduce unemployment and poverty, the growth needs be sufficiently high. The Okun law: ut = –(gt – gtn) + t, where >0 and t is error term, suggests that as long as economic growth (gt) is still less than ‘natural rate’ of economic growth (gtn), which can be approximated by the average growth rate, unemployment rate (ut) increases. Since the post-crisis rates of economic growth have never exceeded the long run growth rate average, which is of around 7 percent, then unemployment still tends to increase.
hence is able to absorb surplus labor from the agriculture, so that output per labor (productivity) of agriculture increases. But as shown in Table 2, average growth of manufacturing industry is only 4.54 percent, which is even smaller than that of the economy (4.90 percent). Under this situation, manufacturing industry is of course unable to absorb excess labor from agriculture, and hence the many workers of agricultural sector have to share the slow growing agricultural output. This constrains the agricultural productivity to expand.
Table 2. Growth of Output of Agricultural and Other Sectors, Post-Crisis
Percent p.a. Industrial Origin 2001 2002 2003 2004 2005 2006 Average
1. Agriculture,Livestock,Forestry &
Fishery 0.63 1.74 2.48 4.06 2.49 3.00 2.40
2. Mining and Quarrying -0.64 2.25 0.46 -4.61 1.59 2.20 0.21
3. Manufacturing Industry 4.32 4.01 3.50 6.19 4.63 4.60 4.54
4. Electricity, Gas and Water Supply 8.43 6.17 6.82 5.91 6.49 5.90 6.62
5. Construction 3.96 4.11 6.70 8.17 7.34 9.00 6.55
6. Trade, Hotel and Restaurant 5.11 3.61 3.74 5.80 8.59 6.10 5.49
7. Transport and Communication 7.51 7.83 10.69 12.70 12.97 13.60 10.88
8. Financial,Ownership & Business
Services 2.99 5.55 6.28 7.72 7.12 5.70 5.89
9. Services 1.97 1.98 3.44 4.91 5.16 6.20 3.94
GDP 3.83 4.38 4.88 5.13 5.67 5.48 4.90
Source: BPS (Various Years).
With regard to agricultural land, there is an alarming fact on the conversion of agricultural land to non-agro uses.3 According to Departemen Pertanian (2005), in Java island itself the conversion rate of the agricultural land has reached approximately 100,000 hectare per annum. With relatively low agricultural yield (or productivity), such conversion clearly becomes an important factor explaining the relatively slow growth of Indonesian agriculture output.
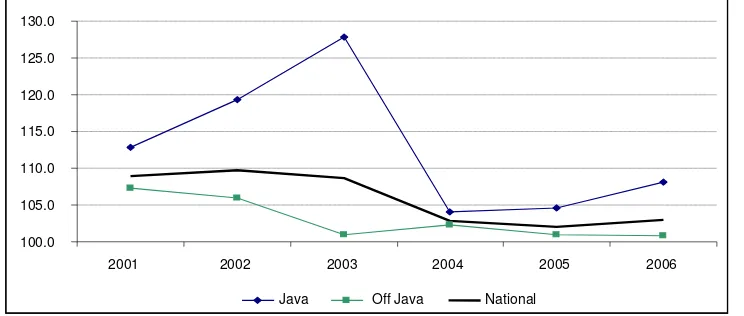
The relatively slow growth of agricultural output is in line with the negative trend occurring in the farmer terms of trade, which is defined as the ratio of index of prices received by farmers to index of prices paid by the farmers. It can be seen from Figure 1, particularly during the last four years, that the farmer terms
industry’s GDP through increases in demand for agricultural commodities which are used as inputs in the industry. Accordingly, services (tertiary sector) develop, providing extra demand for labor. In turns, agriculture share to total employment decline, manufacture and services contributions to total employment rise.
of trade in general has decreased in Java and been more or less stagnant in the Outer Islands. Combination of relatively slow growth of agricultural output and the lowered or stagnant farmer terms of trade indicate that farmers’ real income has recently been approximately stagnant.
Source: BPS (processed).
Figure 1. Farmer Terms of Trade Index, 2001-2006
There is an indication that the structural transformation is halted. It can be seen in Figure 2 that after the onset of the Asian crisis (1997), the share of agriculture to GDP rebounded from about 15 percent to approximately 17 percent in 1998, and had stayed at around this level until 2002. After 2002, the share has constantly decreased to reach a level of around 13 percent in 2006. During the same time period (2003-2006), the manufacturing industry sector’s share to GDP has also declined from around 29 percent to approximately 28 percent. So has been the GDP share of trade, hotel and restaurant sector, i.e. from around 17 percent to approximately 15 percent. The source of economic growth during the last four years is therefore from the other sectors. Since the other sectors (services) are less labor intensive than the three sectors, then the excess workers in agricultural sector cannot go anywhere but stay in agriculture or become disguised unemployment.
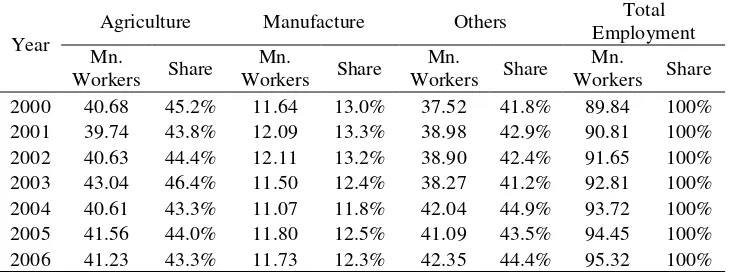
The conjuncture above is quite in line with the figures of sectoral employment presented in Table 3. During the period 2000-2006, agriculture share to total employment has tended to decrease but not that much, i.e. from around 45 percent to approximately 43 percent. Unfortunately, employment share of manufacturing industry has also tended to decline from about 13 percent to around 12 percent. It is employment share of “others” sector, which includes the trade sector whereby there are so many micro and small enterprises, that has tended to increase, i.e. from around 42 percent to about 44 percent.
100.0 105.0 110.0 115.0 120.0 125.0 130.0
2001 2002 2003 2004 2005 2006
12
1993 1994 1995 1996 1997 1998 1999 2000 2001 2002 2003 2004 2005 2006
Pe
Figure 2. Agricultural and Other Sectoral Shares to GDP, 1993-2006
Table 3. Employment of Agricultural and Other Sectors, 2000-2006
Year
Agriculture Manufacture Others Total
Employment
The weakening condition of Indonesia’s manufacturing industry sector
It can be seen from Appendix 1 that the main source of growth in the manufacturing industry sector is the industry of transport equipment machinery and apparatus, whose growth is around 8.9 percent to 18.1 percent, averaging at 14.84 percent. This manufacturing industry is relatively less labor intensive than the aforementioned industries, and hence employment effect of this growth quite negligible if one compares it to total labor force of Indonesia which is above 100 million and growing with the rate of approximately 2.5 million per annum. So, if unemployment is to be reduced and industrial demand for agricultural outputs to be increased, kinds of manufacturing industry that should be seriously promoted are agro-based industries.
Poverty and Relative Stagnation of Rural Development
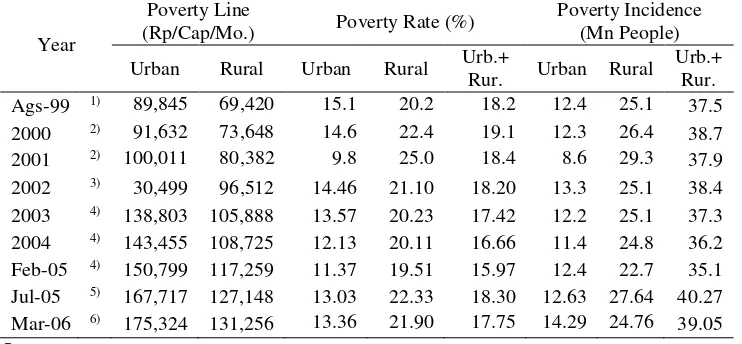
Poverty rate (in urban plus rural regions) had actually been decreased during the period 1999-Early 2005 from around 18 percent to 16 percent (Table 4).4 The speed of such a decrease can however be considered as too slow, so that the number of people below poverty line (“poverty incidence”) reduces relatively slowly from 37.5 million people to 35.1 million people during the time period. This is equivalent to an average growth of -1.1 percent p.a., which, in absolute term, is reasonably lower than the population growth of the country (1.3 percent p.a.).
With the slow growth of poverty reduction, a nominal shock such as an increase in the oil price—due to the oil subsidy cuts in March and October 2005— can easily uplift the poverty indicators. Due to this shock, the number of poverty incidence increased quite sharply from 36.2 million people in 2004 to 37.7 million people in 2005 and to around 39.1 million people in March 2006.5 This is an addition of almost three million poor people. Returning to the poverty rate, taking into account the last two observations, its growth average for the period 2000-March 2006 is positive (i.e. 0.6 percent p.a.).
Decomposing the poverty indicators into regions, it can be seen from Table 4 that most of the poor people domicile in rural region. Averaging the poverty rate for the period 1999-March 2006, one can find that the average for the rural region (21.5 percent) is approximately 163 percent higher than that for the urban region (13.1 percent). Calculating growth of the poverty rate, it can be found that during the period 2000-March 2006, simple average of the growth is 0.7 percent in urban region and 1.5 percent in rural region, indicating that
4 Poverty relates closely to food and other insecurities. According to the OECD (in Stamoulis and Zezza, 2003), ‘poverty encompasses different dimensions of deprivation that relate to human capabilities including consumption and food security, health, education, rights, voice, security, dignity and decent work’.
impoverishment occurs faster in rural areas. This indicates that rural development has not yet succeeded in promoting the wealth of rural dwellers.
Table 4. Poverty in Rural and Urban Regions, 1999-2006
Year
Poverty Line
(Rp/Cap/Mo.) Poverty Rate (%)
Poverty Incidence (Mn People) Urban Rural Urban Rural Urb.+
Rur. Urban Rural
Urb.+ Rur. Ags-99 1) 89,845 69,420 15.1 20.2 18.2 12.4 25.1 37.5
2000 2) 91,632 73,648 14.6 22.4 19.1 12.3 26.4 38.7
2001 2) 100,011 80,382 9.8 25.0 18.4 8.6 29.3 37.9
2002 3) 30,499 96,512 14.46 21.10 18.20 13.3 25.1 38.4 2003 4) 138,803 105,888 13.57 20.23 17.42 12.2 25.1 37.3 2004 4) 143,455 108,725 12.13 20.11 16.66 11.4 24.8 36.2 Feb-05 4) 150,799 117,259 11.37 19.51 15.97 12.4 22.7 35.1 Jul-05 5) 167,717 127,148 13.03 22.33 18.30 12.63 27.64 40.27 Mar-06 6) 175,324 131,256 13.36 21.90 17.75 14.29 24.76 39.05 Sources:
1) Calculated from ”Susenas Mini” August 1999. 2) Calculated from “Susenas Kor” 2000 dan 2001. 3) Calculated from “Susenas Modul Konsumsi” 2002.
4) Calculated from ”Susenas Panel Modul Konsumsi” Februari 2003, 2004 dan 2005. 5) Calculated from ”Susenas Modul Konsumsi” Juli 2005.
6) Berita Resmi Statistik No. 47/IX/ 1 September 2006.
This is quite the opposite to the expected result of implementation of regional autonomy policy.6 Under this policy, almost one-third of the national budget is allocated to the regional (local) governments. In addition to this, the national government still has some budget allocations to finance cross-regional developments. Thus, the seemingly low achievement of the regional autonomy implementation most unlikely relates to deficiency in budget alone. Lacking institutional and human resource capacity of the local (particularly of districts) are also important factors constraining the improvement of social-economic conditions of the districts people.
For example, development and maintenance of district level infrastructure have been relatively poor after the implementation of the regional autonomy
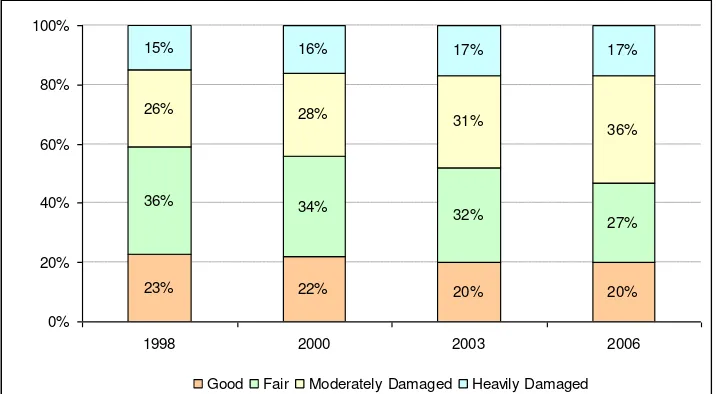
policy, i.e. since January 2001. Before implementation of the policy, condition of roads at district level had actually been gradually degrading. It can be seen from Figure 3 that moderately and heavily damaged district roads increased from a composite of 41 percent in 1998 to 44 percent in 2000. This could be considered as the carried over negative effect of the Asian crisis. Such composite continued to worsen after the enactment of the regional autonomy policy to 48 percent in 2003 and 53 percent in 2006. For comparison, moderately and heavily damaged national roads (not shown in the figure) were only 13 percent in 2000 and 20 percent in 2006.
23% 22% 20% 20%
36% 34%
32% 27%
26% 28%
31% 36%
15% 16% 17% 17%
0% 20% 40% 60% 80% 100%
1998 2000 2003 2006
Good Fair Moderately Damaged Heavily Damaged
Source: Ministry of Public Works (Various Years)
Figure 3. Condition of District Roads before and after the Implementation of the Regional Autonomy Policy
Damaged infrastructure, including roads, leads to increases in transport costs. Higher autonomy allows districts/cities governments to enact local regulations, including issuing retribution and local levies, which put more burdens on economic players including farmers. These lead to high cost economy, deteriorating competitiveness of agricultural commodities and products yielded in the rural regions. In turns, this constrains rural development.
Wide Disparities in Agriculture: Concentration is Still in Java Island
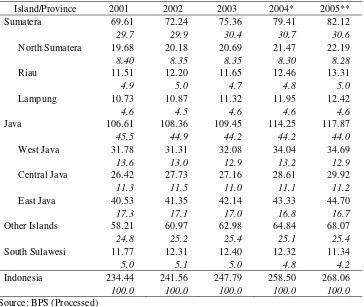
Java—a relatively small island that accounts for only 11 percent of the Indonesian land area but hosts more than 60 percent of the Indonesian population. Main economic activities (agriculture, manufacturing, trade, and services) are dominantly run in this island. With respect to agriculture, main commodities produced in Java are of food crops. Sumatera, the third largest island in the
country produces approximately 31 percent of Indonesia’s agricultural GDP in the
same year; whereas the other islands, which are the vast majority in terms of area, only produces around 25 percent of the agricultural GDP. Estate crops have been mainly produced in Sumatera.
Table 5. Distribution of Agricultural GDP by Island and Provinces, 2001-2005 (Rp Tn.)
Island/Province 2001 2002 2003 2004* 2005**
Sumatera 69.61 72.24 75.36 79.41 82.12
29.7 29.9 30.4 30.7 30.6
North Sumatera 19.68 20.18 20.69 21.47 22.19
8.40 8.35 8.35 8.30 8.28
Riau 11.51 12.20 11.65 12.46 13.31
4.9 5.0 4.7 4.8 5.0
Lampung 10.73 10.87 11.32 11.95 12.42
4.6 4.5 4.6 4.6 4.6
Java 106.61 108.36 109.45 114.25 117.87
45.5 44.9 44.2 44.2 44.0
West Java 31.78 31.31 32.08 34.04 34.69
13.6 13.0 12.9 13.2 12.9
Central Java 26.42 27.73 27.16 28.61 29.92
11.3 11.5 11.0 11.1 11.2
East Java 40.53 41.35 42.14 43.33 44.70
17.3 17.1 17.0 16.8 16.7
Other Islands 58.21 60.97 62.98 64.84 68.07
24.8 25.2 25.4 25.1 25.4
South Sulawesi 11.77 12.31 12.40 12.32 11.34
5.0 5.1 5.0 4.8 4.2
Indonesia 234.44 241.56 247.79 258.50 268.06
100.0 100.0 100.0 100.0 100.0
Source: BPS (Processed)
Notes: * Preliminary Figures ** Very Preliminary Figures Italicsare percentage to Indonesia’s agricultural GDP.
Out of the 33 provinces of Indonesia, there are only seven provinces whose agricultural GDP exceeds Rp 10 trillions.7 Three of these provinces are in
Java, another three in Sumatera, and only one in the rest of the islands (i.e. South Sulawesi province). Such provinces in Java are the main contributors of food commodities, and so is South Sulawesi. The provinces in Sumatera are major contributors of estate plantation commodities, especially oil palm and rubber.
Competition in terms of land utilization between agricultural and non-agricultural uses in Java has constantly increased. The conversion rate from paddy field alone to non-agricultural uses in Java reaches around 40,000 ha per year.8 Along with this tendency, the number of agricultural households in Java increased from around 11.7 million in 1993 to 13.6 million in 2003. The figure for the whole Indonesia during the same time period increased from 20.8 million to 24.9 million (Table 6), suggesting the addition of more than four million households entering the agricultural sector during a decade—an average of around 400 thousand new entrants to the sector per annum. This situation had moreover worsened as the percentage of agricultural households that really utilized their farm plots been lowered from 99 percent to 97 percent during the same time period.
Table 6. Number of Agricultural Households in Indonesia, 1993 and 2003
Items Agricultural
Household (000)
Agr. HH Utilizing Their Farm Land (000)
Agr. HH with Agr.Land <0.5Ha (000)
Agricultural Census 1993
- Java 11,671 11,564 8,067
100% 99% 69%
- Off Java 9,116 8,954 2,737
100% 98% 30%
- Indonesia 20,787 20,518 10,804
100% 99% 52%
Agricultural Census 2003
- Java 13,583 13,262 9,842
100% 98% 72%
- Off Java 11,286 10,799 3,411
100% 96% 30%
- Indonesia 24,869 24,061 13,253
100% 97% 53%
Source: BPS (Processed).
It seems likely that agricultural land expansion had grown less rapidly than the additional/new agricultural households.9 As a result, land fragmentation
8 Agus and Irawan (2006) asserted that, during 1999-2002, paddy field conversion through out Indonesia had reached the average of 141,000 hectare per annum.
increased, particularly in Java. In this island, households with agricultural land of less than 0.5 ha had increased from 69 percent in 1993 to 72 percent in 2003. This brings about an increase in the number of households with agricultural land of less than 0.5 ha through out Indonesia from around 52 percent in 1993 to become 53 percent in 2003, which is equivalent to approximately 13.3 million agricultural households.
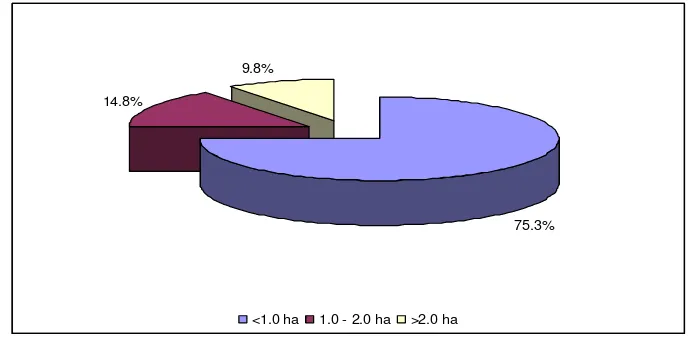
According to the 2003 agricultural census, through out Indonesia, around 75 percent of agricultural households own and operate their farms of the size of less than a hectare (Figure 4). That with the size of 1.0-2.0 ha consists of approximately 15 percent, and above that is around 10 percent only. With most of the agricultural land ownership below 1.0 ha (and around 53 percent is below 0.5 ha), it is quite difficult for farmers to attain the economic scale for a typical agricultural product, unless the farming activities are functionally consolidated. This would require appropriate institutional development, including of extension services, which have tended to decline since the implementation of the regional autonomy policy. Alternatively, economic viability of the small farms could be improved by increasing commercial orientation of the farms, strengthening vertical integration between farms and agricultural processing entities, and pushing up the quality and security standards of the products (FAO, 2006).
75.3% 14.8%
9.8%
<1.0 ha 1.0 - 2.0 ha >2.0 ha
Source: BPS (processed)
Figure 4. Distribution of Agricultural Households by Sizes of Agricultural Land Ownership in Indonesia, 2003
Food Security
With the high rate of unemployment and quite persistent poverty recently, food security is still an important concern of Government of Indonesia.10 The threat to food security can be seen among others from the incidence of malnutrition experienced by children below 5 years old. Actually the number of below 5 year old children with lacking and bad nutrition had tended to decrease from almost 8 million children in 1989 (which is 4.5 percent of the national population) to 4.4 million children in 2000 (i.e. 2.2 percent of the national population). Since then, however, the incidence has started to increase, reaching approximately 5.1 million children in 2004 or around 2.4 percent of the national population (Table 7).
Table 7. Malnutrition in Indonesia, 1989-2004
Year National
Population (000)
Below 5 YO Child with Lacking and Bad Nutrition
(000)
Below 5 YO Child with Bad Nutrition
(000)
1989 177,615 7,986 1,325
1992 185,323 7,910 1,608
1995 95,861 6,804 2,491
1998 206,398 6,091 2,169
1999 209,911 5,257 1,617
2000 203,456 4,415 1,348
2001 206,070 4,733 1,142
2002 208,749 5,014 1,470
2004 211,568 5,120 1,529
Source: BPS and Ministry of Health.
Severe poverty and lacking access to food are determinant factors causing this increased malnutrition. Another important factor is availability of food, especially the staple food (rice). Domestic availability, as depicted by production, has tended to be leveling off. It can be seen in Table 8 that although paddy production increased from around 29.7 million ton in 1980 to about 45.2 million ton in 1990 and to 54.7 million ton in 2006, growths of such production has decreased. During 1980s the growth was around 4.7 percent, and constantly declined to approximately 1.4 percent and 1.1 percent p.a. during 1990s and 2000s respectively. Since the recent population growth is expected to be around 1.3 percent p.a. paddy production growth of 1.1 percent p.a. seems to be inadequate.
10According to the World Food Summit Plan of Action in Rome 1996, ‘food security
Although it is possible to fulfill the gap through imports, recently it is politically less preferred to than food production enhancement. Official import of rice, which is considered by the government as a strategic agricultural product, has tended to decrease from around 6.0 million ton in 1998 to around 0.7 million ton in 2003 and to less than 0.5 million in 2006. This trend also occurs in imports of the other three strategic agricultural products (i.e. maize, sugar, and soybean) as presented in Appendix 2.
Table 8. Paddy Production, Area and Yield in Indonesia, 1980–2006
Year Production
(Million Ton)
Harvested Area (Million Ha)
Yield (Ton/Ha)
1980 29.65 9.01 3.29
1985 39.03 9.90 3.94
1990 45.18 10.48 0.39
1995 49.74 11.44 0.28
2000 51.90 11.79 4.40
2001 50.46 11.49 4.39
2002 51.49 11.52 4.47
2003 52.14 11.49 4.54
2004 54.09 11.92 4.54
2005 54.15 11.84 4.57
2006 54.66 11.85 4.61
Gr. 1980s p.a. 4.72% 1.80% 2.89%
Gr. 1990s p.a. 1.36% 1.35% 0.03%
Gr. 2000s p.a. 1.05% -0.11% 1.17%
Source: Ministry of Agriculture (Processed).
The decreased growth of paddy production relates to the agricultural land conversion particularly in Java because this island on average contributes to around 58 percent of national paddy production. But not only in Java, as presented in Table 8, at the national level growth of paddy harvested area is negative, i.e. around -0.11 percent p.a. during the 2000s. Representing technological progress, growth rates of the paddy yield are also quite small, especially during the 1990s which had been almost stagnant. In order to improve (staple) food security, therefore efforts are needed to increase the yield and to at least maintain the area.
BULOG. It is therefore important to oblige district/city governments to be more responsible to improve food security in their areas.
Land Degradation, Threats to Water Sustainability and to Energy Security
Based on population censuses 1990 and 2000, it is predicted that population growth for few years to come is around 1.3 percent p.a. with the population in 2006 around 220 million. With this large population, there is huge pressure on land both for agricultural and non-agricultural purposes. On the other hand, there was also issue on suboptimal practices of sustainable forest management in last decades. All of these led to deforestation. In three major islands of Indonesia alone, percentage of forest area to total land area had reduced from around 74.6 percent in 1985 to about 54.3 percent in 1997. As can be seen in Table 9, the deforestation rate is 2.26 percent p.a. or equivalent to approximately 1.7 million ha per year.
Table 9. Deforestation in Major Islands of Indonesia, 1985 and 1997
Major Islands
RePPProt Data (1985) Dephutbun (1997) Deforestation Land
Such a large deforestation ignites global climate changes, floods during rainy seasons, lacking of water during dry seasons, and other indirect effects. In turns, this negatively affects quality of river flowing areas, leading to decreases the efficiency of irrigation system which has already faced lack of maintenance threats during this early stage of the regional autonomy. Combination of this and the decreased agricultural land (Table 8) puts quite strong pressure on national capacity of food production and hence on national food security.
areas. On the other hand, demand for (sales of) PLN electricity has grown with a rate of around 6.3 percent p.a., exceeding its own electricity production growth rate of around 3.9 percent per year. The fast increase in the electricity consumption, as can be seen from Table 10, is less likely due to increases in the number of customers but more to per customer consumption which has grown at the rate of around 5.7 percent per year. In order to anticipate this trend, diversification of sources of electricity production seems to be an important policy ahead.
Table 10. Consumption and Production of Electricity in Indonesia, 2000-2005
Year
Source: Ministry of Energy and Mineral Resources (Processed).
AGRICULTURAL AND RURAL DEVELOPMENT POLICIES
In the Ministry of Agriculture’s document of Agricultural Development Plan 2005-2009, it is stated that objectives of such development during the time period are to:
- improve professionalism of the ministry’s human resources, skill of the
farmers, and roles of agricultural institutions,
- optimize utilization of agricultural resources in a sustainable manner,
- strengthen food security and safety,
- increase competitiveness and added values of agricultural products,
- promote agricultural activities which may induce rural economy to grow faster, and
Such objectives are meant to achieve the goals as follows: (a) improving national food security, especially by increasing production capacity of agricultural products and decreasing food imports dependency to around 5 to 10 percent of domestic production, (b) increasing competitiveness and added values of agricultural products, particularly by increasing quality of primary agricultural commodities, diversification of agricultural processing activities, and improving agricultural trade balance, and (c) improving farmers’ welfare by increasing their productivity and decreasing rural poverty incidence.
More than two years have passed, yet, as shown by a number of aforementioned indicators in the previous section, some of the related indicators indicate that problems are still there and challenges quite heavy. For years to come, the following policy arrays therefore seem to be crucial to consider with.
Agricultural and Rural Infrastructure Development
Development of agricultural infrastructure, particularly irrigation, is a necessary condition to improve agricultural productivity and production. Equally important is to develop and improve district and rural transportation infrastructure, including roads and ports. Considering high concentration of agricultural and related industrial activities in Java, it is timely to devote more efforts to develop at least these infrastructure items in outer islands. Unless these items are made available by the government, it is very hard to expect the private sector—even of the local ones—to invest in commercial agricultural products and/or their processing industries in these islands. Future efforts to increase the integration of agricultural product markets in Indonesia with the international market would not be smooth, unless ‘integration’ between national and domestic markets, particularly in the most-potential-yet-underdeveloped areas of outer Java, has been firstly improved.
Increasing involvement and responsibility (i.e. obligation) of local governments to undertake such development and maintenance seems to be very important. In the Water Resource Act, actually such an obligation of the local government is already mentioned. The crucial thing remains to put constructive pressure on local governments so as to implement the obligation effectively. Constant pressure and monitoring from civil society during planning and development phases of the infrastructure would be important to achieve such effectiveness.
Institutional Development
There are a number of institutional aspects to be exposed in this section;11 the first of which is of extension service. The Act on agricultural extension service has recently been enacted. Ministry of agriculture and local governments are obliged to provide the service to the farmers. Such extension services, however,
should be delivered in accordance to the farmers’ needs, i.e. local specific. The
main content of such extension, moreover, should be more on empowering the farmers instead of merely teaching them the technical know how. This should include facilitating links between farmers to private sector, so as to be able to establish contract farming. In order to widen possibility of such establishment, the extension service institution needs be urged to constantly expand their professional network.
Tax incentives are important to induce business links between private (agricultural product processing) sector and groups of farmers or farmers’ cooperatives. Some efforts have been made by the civil society and academia through the parliament to incorporate such tax incentives in the draft Act on taxes policy. The incentives are also proposed for government as well as private sector conducting research and development (R&D) on improving agricultural technology, and for farmers creating added value to their commodities. Under the current tax system, however simple, processed agricultural products are mostly subject to value added tax, making some farmers preferred to sell their commodity unprocessed.
Increasing farmers’ access to financial sources is also crucial. In 2006, outstanding credit position of agricultural activities was around Rp 45.0 trillion or equivalent to only around 6 percent of total outstanding credit position. This percentage is lower than that in 2000 which was around 7 percent (Appendix 3). For small business credit, however, realization of such kind of credit for agricultural activities increased from around Rp 9.3 trillion in 2000 to about Rp 20.3 trillion in 2006. In terms of percentage to total small business credit, these are equivalent to 16 percent and 19 percent respectively. This is a good trend. However, the percentage of outstanding credit position of agriculture to the total outstanding credit position, which is only 6 percent, can be categorized small, considering agriculture share to GDP is still 13 percent in the same year (2006). This suggests that there is still potential to provide credits for the sector. As main constraint for farmers to access such formal credit is no collateral, the current program of free or subsidized land certification for the needy should be continued.
Another existing program which seems to be important to continue is credit guarantee scheme. Ministry of agriculture provides fund for guaranteeing
credits for micro financial (non-banking) institutions as well as for small scale farming groups in agricultural centers of production. In this scheme, the farmers are facilitated with ‘accompanying officers’ responsible to empower the farmers.
Agricultural Productivity Enhancement
It was mentioned in the previous section that agricultural especially Indonesian paddy yield has been growing with relatively slower rate.12 On the other hand, expansion of agricultural land, particularly in more crowded islands of Java, Sumatera, and Sulawesi seems to be difficult or expensive. Enhancing land and labor productivity can therefore be an important policy option. Improving uses of quality inputs, especially seeds and fertilizers, have to be conducted.
In attempts to increases the uses of quality inputs, the government subsidy is increased from around Rp 6.3 trillion in 2006 to Rp 6.6 trillion in 2006 (Table 11). Some of the subsidy is allocated to fertilizer production. Although the number is increased, in terms of percentage to the state budget, this is actually a decrease from 2.4 percent to 1.8 percent. In terms of percentage to total subsidy—mainly poured to poverty reduction programs—this is also a decrease, i.e. from 22.6 percent to 21.6 percent. The problem with the fertilizer subsidy is that it is given to fertilizer companies in terms of subsidized price of natural gas which is an important input cost wisely. Thus some of subsidized fertilizers were enjoyed by non farmers or traded illegally.
Table 11. Agricultural Subsidy and State Budget, 2001-2006
Year
Source: Ministry of Finance (Various Years).
If it were to be provided, the subsidy should be given to farmers in a more direct manner. But considering the wide area of the country, illegal activities following the subsidy would still exist. Thus it is more appropriate to use the budget to undertake R&D, in order to produce more location specific high yielding varieties and cultivation techniques. This is now more possible to do because there are R&D offices of ministry of agriculture in more districts. Supporting local SMEs producing organic fertilizers to improve quantity and quality of their organic fertilizers, which are substantially cheaper than inorganic ones, is also important to fulfill farmers’ demand for fertilizers.
As rural wages have tended to increase, at least nominally, the uses of proper agricultural machineries should be promoted. The number of losses during harvest is still quite high (around 3 to 5 percent). Promoting harvesting machineries as well as those for land processing and post harvest activities is still considered important to do. Again, R&D activities as well as the local R&D offices may play important role on this.
Improvement of Food Security and Safety
Food security improvement should consist of enhancement in a number of elements including in food availability, food distribution system, and purchasing power or income of the consumers. With regard to main responsibility of ministry of agriculture, the focus should be on increasing food availability. This requires increases in, as well as diversification of, food crop productions. Opening new agricultural land especially in off Java and improving yield of food crops should be conducted accordingly.13 Another important program is setting and applying quality and safety standards of food products.
The food availability should be applied at regional, local, and household levels with an efficient distribution system. Insofar, for the poorest of the poor, government through BULOG (public company for food logistic affairs) still provides ‘rice for the poor’ amounting to 20 kg per household at Rp 1000 per kg which is around 40 percent of the market price of the third grade rice. The management of this food distribution system should however be improved, so as to be able to reach the poorest poor accurately, timely, and with minimum ‘leakages’. Another item that should be improved is the early warning system that must be very good in receiving signals on threats to food security and safety, especially in prone areas.
Under the BULOG current format, recent years experience has shown that during dry seasons the institution is always lacking in stock, and hence as the sole rice importer, it imports the commodity. During the harvest seasons, it is unable to
buy farmers’ rice adequately. BULOG can only purchase and stock a maximum of
around 7 percent of the total rice consumption. The actual stock held by this institution is normally considerably less than that figure, rendering relative ineffectiveness of such institution in maintaining rice price stability. Therefore, widening entrance for traders to import rice, particularly during dry seasons, is an important policy option for the government, if the domestic rice productive capacity has not yet been improved significantly.
With regard to the third element of food security (purchasing power of consumers), macro policy of fostering the economic growth that occurs in all income groups is a must. In order for the food security and economic growth to have positive correlation, Timmer (2004a) argues that governance, especially in designing the appropriate public policy, plays an important role.14 For current condition, whereby poverty and unemployment are relatively high, government should undertake labor intensive projects, i.e. developing and/or maintaining rural infrastructure by recruiting considerable number of farmers or rural people whose are paid wages at market level. This is considered better than the ‘cash direct
subsidy’ to the poor of Rp 100 thousand a month, which becomes a disincentive
for the poor to help themselves out of the poverty trap. With the labor intensive project, purchasing power of these people would immediately rise, enabling them to buy food sufficiently, in a more sustainable manner. This would reduce, at least temporarily, unemployment and rural poverty as well and at the same time improve the condition of rural social-economic and physical infrastructures.15
EPILOGUE
The current government of Indonesia places agricultural development as one of its priorities. But exogenous shocks to the economy, especially significant increases in oil prices and series of natural disasters have disturbed development of agricultural and other sectors. Nevertheless, efforts should be accelerated to reduce poverty (and unemployment) and to strengthen food security. In order to gain maximum impacts, such efforts must be comprehensive and well connected one to each other, so as to avoid unnecessary weighting-off amongst the impacts.
14 Furthermore, long run determinant of sustained food security, according to Timmer (2004b), is pro-poor economic growth.
Currently, the government is preparing for agrarian reform, which is defined as land reform plus access reform (Winoto, 2006). Agricultural land is to be expanded through the state’s land, including ex estate plantation or logging company areas, concessions of which are already finished, and bare land belongs to the government. These will be the objects of the land reform. The access reform is to open access of farmers and rural dwellers to quality agricultural inputs, financial or credit market, proper technology, output markets, as well as institutions responsible for improving quality of rural human resources such as schools and rural health services/hospitals.
As the format of the agrarian reform, which is planned for more than 8 million hectares, would be inter-departments, it is again important to closely look at, and avoid, potential problems arising from lack of coordination. Also, the scheme should be utilized to overcome a limited number of problems, focusing on poverty and unemployment alleviation as well as on food security improvement. With regard to the poverty and unemployment reduction, this should be integrated with the bio-energy development plan. An important factor worth mentioning is that the focus of bio-energy development should be on increasing wealth of the farmers. The land should therefore be for the farmers, on which they cultivate the high value crops (oil palm, jatropha, sugarcane, and cassava); and the private sector is welcome to run their businesses on processing these crops to become the bio-energy. In conjunction to food security improvement, this should be achieved by increasing food crops production in an environmentally friendly manner. And most importantly, the bio-energy development must not jeopardize food security.
REFERENCES
Adimihardja, A. 2006. “Strategi Mempertahankan Multifungsi Pertanian di Indonesia”, Jurnal Litbang Pertanian, 25(3).
Agus, F. and Irawan. 2006. “Agricultural Land Conversion as a Threat to Food Security and Environmental Quality”, Jurnal Litbang Pertanian, 25(3).
Departemen Pertanian. 2005. Rencana Pembangunan Pertanian Tahun 2005-2009. Departemen Pertanian Republik Indonesia, Jakarta.
FAO. 2006. Rapid Growth of Selected Asian Economies: Lessons and Implications for Agriculture and Food Security, Synthesis Report. RAP Publication 2006/04. FAO, Regional Office for Asia and the Pacific, Bangkok.
Hayami, Y. 2000. “An Ecological and Historical Perspective on Agricultural Development in Southeast Asia”, Policy Research Working Paper 2296. Development Research Group (Rural Development), World Bank, Washington, D.C.
Rodrik, D., A. Subramanian, and F. Trebbi. 2002. Institutions Rule: The Primacy of Institutions over Geography and Integration in Economic Development. CID Working Paper No. 97, Harvard University.
Simatupang, P., D.K.S. Sadra, M. Syukur, E. Basuno, S. Mardianto, K. Kariyasa, and M. Maulana, 2004. Analisis Kebijaksanaan Pembangunan Pertanian: Respon terhadap Isu Aktual (Analysis on Agricultural Development Policies: Responses on Actual Issues). P3SEP, Badan Penelitian dan Pengembangan Pertanian, Departemen Pertanian, Jakarta.
Stamoulis, K. and A. Zezza. 2003. “A Conceptual Framework for National Agricultural, Rural Development, and Food Security Strategies and Policies”, ESA Working Paper No. 03-17, Agricultural and Development Economics Division, FAO, Rome.
Timmer, C.P. 2004a. “Food Security and Economic Growth: An Asian Perspective”, Working Paper Number 51, Center for Global Development.
Timmer, C.P. 2004b. “Food Security in Indonesia: Current Challenges and the Long-Run Outlook”, Working Paper Number 48, Center for Global Development.
Winoto, J. 2005. “Kebijakan Pengendalian Alih Fungsi Tanah Pertanian dan Implementasinya (Policy for Controlling Agricultural Land Conversion and Its Implementation)”, Paper Presented in One Day Seminar on Solving for Agricultural Land Conversion and towards Establishment of Perpetual Agricultural Land, Ministry of Public Work, Jakarta.
Winoto, J. 2006. “DeSoto dan Ekonomi Politik Pembangunan Kita (DeSoto and Our Development Political Economy)”, Tempo, September.
Appendix 1. GDP and GDP Growth of Agricultural and Manufacturing Sectors
GDP (Bn. Rupiah, Year 2000
Constant Price) 2000 2001 2002 2003 2004* 2005**
Agriculture, Livestock, Forestry &
Fisheries
Farm Food Crops 112,356 112,580 114,982 119,165 122,612 125,758
0.20 2.13 3.64 2.89 2.57
Non-food Crops 32,491 35,033 37,073 38,694 39,548 40,430
7.82 5.83 4.37 2.21 2.23
Livestock & Products 25,231 27,629 29,431 30,647 31,673 32,581
9.51 6.52 4.13 3.35 2.87
- Petroleum & Gas: Liquified Natural Gas
- Food, Beverage & Tobacco 112,063 113,257 113,475 116,529 118,149 121,378
1.07 0.19 2.69 1.39 2.73
-Textile, Leather Products & Footwear 45,422 46,966 48,485 51,484 53,576 54,263
3.40 3.23 6.18 4.06 1.28
-Wood & Wood Products 20,275 20,384 20,510 20,754 20,326 20,053
0.54 0.62 1.19 -2.07 -1.34
-Paper & Printing 19,998 19,043 20,045 21,731 23,384 23,958
-4.78 5.26 8.41 7.61 2.45
-Fertilizers, Chemicals & Rubber 42,919 43,133 45,171 50,009 54,514 59,365
0.50 4.73 10.71 9.01 8.90
-Cement & Non-metallic Mineral 10,112 12,041 12,831 13,736 15,045 15,620
Appendix 2. Productions and Imports of Three Strategic Agricultural Products of Indonesia, 1990-2005
Year
Maize Sugar Soybean
Production Imports Production Imports Production Imports
1990 6,734,028 77,160 2,075,000 304,000 1,487,433 513,090
1991 6,255,906 399,260 2,215,000 330,000 1,555,453 643,420
1992 7,995,459 127,980 2,300,000 355,000 1,869,713 659,100
1993 6,459,737 580,930 2,483,000 239,000 1,708,528 690,690
1994 6,868,885 1,231,460 2,454,000 120,000 1,564,847 751,920
1995 8,245,902 1,151,490 2,098,000 574,000 1,680,007 583,100
1996 9,307,423 762,720 2,100,000 850,000 1,517,181 756,900
1997 8,770,851 1,283,690 n.a. n.a. 1,356,891 787,190
1998 10,169,488 551,440 1,492,000 1,702,000 1,305,640 469,530
1999 9,204,036 996,770 1,690,000 1,949,000 1,382,848 1,282,720
2000 9,676,899 1,575,690 1,800,000 1,591,000 1,017,634 1,285,920
2001 9,347,192 1,332,250 1,725,000 1,500,000 826,932 1,140,450
2002 9,585,277 1,427,210 1,755,000 1,600,000 673,056 1,374,510
2003 10,886,442 1,553,320 1,730,000 1,500,000 671,600 1,194,570
2004 11,225,243 1,283,300 2,050,000 1,450,000 723,483 1,157,050
2005 12,523,894 396,500 2,100,000 1,800,000 808,353 1,312,690
Gr. 1990s p.a. 4.6% 96.4% -10.5% 34.3% -0.3% 20.6%
Gr. 2000s p.a. 5.4% -4.6% 3.9% -0.5% -7.4% 1.1% Sources:
Appendix 3. Agricultural Credit Amounts and Shares to Total Credit in Indonesia
Items 2000 2001 2002 2003 2004 2005 2006
1. Small Business Credit (Rupiah)
- Agriculture (Rp Billion) 9,271 10,135 11,071 13,949 18,509 17,907 20,108 - Total (Rp Billion) 55,841 61,159 60,837 72,647 85,191 96,580 102,028 - Percentage of Agriculture to Total 16.6 16.6 18.2 19.2 21.7 18.5 19.7
2. Small Business Credit (Rupiah &
Forex)
- Agriculture (Rp Billion) 9,275 10,135 11,072 13,949 18,509 17,907 20,326 - Total (Rp Billion) 56,625 62,569 62,266 73,968 93,615 106,051 109,666 - Percentage of Agriculture to Total 16.4 16.2 17.8 18.9 19.8 16.9 18.5
3. Operating Capital Credit (Rupiah)
- Agriculture (Rp Billion) 6,344 7,170 9,105 10,405 15,619 16,769 19,309 - Total (Rp Billion) 84,776 107,113 142,934 172,604 214,196 269,395 309,611 - Percentage of Agriculture to Total 7.5 6.7 6.4 6.0 7.3 6.2 6.2
4. Operating Capital Credit (Rupiah &
Forex)
- Agriculture (Rp Billion) 8,694 8,749 10,336 11,702 18,889 21,014 25,804 - Total (Rp Billion) 163,630 175,692 202,680 231,564 285,737 350,818 412,493 - Percentage of Agriculture to Total 5.3 5.0 5.1 5.1 6.6 6.0 6.3
5. Investment Credit (Rupiah)
- Agriculture (Rp Billion) 8,684 9,682 10,016 10,354 10,984 12,668 15,622 - Total (Rp Billion) 28,897 38,056 49,954 59,820 75,209 91,702 104,630 - Percentage of Agriculture to Total 30.1 25.4 20.1 17.3 14.6 13.8 14.9
6. Investment Credit (Rupiah &
Forex)
- Agriculture (Rp Billion) 10,810 12,115 11,996 12,604 13,488 15,663 19,199 - Total (Rp Billion) 65,276 73,466 82,924 94,316 116,864 132,463 148,871 - Percentage of Agriculture to Total 16.6 16.5 14.5 13.4 11.5 11.8 12.9
7. Outstanding Credit Position
(Rupiah)
- Agriculture (Rp Billion) 15,028 16,851 19,121 20,760 26,604 29,438 34,931 - Total (Rp Billion) 152,482 202,618 271,851 342,026 438,880 566,444 639,152 - Percentage of Agriculture to Total 9.9 8.3 7.0 6.1 6.1 5.2 5.5
8. Outstanding Credit Position
(Rupiah &Forex)
