KEY PERFORMANCE INDICATORS FOR INDONESIA’S SMALL
HOLDER DAIRY FARMERS
JOHN MORAN
Department of Primary Industries Victoria, 120 Cooma Rd., Kyabram, Victoria, 3620 Australia
(Makalah diterima 4 Januari 2008 – Revisi 26 Juni 2008)
ABSTRACT
This paper presents a series of Key Performance Indicators to help Indonesian farmers identify the possible causes for their poor farm performance and profitability. When assessing farm profitability, these indicators can be split into two types, those diagnosing problems with feeding management and those with herd management. Too many stock on limited land is a common feature on Asian dairy small holdings. Unlike other forms of livestock, milking cows have very high nutrient requirements, therefore high quality forages and purchased concentrates are essential for profitable dairying. Milk income less feed cost is one of the simplest and easy to measure indicators of farm profitability and the quickest to respond to small changes in farm practices. Problems with herd management can be diagnosed using measures such as the proportion of cows actually milking in the herd or their peak yield and persistency of production. There are also simple indicators of herd reproductive performance and of health and growth of young stock that assist in searching for the underlying causes of poor farm profitability.
Key words: Key performance indicator, dairy farmer, small holder, Indonesian
ABSTRAK
INDIKATOR PERFORMANS YANG PENTING UNTUK PETERNAK KECIL SAPI PERAH DI INDONESIA
Makalah ini menguraikan tentang indikator performans peternakan (Key Performance Indicator) agar dapat menolong peternak-peternak Indonesia mengidentifikasi faktor-faktor yang mungkin menyebabkan rendahnya performans ternak dan keuntungan peternak. Ketika mengkaji keuntungan peternak, petunjuk-petunjuk ini dapat dibagi menjadi 2 tipe, yaitu yang pertama adalah petunjuk yang mendiagnosis masalah-masalah yang berhubungan dengan manajemen pemberian pakan dan yang kedua adalah yang berhubungan dengan manajemen pemeliharaan ternak. Terlalu banyak ternak yang dipelihara pada lahan yang terbatas merupakan permasalahan yang umum pada peternakan sapi perah skala kecil di Asia. Tidak seperti ternak lain, sapi perah membutuhkan nutrien yang sangat tinggi. Oleh sebab itu hijauan dan konsentrat yang berkualitas tinggi merupakan hal yang esensial agar usaha ini menguntungkan. Pendapatan susu dikurangi dengan harga pakan merupakan cara yang paling sederhana dan mudah untuk mengukur indikator keuntungan sebuah peternakan sapi perah dan cara yang tercepat untuk merespon perubahan-perubahan kecil yang dilakukan di dalam peternakan. Masalah dengan manajemen pemeliharaan ternak dapat didiagnosis dengan indikator seperti proporsi sapi yang benar-benar laktasi terhadap total sapi atau puncak dan persistensi produksi susu. Ada petunjuk-petunjuk yang sederhana untuk melihat performans reproduksi ternak, kesehatan dan pertumbuhan ternak muda untuk mencari penyebab rendahnya keuntungan sebuah peternakan sapi perah.
Kata kunci: Indikator performans, peternakan sapi perah, skala kecil, Indonesia
INTRODUCTION
Throughout the tropics, small holder dairy farming was established as part of social welfare and rural development schemes, to provide a regular cash flow for poorly resourced and often landless farmers (FAO, 2004). Now it is an established industry and requires a more business-minded approach to farm management.
Although most Indonesian dairy farmers intuitively think about farm costs and returns, greater use could be made of formats allowing them to be more aware of the relative importance of all their financial inputs in terms of cost of production per kg of milk produced on the
Knowing their cost of production allows small holder farmers to determine their profit margins and this is critical to operating a sustainable dairy enterprise. Farmers must do more and better planning if they are to achieve greater profits. Profits are not something they end up with at the end of the year. Rather, they are something farmers must plan for.
approach may simply encourage farmers to look more critically at their cost structures. Expressed simply, this is a diagnostic tool to help identify production weaknesses adversely affecting financial performance.
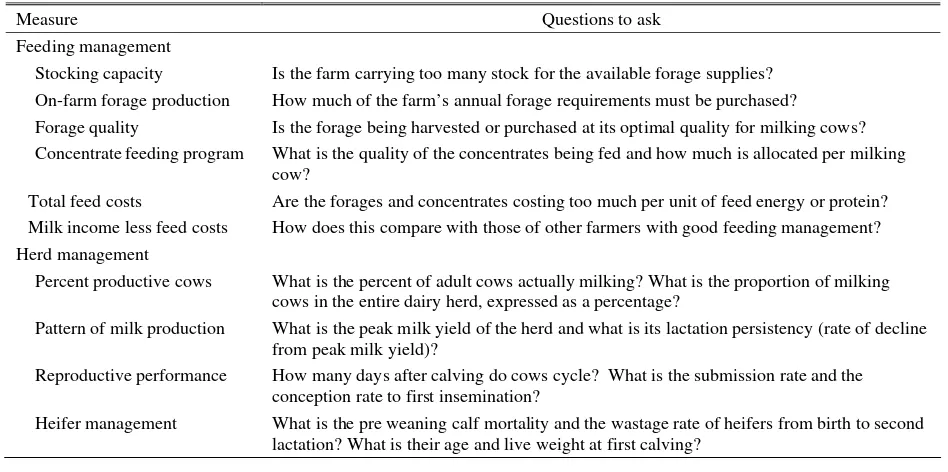
The following ten series of questions should be asked on any farm, big or small. Because more than half of farm costs are feed related, the first six questions are directly related to feeding management. Even though the remaining four are more related to overall herd management, they are still very much feed dependent. For some of the questions, specific indicators relevant to particular farming systems can be developed. However, for others, there is no single indicator that farmers can work towards because the most correct answer is the higher the better for some (such as on farm forage production or forage quality) or the lower the better for others (such as total feed costs or calf mortality and heifer wastage rates). These indicators are presented as ranges rather than a single value emphasising the fact that they are only guidelines. These ten key measures or symptoms of poor farm performance for which diagnoses should be considered are presented in Table 1.
FEED RELATED KEY FACTORS INFLUENCING FARM PROFITABILITY
Stocking capacity
Forages always provide a cheaper source of the key feed nutrients (energy and protein) than do concentrates. It is usually cheaper to grow these forages
on the farm rather than purchase them. It is easier to control forage quality on farm, through fertiliser and harvest interval, than with purchased forages. When relying on off farm forage supplies, farmers depend on what is available, either from traders who harvest the roadsides, paddy fields, tree plantations or forests or from other farmers who sell their excess supplies, either as crop byproducts (such as rice straw or corn stover) or forage crops specifically grown for sale.
In MORAN (2005), a series of assumptions and calculations of optimum stocking capacities for small holder dairy farmers with different level of forage management was listed. Calculations were made for farmers who run replacement heifers on the same farm as their milking herd and for farmers that have them reared off farm. The calculations also included three levels of forage management, namely poor, average and good, to produce 10, 20 and 30 tonnes forage DM/ha/year respectively. Table 2 presents the range of optimum stocking capacities.
For a farmer growing the maximum quantities of quality forages, to feed his milking cows well, he should have no more than 8 to 10 milking cows per hectare of forage grown on his farm. However, most dairy small holders do not manage their forages well enough to produce the highest yields of forage. Therefore, a more realistic recommendation would be 6 to 8 milking cows (plus the replacement heifers) per hectare of forage grown on farm.
Unfortunately, most small holder dairy farmers like to keep more cows than this recommendation, meaning they must either have to purchase forages off
Table 1. Ten key measures of small holder dairy farm performance
Measure Questions to ask
Feeding management
Stocking capacity Is the farm carrying too many stock for the available forage supplies? On-farm forage production How much of the farm’s annual forage requirements must be purchased?
Forage quality Is the forage being harvested or purchased at its optimal quality for milking cows? Concentrate feeding program What is the quality of the concentrates being fed and how much is allocated per milking
cow?
Total feed costs Are the forages and concentrates costing too much per unit of feed energy or protein? Milk income less feed costs How does this compare with those of other farmers with good feeding management? Herd management
Percent productive cows What is the percent of adult cows actually milking? What is the proportion of milking cows in the entire dairy herd, expressed as a percentage?
Pattern of milk production What is the peak milk yield of the herd and what is its lactation persistency (rate of decline from peak milk yield)?
Reproductive performance How many days after calving do cows cycle? What is the submission rate and the conception rate to first insemination?
farm, underfed their milking cows (and heifers) with less forage, or if they aim to produce high yields of milk (say more than 12 to 14 kg/day), feed excessive levels of concentrates to each milking cow. This is a more expensive way to produce milk, and frequently leads to digestive problems, such as sub clinical acidosis. Not only will this reduce feed efficiency, it will increase the cost of production and reduce farm returns. Therefore, as all good businessmen aim to produce at the optimum level to maximise efficiencies and profits. Don’t put too many cows onto your farm if you cannot feed and manage them properly.
Table 2. Optimum stocking capacities for small holder dairy farms with different levels of forage management
Quality of forage management Forage yield
Poor Average Good
t DM/ha/year
One milking unit is one adult cow plus 20% of a replacement heifer
Assumed forage intakes:
7.5 kg DM/day for 275 day/year for milking cows 4.5 kg DM/day for 90 day/year for dry cows
3.0 kg DM/day for 365 day/year for 20% of a replacement heifer
Source: MORAN (2005)
On farm forage production
As it is cheaper to grow quality forages on farm, the less purchased, the cheaper the feed bill. With well planned dairy production systems, it should be possible to supply 95 to 100% of the forages from on farm supplies. Strategic purchases of small quantities of very cheap, lower quality forages (such as rice straw) for stock with lower daily nutrient requirements, such as dry cows, may still be a good management decision.
The biggest problem with on farm forage supplies is to produce them twelve months of the year. As forage growth rates are markedly reduced during periods of low rainfall or low temperatures, the challenge for a good feed manager is to match stock requirements with forage supplies. In seasonal calving areas of southern Australia, farmers manipulate calving patterns to ensure most cows calve during the spring flush of pasture growth and dry off during winter. Their low cost production systems allowed this to be economic. This is not the case in Vietnam where
a regular cash flow (MORAN and TRANTER, 2004). Conserving forages through silages and hays during periods of peak forage growth is the best way to overcome seasonal forage supplies. Hay making requires many more days of dry weather than silage making and this is rare during wet seasons when excess forage supplies are more likely. Making silage from forage crops or quality crop byproducts (such as legume tree leaves, corn stover or other cash crop residues) can augment supplies of other conserved wet season forages (KAISER and PILTZ, 2002).
Forage quality
To produce milk and calves, dairy cows require feed nutrients which are supplied through forages and concentrates. To produce acceptable milk yields, say 15 L/day, cows require a ration containing at least 10 MJ/kg DM of metabolisable energy (ME). The more of this supplied by forages, the less required by concentrates. For milking cows, the recommended forage quality would be 9.5 to10.0 MJ/kg DM of ME and 12 to 14% crude protein.
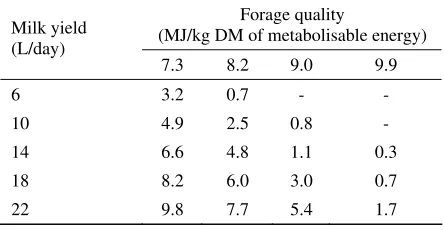
The higher the quality of the forage, the less concentrates necessary to achieve the desired milk yield (TAWEEL, 2006). DEVENDRA (1975) estimated the amount of concentrates required for target milk yields in 400 kg milking cows (non-pregnant with zero weight change) when fed ad lib forage of varying qualities (Table 3). He assumed the concentrate to be home mixed containing 12.2 MJ/kg DM of ME and 24% protein.
Table 3. Required concentrate intakes (kg DM/day) for cows fed forages of varying quality to achieve target milk yields
Forage quality
(MJ/kg DM of metabolisable energy) Milk yield
Source: DEVENDRA (1975)
Concentrate feeding program
protein should be considered as it may affect the performance and beneficial milk production of dairy cows (IPHARRAGUERRE andCLARK, 2005)
Many SE Asian dairy advisers use a general “rule of thumb” that farmers should feed 1 kg concentrate for every 2 L of milk produced. This is a safety measure because of the lack of knowledge on the nutritive value of the feeds, particularly the forages. It also provides supplemental energy to cows when fed only limited amounts of forage.
With knowledge of the feeding value of the forages and concentrates, and their costs, more objective hence better decisions, can be made on how much concentrates should be fed to achieve target milk yields. This requires more knowledge and greater effort than following the “feed 1 kg concentrate per 2 L milk” rule, but such decisions can greatly reduce feed costs hence improve profitability, when expressed as milk income less feed costs.
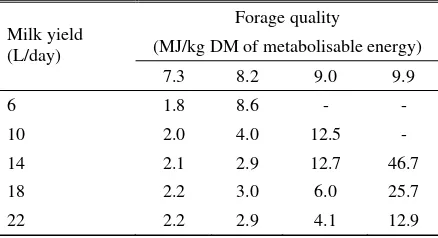
Table 3 listed the level of concentrates required to achieve target milk yields with varying forage qualities. These feeding decisions have been converted into milk: concentrate ratios in Table 4. When cows are fed better quality forages, more milk is produced per kg concentrate fed. The 1 : 2 (1 kg concentrate/2 L milk) rule is only applicable with very low quality forages, namely those with ME contents of 7 to 8 MJ/kg DM.
Table 4. Milk: concentrate ratios (L milk produced/kg concentrate fed) to achieve target milk yield in cows fed forages of varying quality
Forage quality
(MJ/kg DM of metabolisable energy) Milk yield
The choice of available feeds for milk production will differ from country to country as do their relative costs. The principle of formulating profitable rations is to compare different feeds firstly on the basis of their cost per unit energy because energy is nearly always the first limiting nutrient. When protein deficiencies limit cow performance, the unit cost of protein becomes important. The fibre content of each potential feed ingredient is considered just to make sure the
voluntary intake of the cow is not too restricted and she wont eat all that she is offered.
When formulating rations, either by computer or by calculator, so long as you are confident that the raw data (feed costs and nutritive values) are representative of that feed being fed to those cows, then traditional ration formulation calculations (such as those presented by MORAN, 2005) will provide a meaningful answer to any least cost ration. With experience, the process is less time consuming because “best bet” rations can be easily checked for their nutrient content and likely milk yield response.
Milk income less feed costs
Milk income less feed costs (MIFC) is one of the simplest indicators of farm profitability. In addition, changes in MIFC are quick to monitor because of the rapidity with which milking cows respond even to small variations in their feeding management. When introducing new feeds into the diet or varying their amount, the cows’ milk responses will reflect these changes within a few days as will their MIFC within a week or two. The development of generic indicators for total feed costs and MIFC depend greatly on the base costs of feeds in different dairy regions.
HERD RELATED KEY FACTORS INFLUENCING FARM PROFITABILITY
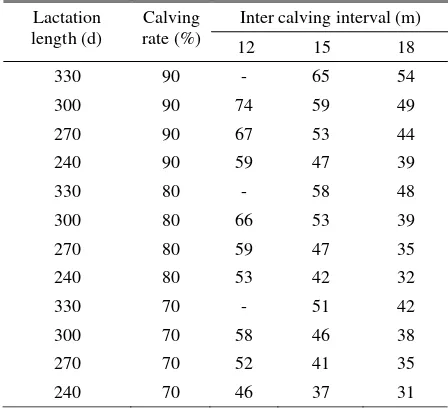
Proportion of cows milking of those that have calved
Table 5. Proportion (%) of cows and first calf heifers milking in the adult dairy herd as influenced by lactation length, inter calving interval and calving rate
Inter calving interval (m) Lactation
Cows milking as a proportion of the total dairy herd
Another useful measure of the proportion of productive cows is the size of the milking herd as a percent of the total dairy herd, which includes the milk fed and weaned replacement dairy heifers, breeding bulls (if any), dry cows and milking cows. As well as lactation length, inter calving interval and calving rate, other important factors are heifer wastage (a combination of pre-weaning calf mortality and losses between weaning and second calving), age at first calving, culling of cows for poor performance and mortalities among the milking herd.
Based on a model originally developed by WATTIAUX (1996), Table 6 presents the effects of some of the key factors, namely lactation length, calf and heifer mortality (up to 24 months of age) and age at first calving, on the % milking cows (and first calf heifers) in the total dairy herd. A series of assumptions had to be made on other key variables in this model, namely a lactation length of 300 d, calving rate of 90%, half of the calves born were heifers, 10% of these heifers were sold before calving and the annual culling rate for the milking herd was 35%.
The proportion of milking cows decreases with age of first calving because heifers spend a longer time as young stock prior to joining the milking herd. The proportion of milking cows increased with higher calf and heifer mortalities because there were fewer heifers. Longer inter calving intervals had the most dramatic effect on milking cow numbers. This table highlights the fact that at any one time, less than half the dairy herd (ranging from 31 to 48%) are generating income.
Table 6. Proportion (%) of cows and first calf heifers milking in the entire dairy herd as influenced by lactation length, inter calving interval and calving rate
Inter calving interval (m) Age at first
Pattern of milk production
The two major factors determining total lactation milk production are the peak lactation yield (within 6 to 8 weeks post calving) and its rate of decline from this peak (or lactation persistency). The persistency quantifies the average rate of decrease in yield (in % per month from peak yield) for each month after the peak. The higher this number, the faster the rate of decline hence the less milk produced. In Asia, lactation persistencies of less than 8% per month may be achievable on very well managed farms, but more realistic levels are 8 to 12% per month.
Over a 300 day lactation, a cow with a peak milk yield of 15 liter/day and an 8% persistency produces 9.9 liter/day average and a total of 2980 liter, while a 12% persistency would equate to 7.8 liter/day average and 2330 liter total. A cow peaking at 20 liter/day with an 8% persistency produces 13.2 liter/day and 3970 liter total, or with a 12% persistency, she would produce 10.4 liter/day and 3110 liter in total. A more productive cow, say with a 25 liter/day peak and 8% persistency, produces 16.6 liter/day average and 4960 liter in total, while a 12% persistency would produce 13.0 liter/day average and 3885 liter total. Such average and full lactation milk yields for the same peak and persistency will vary with lactation lengths. In summary, milk yields at any one time are the result of peak milk yield and persistency. If they are below expectations, it is important to diagnose the cause.
oestrus hence reduced fertility. Therefore, feeding management must be directed towards supplying adequate nutrients, particular energy, in early lactation to achieve high peak yields, and in mid lactation to maintain milk yields hence reduce persistency values.
Reproductive performance
For year-round calving herds, there are four useful measures of reproductive performance. These are:
• 100 day in calf rate. This calculates the percentage of the cows in the herd that become pregnant by 100 d after calving. It also describes how many cows will calve within about 13 months of their previous calving. High 100 day in calf rates mean fewer cows with long intervals between calving and fewer cows culled as empty. Cows that conceive within 100 d of calving will calve again within 12.5 months and generate higher profits than cows that take a longer time to conceive or fail to get pregnant. This measure usually allows for the voluntary waiting period (the days between calving and the first mating) of say 55 day plus two oestrus cycles of AI (approximately 42 day) before the cow is put out for natural mating.
• 200 day not in-calf rate. This calculates the percentage of cows not pregnant by 200 day after calving. Farmers want as many cows as possible to calve no more than 15 to 16 months after their previous calving. This coincides with six months after which non-pregnant cows are often culled. It cannot be calculated until many months after cows have calved, but because it is closely related to 100 day in calf rate, it can be estimated from that measure. It cannot be calculated unless the whole herd is pregnancy tested.
• Submission rate is the percentage of the herd which received at least one insemination within a specified number of days after calving. To achieve a high 100 day in calf rate, a high percentage of cows in the herd must be submitted to insemination with minimum delay after calving. An 80 day submission rate is the percentage of cows that receive at least one insemination by 80 day after calving.
• Conception rates are the number of services resulting in pregnancy divided by the total number of services. This describes the percentage of inseminations that are successful and result in pregnancy. This has always been considered an important measure of reproduction but it does not fully describe overall herd performance. Herds can have high conception rates but poor 100 day in calf and high 200 day not in calf rates. Sometimes the first insemination conception rate is calculated by
including only the first services after calving in the analyses.
For a small holder milking herd in Asia, target indicators are:
• 100 day in calf rate; 55 to 60%
• 200 day not in calf rate; 13 to 15%
• submission rate; 65 to 70%
• voluntary waiting period; 50 to 60 day
• conception rate to first insemination; 45 to 50%
• inseminations per conception in an AI program; 1.8 to 2.0
Better fed cows have higher fertility which can improve 100 day in calf rate from 41 to 57% and reduce 200 day not in calf rate from 15 to 9%.
These measures of reproductive performance are rarely used in Asia, because they require routine pregnancy testing of the entire herd. More typical ones are days from calving to first service and inter calving interval. Targets for these are for cows to be first mated 60 to 80 day post calving which should lead to 12 to 13 months inter-calving interval.
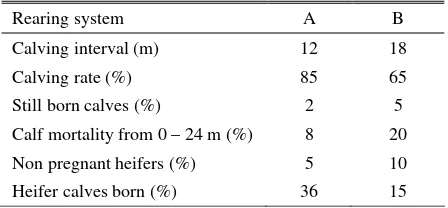
STOAS (1999) compared reproduction and calf survival in two rearing systems to calculate their relative replacement rates for a dairy herd with stable stock numbers (in Table 7). System A measures could be considered as a set of key indicators.
Table 7. Measures of reproduction and calf rearing to produce replacements for a stable dairy herd.
Rearing system A B
Assuming cows remain in the milking herd for 4 to 5 lactations, 20 to 25% should be replaced each year. The supply of 36% heifers from System A allows for the sale of young breeding stock or a higher culling rate to better address genetic improvements in the herd. Only one in every six or seven cows could be replaced annually in System B in Table 7, which would hardly be enough to maintain herd numbers, let alone allow for much genetic selection.
others, such as disease, heat stress or simply poor reproductive practices.
Heifer management
Poor heifer management is a major problem in many (if not most) Asian small holder dairy farms. Young stock receives insufficient attention because they do not generate income for many months. In addition, the first three months are the most expensive period in the life of any dairy cow and many farmers are just not prepared to invest in the calves’ future. A low calf mortality rate indicates that early milk rearing practices are adequate and allow for greater opportunity for economic and genetic improvement in the herd. When a heifer dies, there are fewer opportunities for culling unprofitable cows.
There are many hidden costs arising from poor management of the replacement dairy herd. The milking potential of small stunted animals that do not calve until three years of age has been markedly reduced, while very high mortality (death) and morbidity (sick) rates in calves during their milk feeding period represent an enormous waste of genetic potential in the dairy herd as well as cash outlay.
There are easily quantifiable benefits in having more newly calved heifers available to replace older unprofitable cows, as heifer and reproductive managements improve. These benefits are:
• 1 to 2% more first calf heifers for every month reduction in age at first calving
• 3 to 5% more first calf heifers for every 10% reduction in calf mortality
• 2 to 3% more first calf heifers for every month reduction in inter calving interval
Farmers should aim to rear 20 to 25% of their milking herd each year as replacements, to calve down for the first time by about two years of age and produce at least five calves during their productive life. Recommendations for tropical dairy systems are 4 to 6% calf mortality up to weaning and 20 to 25% heifer wastage rate from birth to second calving. Heifers should weigh 250 to 300 kg at mating and 400 to 500 kg (depending on breed type) at first calving which should be by 28 to 30 months of age. Another good indication of heifer management is first lactation milk yield, expressed as % of mature cow production, with a target of 80 to 85%. If this is less than 75% of the mature equivalent, then the heifer rearing program should be reviewed.
Wither height (or height at the shoulder) is a good measure of bone growth and potential body frame size in heifers. Frame size can influence ease of calving and appetite of milking cows. Farmers should aim for
wither heights of 115 to 120 cm by 15 months and 125 to 130 cm by 24 months of age.
CONCLUSIONS
The above diagnoses require the calculation of many indicators to allow a value judgement to be made on business performance. Many of these indicators are simply common ratios or proportions, assessing some level of output in relation to some levels of input. Others measure success simply with numbers or amounts, such as target forage quality or heifer live weight. Although they are valuable guides, there is no all encompassing or perfect indicator of business success. All indicators must be viewed within the whole business, with each one contributing only a part.
It is possible to achieve high performance in an indicator which does not translate into business financial success. If a farmer whose farm has very poor quality soils and may not be able to grow as good a quality forage as he can purchase, at a good price, close by, it would be more profitable to let someone else grow the bulk of his forages.
Low performance measures in some key factors, well below these indicators, often lead to high performance measures in other key factors which can produce a false sense of security about the ability to achieve some of the production targets. One example is low peak milk yield and short inter calving intervals in cows of low genetic merit. Because such cows are not ‘genetically programmed’ to use their body reserves to supplement the limited intakes of feed nutrients during early lactation, their live weight will hardly change and they may cycle soon after calving. If the farmer plans to improve the genetic merit of the cows by using imported cows or high grade semen without improving the feeding management during early lactation, peak milk yields may not greatly improve while herd fertility is likely to drastically fall.
The above list is an initial attempt to prioritise these indicators to develop a structured approach to addressing poor farm profitability. It must be stressed that no single indicator should be used in isolation to assess farm performance and hence profitability, as each one is the end result of interactions between many farm inputs. It is important to ensure there is a balance between their utilisation so that one production target is not achieved at the expense of others within the farming system.
REFERENCES
FAO. 2004. Guide to good dairy farming practice. Food and Agriculture Organization, Rome, Italy.
IPHARRAGUERRE, I.R. and J.H. CLARK. 2005. Impact of the source and amount of crude protein on the intestinal supply of nitrogen fractions and performance of dairy cows. J. Dairy Sci. 88 (E suppl.): E22-E37.
KAISER, A.G..and J.W. PILTZ. 2002. Silage production from tropical forages in Australia. Presented at the XIIIth International Silage Conference, 11 – 13th September, 2002. http://www.fao.org/ag/AGP/AGPC/doc/silage/
kaiserpaper/ kaisersilage.htm. (20 Mei 2008).
MORAN,J.B. and B.TRANTER. 2004. Reproductive management of small holder farmers in Vietnam. Collaborative work between F&N Vietnam Foods and Department of Primary Industry Kyabram, Kyabram, Victoria.
MORAN, J. 2005. Tropical Dairy Farming. Feeding management for small holder dairy farmers in the humid tropics. Landlinks Press, CSIRO, Melbourne. 291p. http://www.publish.csiro.au/nid/197/issue/ 3363. htm. (12 Mei 2008).
STOAS. 1999. Reproduction in Dairy Cattle. Book 1. STOAS, Wageningen, Netherlands.
TAWEEL,H.Z. 2006. Improving dry matter intake of perennial-pasture by dairy cows. In: Fresh Herbage for Dairy Cattle. ELGERSMA,A.,J.DIJKSTRA andS.TAMMINGA, (Eds.). Springer, Netherlands. pp. 159 – 174.