Maple Getting Started Guide
Maple Getting Started Guide
Copyright
Maplesoft, Maple, Maple Application Center, Maple Student Center, and Maplet are all trademarks of Waterloo Maple Inc.
© Maplesoft, a division of Waterloo Maple Inc. 2001-2008. All rights reserved.
No part of this book may be reproduced, stored in a retrieval system, or transcribed, in any form or by any means — electronic, mechanical, photocopying, recording, or otherwise. Information in this document is subject to change without notice and does not represent a commitment on the part of the vendor. The software described in this document is furnished under a license agreement and may be used or copied only in accordance with the agreement. It is against the law to copy the software on any medium except as specifically allowed in the agreement. Windows is a registered trademark of Microsoft Corporation.
Java and all Java based marks are trademarks or registered trademarks of Sun Microsystems, Inc. in the United States and other countries. Maplesoft is independent of Sun Microsystems, Inc.
All other trademarks are the property of their respective owners.
This document was produced using a special version of Maple and DocBook. Printed in Canada
Contents
Preface ... ix
1 Introduction to Maple ... 1
1.1 Working in Maple ... 2
1.2 Starting the Standard Document Interface ... 3
1.3 Entering 2-D Math ... 4
Example 1 - Enter and Evaluate an Expression Using Key-strokes ... 5
1.4 Shortcuts for Entering Mathematical Expressions ... 7
1.5 Palettes ... 8
Example 2 - Enter an Expression Using Palettes ... 8
1.6 Toolbar Icons ... 10
Example 3 - Enter Text and 2-D Math in the Same Line Using Toolbar Icons ... 10
1.7 Context Menus and Copy & Drag ... 12
Context Menus ... 12
Copy & Drag ... 12
Example 4 - Solve and Plot an Equation Using Context Menus and Copy & Drag ... 12
1.8 Saving a Maple Document ... 18
2 Point-and-Click Interaction ... 19
2.1 Assistants ... 20
Plot Builder ... 21
Descriptions of Assistants ... 28
2.2 Tutors ... 30
2.3 Context Menus ... 32
2.4 Task Templates ... 34
Previewing Tasks ... 35
Inserting a Task into the Document ... 36
Updating Parameters and Running the Commands ... 37
2.5 Palettes ... 37
3 Commands ... 43
3.1 The Maple Library ... 44
3.2 Entering Commands ... 44
Package Commands ... 45
Command Completion ... 46
Equation Labels ... 47
3.3 Accessing Help with Commands and Packages ... 50
3.4 Viewing Maple Code in Document Mode ... 51
3.5 Document Mode vs. Worksheet Mode ... 53
3.6 Math Mode vs. Text Mode ... 55
3.7 Maple Toolbar Options ... 57
3.8 Top Commands and Packages ... 61
4 The Maple Help System ... 65
4.1 Accessing the Help System ... 66
4.2 Using the Help Navigator ... 67
Help System Table of Contents ... 67
4.3 Viewing Help Pages as Documents ... 68
4.4 Copying Examples ... 68
5 Using Maple ... 71
5.1 Clickable Math in Maple ... 72
Example 1 - Graph a function and its derivatives ... 72
Example 2 - Solve for x in the linear equation ... 78
Example 3 - A Quadratic Trig Equation ... 84
Example 4 - Inverse Functions ... 87
Example 5 - Methods of Integration - Trig Substitution ... 91
Example 6 - Initial Value Problem ... 94
5.2 Calculus Examples ... 98
Problem ... 99
Check for Existing Tools: Tutor ... 100
Check for Existing Tools: Task Template ... 101
Check for Instructions: Help Page and Example Worksheet ... 102
Check for Other Ready-To-Use Resources: Application Center .... 104
6 Available Resources ... 107
6.1 Online Help and Examples ... 108
Help Pages ... 108
Dictionary ... 108
Applications and Example Worksheets ... 108
6.2 Maple Tour and New User Roadmap ... 109
Maple Tour ... 109
6.3 Web Site Resources ... 110
Welcome Center ... 110
Student Help Center ... 110
Teacher Resource Center ... 110
Application Center ... 111
PowerTools ... 111
Training ... 111
MaplePrimes ... 112
Technical Support ... 112
List of Tables
Table 1.1: Common Keystrokes for Entering Symbols and Formats ... 7
Table 2.1: 2-D Plot Options Available in the Plot Builder ... 27
Table 2.2: Managing Palettes ... 38
Table 2.3: Palette Categories ... 41
Table 3.1: Worksheet Mode vs. Document Mode ... 53
Table 3.2: Math Mode vs. Text Mode ... 56
Table 3.3: Maple Toolbar Options ... 57
Table 3.4: Tab Icon Description ... 58
Table 3.5: Toolbar Icons and their Tools ... 59
Table 3.6: Toolbar Icon Availability ... 59
Table 3.7: Top Commands ... 61
Table 3.8: Top Packages ... 62
Preface
Maple Software
MapleTM software is a powerful system that you can use to solve mathemat-ical problems from simple to complex. You can also create professional quality documents, presentations, and custom interactive computational tools in the Maple environment.
You can access the power of the Maple computational engine through a variety of interfaces.
Description Interface
A full-featured graphical user interface that helps you create electronic documents to show all your calculations, assumptions, and any margin of error in your results. You can also hide the computations to allow your reader to focus on the problem setup and final results. The advanced formatting features lets you create the customized document you need. Because the documents are
live, you can edit the parameters and, with the click of a button, compute the new results. The Standard interface has two modes:
Document mode and Worksheet mode. Standard (default)
A basic worksheet environment for older computers with limited memory. The Classic interface does not offer all of the graphical user interface features that are available in the Standard interface. The Classic interface has only one mode, Worksheet mode. Classic
A command-line interface for solving very large complex problems or batch processing with scripts. No graphical user interface fea-tures are available.
Command-line version
Graphical user interfaces containing windows, textbox regions, and other visual interfaces, which gives you point-and-click access to the power of Maple. You can perform calculations and plot functions without using the worksheet.
MapletTMApplications
Description Interface
A graphical calculator interface to the Maple computational engine. Using it, you can perform simple computations and create custom-izable, zoomable graphs. This is available on Microsoft® Win-dows® only.
MaplesoftTMGraphing Calculator
This manual describes how to use the Standard interface. As mentioned, the Standard interface offers two modes: Document mode and Worksheet mode. Using either mode, you can create high quality interactive mathematical documents. Each mode offers the same features and functionality, the only difference is the default input region of each mode.
Document Mode vs.Worksheet Mode
Before you can begin using Maple, you need to decide if you want to interact in an interface that hides all commands used to perform calculations by de-fault (Document mode) or to show all commands by dede-fault (Worksheet mode). Regardless of which mode you are working in, you have the oppor-tunity to show or hide your calculations, i.e. you can hide commands in Worksheet mode by adding a Document Block from the Format menu,
Format → Create Document Block or you can show commands in Docu-ment mode by adding a Maple prompt from the Insert menu, Insert → Ex-ecution Group → Before / After Cursor.
Document Mode
Document mode uses Document Blocks as the default input region to hide Maple syntax. The Document Block region is indicated by two triangles located in the vertical Markers column along the left pane of the Maple
with self-documenting text indicating the calculation that had taken place. The command used to solve this expression is hidden.
When starting Standard Maple, the default mode is Document mode.
Worksheet Mode
Worksheet mode uses a Maple prompt as the default input region. The Maple input prompt is a red greater then symbol where the black square bracket
indicates the full execution region, . When using content menus on Maple input in Worksheet mode, all commands are displayed.
To work in Worksheet mode, select File→New→Worksheet Mode.
Math Mode vs. Text Mode
Within each interface mode, you have the choice of entering input using
Math mode or Text mode. Math mode allows you to enter input as 2-D Math regardless if you are working in Document mode or Worksheet mode. Text mode is quite different depending on where you are working. Toggling modes is done using the Text and Math buttons on the toolbar.
Text mode Math mode (default setting)
Entry mode→ Interface mode↓
• Input is made at a Document Block with vertical cursor,
• Input is entered as regular text, • Input is made at a Document Block
with slanted cursor,
• Input is entered using 2-D Math,
• Commands are hidden when using context menus,
Document (default
set-ting)
(Default setting for earlier versions of Maple)
• Input is made at an input prompt with a vertical cursor,
• Input is entered using 1-D Math and requires a semi-colon or colon to end your input,
• Commands display when using context menus on the expression output,
• Input is made at an input prompt with a slanted cursor,
• Input is entered using 2-D Math,
• Commands display when using con-text menus,
Worksheet
Invoking Context Menus, Command
Completion, and Copy & Drag
This manual will frequently refer to context menus and command completion when entering expressions. We will also discuss dragging input into another region by copying the input using a keystroke while dragging. By not using this keystroke, the input is deleted from the input region. The keyboard keys used to invoke these features differ based on the operating system you're using.
Context Menus
• Right-click, Windows and UNIX®
• Control-click, Macintosh®
That is, place the mouse over input or output region and press the right button on the mouse or press and hold the Control key and click the mouse key for Macintosh.
Command Completion
• Ctrl + Space or Esc, Windows• Command + Shift + Space or Esc, Macintosh
• Ctrl + Shift + Space or Esc, UNIX
Begin entering a command in a Maple document. Press and hold the Ctrl
key and then press the Space bar for Windows. Press and hold the Command
key, press and hold the Shift key, and then press the Space bar for Macintosh. Alternatively, press the Esc key. The steps for Macintosh are the same for UNIX with the exception of pressing the Ctrl key instead of the Command
key.
Copy & Drag
• Ctrl + drag, Windows and UNIX
• Command + drag, Macintosh
That is, highlight the region you want to copy. Press and hold the Ctrl key while you drag the input to the new region using the mouse. The steps are the same for Macintosh with the expression of pressing the Command key.
This manual will only refer to the keyboard keys needed for a Windows operating system. When working through the examples, use the keyboard keys needed for your operating system. For more information on Context Menus and Copy & Drag, see Context Menus and Copy & Drag (page 12). For more information on Command Completion, see Command Comple-tion (page 46).
In This Manual
This manual provides an introduction to the following Maple features:
• Ease-of-use when entering and solving problems
• Point-and-click interaction with various interfaces to help you solve problems quickly
• Maple commands and standard math notation
• Clickable Calculus
• The help system
• Accessing resources
The Getting Started Guide was created using the Standard interface to Maple. An interactive version of this manual is available in the Standard interface. From the Help menu, select Manuals, Dictionary, and more → Manuals
→ Getting Started Guide. For a complete list of manuals, study guides, toolboxes, and other resources, visit the Maplesoft Web site at ht-tp://www.maplesoft.com
Audience
The information in this manual is intended for first-time Maple users.
Conventions
This manual uses the following typographical conventions.
• bold font - Maple command, package name, option name, dialog, menu, and text field
• italics - new or important concept
• Note - additional information relevant to the section
• Important - information that must be read and followed
Customer Feedback
Maplesoft welcomes your feedback. For suggestions and comments related to this and other manuals, contact [email protected].
1 Introduction to Maple
Don't worry about your difficulties in Mathematics. I can assure you mine are still greater.
~Albert Einstein
Mathematics touches us every day—from the simple chore of calculating the total cost of our purchases to the complex calculations used to construct the bridges we travel.
To harness the power of mathematics, Maplesoft provides a tool in an access-ible and complete form. That tool is Maple.
In this chapter:
Describes the capabilities of the Maple Environment. Working in Maple
Explains what happens the first time you start Maple and shows how to begin a Document.
Starting the Standard Document Interface
Illustrates how to enter an expression in 2-D Math. Entering 2-D Math
Provides a table of the common keystrokes when entering 2-D Math.
Shortcuts for Enter-ing Mathematical Expressions
Illustrates how to enter a problem using Maple palettes. Palettes
Illustrates how to enter text and math on the same line. Toolbar Icons
Illustrates how to take advantage of Maple's context menus and copy & drag functionality to solve a problem.
Context Menus and Copy & Drag
Explains how to save a Maple document and indicates the file extension used for Maple documents.
Saving a Maple Doc-ument
1.1 Working in Maple
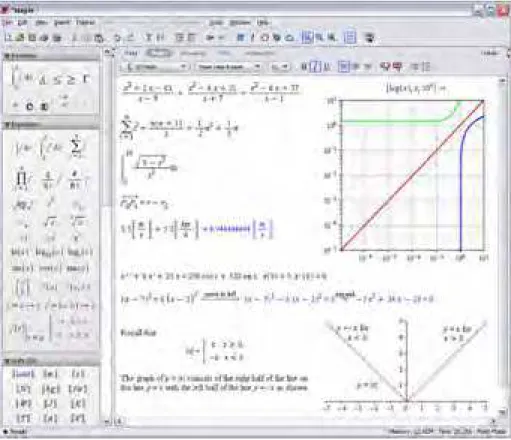
With Maple you can create powerful interactive documents. The Maple en-vironment lets you start solving problems right away by entering expressions in 2-D Math and solving these expressions using point-and-click interfaces. You can combine text and math in the same line, add tables to organize the content of your work, or insert images, sketch regions, and spreadsheets. You can visualize and animate problems in two and three dimensions, format text for academic papers, or books, and insert hyperlinks to other Maple files, Web sites, or email addresses. You can embed and program graphical user interface components, as well as devise custom solutions using the Maple programming language.
Figure 1.1: The Maple Environment
1.2 Starting the Standard Document
Interface
To start Maple on:
From the Start menu, select All Programs → Maple 12 →Maple 12.
Alternatively:
Double-click the Maple desktop icon. Windows
1. From the Finder, select Applications and Maple 12. 2. Double-click Maple 12.
Macintosh
Enter the full path, for example, /usr/local/maple/bin/xmaple Alternatively:
1. Add the Maple directory (for example, /usr/local/maple/bin) to your command search path.
2. Enter xmaple. UNIX
The first Maple session opens with a Startup dialog explaining the difference between Document Mode and Worksheet Mode. Using either mode, you can create high quality interactive mathematical documents. Each mode offers the same features and functionality, the only difference is the input region of each mode.
Document Mode - The default input region is a Document Block. Document Blocks hide Maple syntax allowing you to focus on the problem instead of the commands used to solve the problem.
Worksheet Mode - The default input region is a Maple input prompt where all commands are displayed.
Regardless of which mode you are working in, you have the opportunity to show or hide your calculations.
This guide discusses features common to Document mode. Instructions for using Worksheet mode are provided in the section, Document Mode vs. Worksheet Mode (page 53).
The Startup dialog also contains links to items, such as various document options, help resources including updates and other introductory help pages, and application resources on the Maplesoft Web site. Subsequent sessions display Tip of the Day information.
To start a Maple session in Document Mode:
1. In the Startup dialog, select Blank Document. A blank document displays.
or
1. Close the Startup dialog.
2. From the File menu, select New, and then Document Mode. A blank document displays.
In subsequent sessions, Maple starts in Document mode. Every time you open a document, Maple displays a Quick Help pop-up list of important shortcut keys. To invoke Quick Help at any time, press the F1 key.
1.3 Entering 2-D Math
In Maple, the default behaviour to enter mathematical expressions is in 2-D Math. This results in mathematical expressions that are equivalent to the quality of math found in textbooks. Entering 2-D Math in Maple is done using common key strokes or palette items. For more information on palettes, see Palettes (page 8). An example of entering an expression using common key strokes is presented in the following section. An example of entering an expression using palette items is presented in Example 2 - Enter an Expres-sion Using Palettes (page 8).
Example 1 - Enter and Evaluate an Expression
Using Keystrokes
Review the following example:
=
In this example, we will enter and evaluate the expression.
Result in Document Action
To enter the expression:
1. Enter (x.
2. Press Shift + 6 (the ^ or caret key). The cursor moves to the superscript position.
3. Enter 2.
4. Press the right arrow key. The cursor moves right and out of the superscript position.
5. Enter the + symbol. 6. Enter y.
7. Press Shift + 6 to move to the superscript position. 8. Enter 2 and press the right arrow key.
9. Enter ) to close the parenthesis.
10. Enter the / symbol. The cursor moves to the denominator.
Result in Document Action
11. Enter 2.
12. Press the right arrow key to move right and out of the denom-inator position.
=
To evaluate the expression and display the result inline:
13. Press Ctrl + = (Command + = for Macintosh).
To execute 2-D Math, you can use any of the following methods.
• Pressing Ctrl + = (Command + =, for Macintosh). That is, press and hold the Ctrl (or Command) key, and then press the equal sign (=) key. This evaluates and displays results inline.
• Pressing the Enter key. This evaluates and displays results on the next line and centered.
• Right-click (Control-click for Macintosh) the input to invoke a context menu item. From the context menu, select Evaluate and Display Inline. See Context Menus and Copy & Drag (page 12) for more details.
1.4 Shortcuts for Entering
Mathemat-ical Expressions
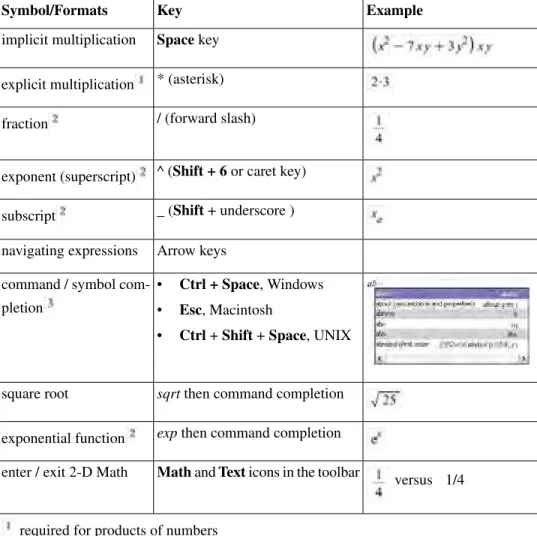
Table 1.1: Common Keystrokes for Entering Symbols and Formats
Example Key
Symbol/Formats
Space key implicit multiplication
* (asterisk) explicit multiplication
/ (forward slash) fraction
^ (Shift + 6 or caret key) exponent (superscript)
_ (Shift + underscore ) subscript
Arrow keys navigating expressions
• Ctrl + Space, Windows • Esc, Macintosh
• Ctrl + Shift + Space, UNIX command / symbol
com-pletion
sqrt then command completion square root
exp then command completion exponential function
versus 1/4
Math andText icons in the toolbar enter / exit 2-D Math
required for products of numbers
use right arrow key to leave denominator, superscript, or subscript region for more information, see Command Completion (page 46).
1.5 Palettes
Palettes are collections of related items that you can insert into a document by clicking or drag-and-dropping. The Maple environment provides access to over 20 palettes containing items such as symbols , layouts
mathematical operations and much more. For more
in-formation on the available palettes, see Palettes (page 37).
By default, palettes are displayed in the left pane of the Maple environment when you launch Maple. If the palettes are not displayed,
1. From the View menu, select Palettes.
2. Select Expand Docks.
3. Right-click (Control-click, for Macintosh) the palette dock. From the context menu, select Show All Palettes.
Alternatively, from the main menu, select View → Palettes → Arrange Palettes to display specific palettes.
Example 2 - Enter an Expression Using Palettes
Review the following example:
=
Result in Document Action
1. In the Expression palette, click the summation
template . Maple inserts the summation symbol with the range placeholder highlighted. 2. Enter i and then press Tab. The left endpoint placeholder is selected. Notice that the color of the range placeholder has changed. Each placeholder must have an assigned value before you execute the expression, i.e. all placeholders will display in black font. The Tab key advances you through the placeholders of an inserted palette item.
3. Enter 1 and then press Tab. The right endpoint placeholder is selected.
4. Enter 10 and then press Tab. The expression placeholder is selected.
5. Enter
6. Press Ctrl + = (Command + = for Macintosh) to evaluate the summation.
1.6 Toolbar Icons
Using Maple, you can enter math and text on the same line with the Text
and Math icons on the toolbar. See Figure 1.2. When the Text icon is selec-ted, you can enter text and format it using the available tools. If you then select the Math icon, you change the mode to allow entry of 2-D Math. The same formatting options are available when the Math icon is selected.
Figure 1.2: Icons for Text and Math Entry Mode
Example 3 - Enter Text and 2-D Math in the Same
Line Using Toolbar Icons
Review the following example:
Evaluate
Result in Document Action
To enter this sentence:
1. Select the Text icon and enter Evaluate.
2. Select the Math icon.
3. From the Expression palette, select the
definite integration template, . The expression is displayed with the first place-holder highlighted.
Result in Document Action
4. With the first placeholder highlighted, enter 1.
5. Press Tab and enter 5.
6. Press Tab to highlight the integrand re-gion.
7. Enter (3x^2 and press the right arrow to leave the superscript position.
8. Enter + 2.
9. Press the Space bar for implicit multiplic-ation. Enter sqrt and press Ctrl + Space to show the command completion options. Maple displays a pop-up list of exact matches. Select the square root symbol, . Maple inserts the symbol with the x place-holder selected. You can also select the square root symbol from the Expression
palette. 10. Enter x.
11. Press the right arrow to leave the square root region
12. Enter +3.
13. Press the Space bar.
14. Select the n-th root symbol from the Expression palette .
15. Enter 3.
16. Press the Tab key and enter x).
17. Press the Tab key and enter x for the in-tegration variable.
1.7 Context Menus and Copy & Drag
Context Menus
Maple dynamically generates a context menu of applicable options when you right-click an object, expression, or region. The actions available in the context menu depend on the selected input region. For example, you can manipulate and graph expressions, enhance plots, format text, manage palettes, structure tables, and more. When using context menus to perform an action on an expression, the input and output are connected with a self-documenting arrow or equal sign indicating the action that had taken place. For more information, see Context Menus (page 32).
Copy & Drag
To save time entering information, Maple has the ability to drag input into a new input region. This is done by highlighting the input and dragging it with your mouse into a new input region. Dragging the highlighted region will cut or delete the original input. To prevent this, press and hold the Ctrl
key and then the drag the input. This makes a copy of the highlighted region.
Example 4 - Solve and Plot an Equation Using
Context Menus and Copy & Drag
Review the following example:
In this example, we will enter the equation and then solve and plot the equation using context menus and Maple's copy & drag feature. This example will only refer to the keystrokes needed on a Windows operating system to invoke the context menus and the copy & drag feature. For your operating system, refer to section Invoking Context Menus, Command Completion, and Copy & Drag (page xiii) for the equivalent keystrokes.
To solve the equation:
1. Enter the equation.
2. Right-click the equation and select Move to Left.
Input:
Result:
A brief description, "move to left" is placed above the arrow connecting the input and output.
3. Right-click the output from the previous action, and select Left-hand Side.
Input:
Result:
4. Right-click the new output, and select Solve → Isolate Expression for → x.
Input:
Result:
Now that we have solved the equation, we can plot it. To do this, we will copy the expres-sion to a new Document Block and use context menus once again.
5. From the Format menu, select Create Document Block.
6. To copy the expression , highlight only this expression from the previous result. Press and hold the Ctrl key and drag the expression to the new document block region.
Result:
To plot the expression:
7. Right-click the expression and select Plots→2-D Plot.
Input:
Result:
1.8 Saving a Maple Document
To save these examples you created, from the File menu, select Save. Maple documents are saved as .mw files.
2 Point-and-Click Interaction
Maple contains many built-in features that allow you to solve problems quickly without having to know any commands.In this chapter:
Interactive tools that help you accomplish many specialized tasks, such as solving ODEs and ODE systems, creating plots and matrices, calculating optimization problems, performing unit conversions, and more.
Assistants
Interactive tools that aid in the learning of precalculus, calculus, multivariate calculus, vector calculus, differential equations, and linear algebra concepts.
Tutors
Context menus to manipulate expressions, plot regions, text re-gions, and objects easily.
Context Menus
Templates to help you learn how to perform mathematical com-putations, construct Maple objects, and create a detailed Maple document.
Task Templates
A collection of templates representing items such as predefined symbols, expressions, operators, and matrices.
Palettes
2.1 Assistants
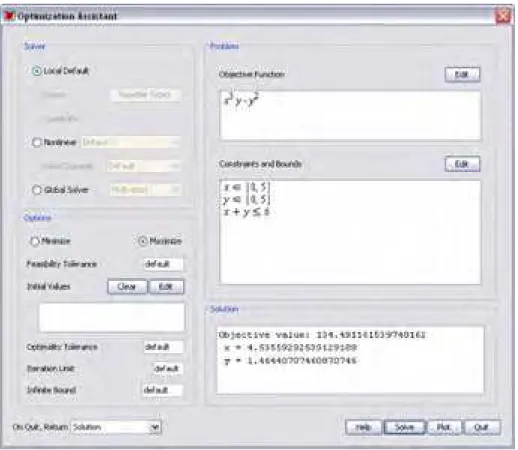
Maple offers a set of assistants in the form of graphical user interfaces to perform many tasks without you needing to use any syntax. An example of an assistant is shown in Figure 2.1.
Figure 2.2: Optimization Assistant
Using the Tools → Assistants menu, you can access tools to help you ac-complish these various tasks. See Figure 2.2. In some cases, you can launch the assistants by entering an expression and selecting the assistants from the context menu that displays.
Figure 2.2: Accessing the Assistants from the Tools Menu
Plot Builder
The Plot Builder is a point-and-click interface to the Maple plotting func-tionality. The interface displays plot types based on the expression you spe-cify. The available plot types include plots, interactive plots, animations, or interactive animations. Depending on the plot type you enter, you can create:
• 2-D / 3-D plot
• 2-D polar plot
• 2-D / 3-D conformal plot of a complex-valued function
• 2-D / 3-D complex plot
• 2-D density plot
• 2-D gradient vector-field plot
• 2-D implicit plot
Using the Plot Builder, you can:
(1) Specify the plotting domain before you display the graph
(2) Specify the endpoints of the graph as symbolic, for example, Pi, sqrt(2)
(3) Apply plot options using drop-down menus.
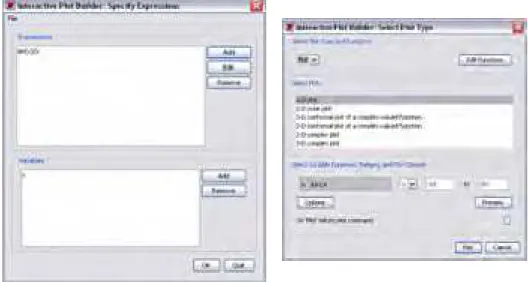
The output from the Plot Builder is a plot of the expression or the command used to generate the plot. Figure 2.3 - 2.5 shows three of the main dialogs in the Plot Builder.
Figure 2.4: Select Plot Type Figure 2.3: Specify Expressions
Figure 2.3: Specify Expressions dialog al-lows you to add, edit, or remove expressions and variables.
Figure 2.4: Select Plot Type dialog allows you to select the plot type and corresponding plot, and edit the ranges.
Figure 2.5: Plot Options dialog allows you to apply plot options.
Figure 2.5: Plot Options
Example 1- Plot an Expression Using the Interactive Plot Builder Review the following example:
In this example, we will use the Plot Builder to plot the expression
and apply the following plot options:
• change the default -axis range
• change the thickness of the line
• change the color of the line
• apply gridlines
•
Launch the Plot Builder and add the expression:
1. From the Tools menu, select Assistant→Plot Builder. The Specify Expressions dialog displays. See Figure 2.3.
2. In the Expressions region, click Add.
3. In the Add/Edit Expression dialog, enter sin(x)/x and click Accept. Select a plot type and change the default x-axis range:
4. Click OK and the Select Plot Type dialog displays. See Figure 2.4. Alternatively, you could have entered the expression and used the context menus to launch the Plot Builder by selecting Plots→Plot Builder. See Figure 2.6. This will launch the Plot Builder and automatically insert the expression.
Figure 2.6: Using Context Menus to launch the Plot Builder
5. From the Select Plot Type dialog, you can edit or add functions, select a plot type, change the -axis range, or even preview the plot with the current default settings. With 2-D Plot selected, change the -axis range to span from -25 to 25.
Change the plot options:
6. To edit the plot options, click Options. The 2-D Plot (plot) dialog displays. Refer to 2-D Plot Options Available in the Plot Builder (page 27)for more information on each plot option available in this dialog.
7. Before we change any options, click Preview to display the plot with the current default options. Use this feature after applying each plot option described in the following steps to see how the curve has changed.
8. Click Done to return to the 2-D Plot (plot) dialog.
7. To change the thickness of the line, from the Line region, select thick from the right drop-down menu.
10. To change the color of the expression, from the Color region, select Blue from the drop down menu. Notice that the color swatch below the drop-down menu now shows blue.
11. To alter the axes settings, in the Axes region, click Advanced Settings.
12. In the -axis row, select 50 from the Gridlines drop-down menu. In the Major Gridlines drop-down menu, select 5. In the second row, select 10 from the Gridlines drop-down menu and select 5 from the Major Gridlines drop-down menu.
13. Click Apply to apply this setting and return to the 2-D Plot (plot) dialog.
14. To close the Plot Builder and return the plot to the document, in the 2-D Plot (plot)
dialog, click Plot.
2-D Plot Options Available in the Plot Builder
Table 2.1: 2-D Plot Options Available in the Plot Builder
Description Plot option
Using the Plot Builder, you can plot multiple expressions in the same plot region. To apply different options for each line, you would select an expression from the drop-down menu and apply the line style settings. You would do this for each line. In the previous example, only one ex-pression is available.
expression(s)
To edit the -axis range, you need to click the Back button to return to the Select Plot Type dialog. In the 2-D Plot options dialog, you can change the -axis label and orientation of the label by altering the de-fault entries for the -axis row.
-axis
To edit the -axis range, enter a range, label, and orientation in the row beginning with Range from.
-axis
Specifies the line style, one of line or point. The default setting is line.
Style
Line style and size options available when Style is set to line.
Line
Symbol style and size options available when Style is set to point.
Symbol
Description Plot option
Select a color from the drop down menu or click Custom to select a color from the color dialog.
Color
Select from the axes styles available, edit the style of the axes labels or apply advanced axis options such as gridlines by clicking Advanced Settings.
Axes
Constrained or non-constrained view. The default setting is non-con-strained.
View
Adds a title to the plot and allows you to alter the font style.
Title
Adds a legend to the plot and allows you to alter the font style.
Caption
Sets the horizontal display resolution of the device in pixels. The default is 200.
Resolution
When plotting a function over an interval, the interval is sampled at a number of points, controlled by sample and numpoints. Adaptive plot-ting, where necessary, subdivides these intervals to attempt to get a better representation of the function.
Adaptive Plot-ting
Determines the discontinuities of the input and then breaks the horizontal axis into appropriate intervals where the expression is either continuous or contains only removable discontinuities.
Find Discontinu-ities
Specifies the minimum number of points to be generated. The default is 50.
Number of Points
Fills the region between the curve and the -axis.
Fill to -axis
Select from the coordinate systems available.
Coordinate Sys-tem
Descriptions of Assistants
The remaining Assistants are described below. Some of the Assistants are interfaces to package commands. For more information on package com-mands, see Package Commands (page 45).
parameters and solve for the remaining value. You can also plot the be-haviour of the formula as one of the parameters change.
• Curve Fitting- an interface to commands in the CurveFittingpackage. Data points can be entered as independent and dependent values, and interpolated with polynomials, rational functions, or splines.
• Data Analysis - an interface to the data analysis commands in the Stat-istics package.
• Import Data - an interface to read data from an external file into Maple.
• Installer Builder- an interface to the InstallerBuilder package in which you can create installers for your Maple toolboxes. For information on toolboxes, go to http://www.maplesoft.com/developers/index.aspx.
• Library Browser- an interface to manipulate the libraries in a specified directory.
• Maplet Builder - an interface to the Maplets package. The Maplets
package contains commands for creating and displaying Maplet applica-tions (point-and-click interfaces). Using the Maplet Builder, you can define the layout of a Maplet, drag-and-drop elements (visual and func-tional components of Maplets), set actions associated with elements, and directly run a Maplet application. The Maplet Builder is available in the Standard interface only.
• ODE Analyzer- an interface to obtain numeric or symbolic solutions to a single ODE or a system of ODEs and plot a solution of the result.
• Optimization- an interface to the solver commands in the Optimization
package. The Optimization package is a collection of commands for numerically solving optimization problems, which involves finding the minimum or maximum of an objective function possibly subject to con-straints.
• Plot Builder- an interface for creating two and three-dimensional plots, animations, and interactive plots.
come with the corresponding unit and, if applicable, with the uncertainty or error, that is, how precisely the value of this constant is known.
• Special Functions - an interface to the properties of over 200 special functions, including the Hypergeometric, Bessel, Mathieu, Heun and Legendre families of functions.
• Units Calculator- an interface to convert between 500 units of measure-ment.
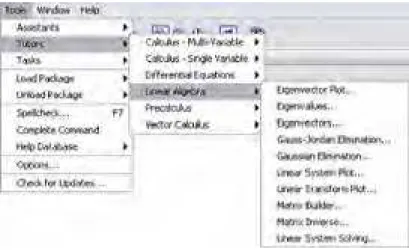
2.2 Tutors
Maple provides over 40 interactive tutors to aid in the learning of
• Precalculus
• Calculus
• Multivariate Calculus
• Vector Calculus
• Differential Equations
• Linear Algebra
These tutors are easily accessible by selecting Tools →Tutors. See Figure 2.7.
Figure 2.7: Accessing Tutors from the Tools Menu
Some of the tutors are also accessed through the Student package. The Differential Equations tutor, DE Plots, is accessible through the DEtools
package. For a definition of the term package, see Package Com-mands (page 45).
The Student package is a collection of subpackages designed to assist with the teaching and learning of standard undergraduate mathematics. The sub-packages contain many commands for displaying functions, computations, and theorems in various ways, and support for stepping through important computations.
• The visualization commands are tools that create plots and animations showing the geometric interpretation of important concepts.
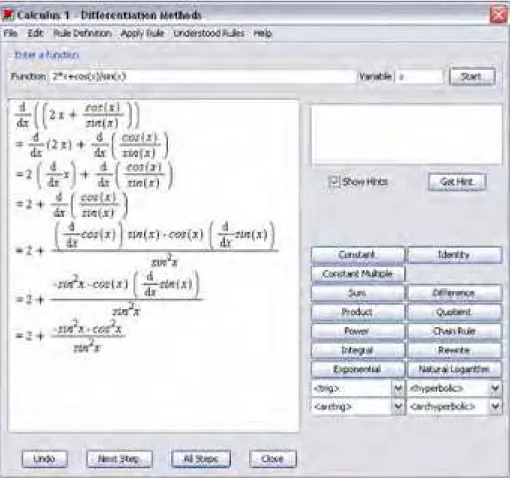
• The computationcommands help you to study the techniques of compu-tation while solving problems. For example, using the Calculus1package, you can differentiate a function one step at a time by specifying the needed differentiation rule applied at each step. At any time during a single-step computation, you can request a hint about the next step, which you can then apply to the problem, or you can proceed directly to the final answer.
• Theinteractive commands help you explore concepts and solve problems using a point-and-click interface. These commands launch tutors that provide a graphical interface to visualization and computation commands described above. See Figure 2.8 for an example of one of the interactive commands.
Figure 2.8: Calculus - Single Variable → Differentiation Methods Tutor
2.3 Context Menus
perform calculations and manipulations on expressions without using Maple syntax. To display a context menu, right-click an object, expression, or region. Context menus are available for many input regions including:
• expressions to perform calculations, manipulations, or plotting
• plot regions to apply plot options and manipulate the plot
• tables to modify the table properties
• palette regions to add or remove palettes and palette regions
• text regions to add annotations and format text
• spreadsheets to manipulate the spreadsheet
When performing calculations or manipulations on an expression, a self-documenting arrow or equal sign connects the input and output indicating the action that took place. See Figure 2.9 and 2.10 for two examples of context menus.
Figure 2.10: Right-click the plot to see a menu of plot options.
Figure 2.9: Right-click the expression to see a menu of applicable options.
2.4 Task Templates
Task templates help you perform specific tasks in Maple, such as:
• performing a mathematical computation such as solving an equation symbolically or numerically, or determining the Taylor approximation of a function of one variable
• constructing a Maple object such as a function
• creating a document such as an application
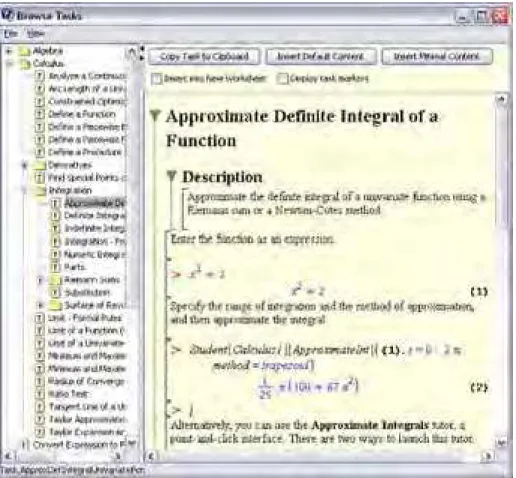
commands, embedded components (for example, buttons) and plots. You need to specify the parameters of your problem and then run the document. See Figure 2.11 for an example of a Task Template.
Figure 2.11 Browse Tasks Dialog
Previewing Tasks
To preview Maple tasks,
• From the Tools menu, select Tasks, and then Browse. The Browse Tasks dialog opens and displays the list of tasks.
The tasks are sorted by subject to help you quickly find the desired task. In the Browse Tasks dialog, you can view tasks without inserting them into your document.
Inserting a Task into the Document
To insert a task into your document,
1. Select the Insert into New Worksheet check box to insert the task into a new document.
2. Click Insert Default Content or Insert Minimal Content.
• Default content includes the task title and description.
• Minimal content inserts only the major components (commands and buttons).
Note: You can view the history of previously inserted tasks. From the Tools
menu, select Tasks. Previously selected task names are displayed below the Browse menu item.
Before inserting a task, Maple checks whether the task variables have as-signed values in your document. If any task variable is asas-signed, the Task Variables dialog opens to allow you to modify the names. Maple uses the edited variable names for all variable instances in the inserted task.
By default, the Task Variables dialog is displayed only if there is a naming conflict. You can set it to display every time you insert a task.
To specify that the Task Variables dialog be displayed every time you insert a task:
1. From the Tools menu, select Options.
2. Click the Display tab.
3. In the Show task variables on insert drop-down list, select Always.
Updating Parameters and Running the Commands
In inserted Task Templates, parameters are marked as placeholders or spe-cified using sliders or other embedded components. Update the parameter values as required.
Note: To navigate between placeholders in the document, press the Tab key.
After updating any parameters, execute the commands or click the buttons.
2.5 Palettes
The Maple document environment provides access to over 20 palettes. Palettes are collections of related items that you can insert by clicking or drag-and-dropping into a document. Palettes contain:
• Symbols such as π, ∞, and ∇
• Layouts such as an item with a superscript and subscript
• Mathematical operations such as a definite integral with placeholders for the integrand, variable of integration, and endpoints of the interval
of integration
You can create a Favorites palette of the expressions and entities you use often by right-clicking (Control-click for Macintosh) the palette template you want to add and selecting Add To Favourites Palette from the context menu.
The Handwriting palette provides another way to find and insert desired symbols easily. Draw the symbol with your mouse in the space provided
and then click . Maple matches your input against symbols available in the system. See Figure 2.12.
Figure 2.12: Handwriting Palette
By default, palettes display in palette docks at the right and left sides of the Maple window. To view and manage palettes and palette docks, see Table 2.2.
Table 2.2: Managing Palettes
To view palette docks:
From the View menu, select Palettes, and then
Expand Docks.
To add a palette:
1. Right-click the palette dock. Maple displays a context menu near the palette.
2. From the context menu, select Show Palette
and then select the palette.
To expand a palette in a palette dock:
Click the triangle at the left of the palette title.
To move a palette in a palette dock:
Move the palette by clicking the title and dragging the palette to the new location.
To expand/collapse the palette docks:
Select the appropriate triangle at the top right or top left side of the palette region.
Table 2.3: Palette Categories
Palette Description Palette Category
Expression - a palette for constructing expressions such as
in-tegrals .
Matrix - a palette allowing you to enter the number of rows and columns required, designate type, such as zero-filled, and designate shape, such as diagonal.
Layout - a palette that allows you to add math content that has specific layout, such as expressions with one or more super-scripts and subsuper-scripts .
Components - a palette that allows you to embed graphical in-terface components such as a button into your document or worksheet. Components can be programmed to perform an ac-tion when selected such as executing a command when clicking
a button .
Handwriting - a palette that provides an easy way to find a desired symbol.
Units (SI) - a palette that inserts a unit from the International System of Units (SI), or any general unit .
Units (FPS) - a palette that inserts a unit from the Foot-Pound-Second System (FPS), or any general unit .
Accents - a palette that allows you to insert decorated names such as an with an arrow over it to denote a vector .
Favorites - an empty palette where you can add templates that you use most often from other palettes.
Expression Palettes
Palette Description Palette Category
Palettes for constructing expressions
Common Symbols, Relational , Relational Round ,
Operators , Large Operators , Negated , Fenced
,Arrows , Constants and Symbols .
Punctuation - a palette of punctuation symbols such as the re-gistered trademark symbols for inserting into text regions
Miscellaneous - a palette of miscellaneous math and other symbols outside the above categories .
Mathematical Palettes
Greek, Script , Fraktur , Open Face , Cyrillic ,
Diacritical Marks , Roman Extended Upper Case ,
Roman Extended Lower Case .
Alphabetical Palettes
3 Commands
Even though Maple comes with many features to solve problems and manip-ulate results without entering any commands, you may find that you prefer greater control and flexibility by using the set of commands and programming language that Maple offers.
In this chapter:
Explains the structure of the commands in the Maple system and provides resources for learning Maple commands.
The Maple Library
Provides examples of entering top-level commands and package commands, and explains the benefits of using equation labels and command completion. Entering Commands
Explains one of the main resources available when learning Maple commands.
Accessing Help with Com-mands and Packages
Explains how to view the Maple code hidden in Docu-ment blocks.
Viewing Maple Code in Doc-ument Mode
Explains the Worksheet mode and how it differs from Document mode.
Document Mode versus Worksheet Mode
Compares Math mode and Text mode forms of entering information in Maple.
Math Mode versus Text Mode
Describes the Maple toolbar options. Maple Toolbar Options
Provides a list of the top packages and commands in Maple.
Top Packages and Commands
3.1 The Maple Library
Commands are contained in the Maple library, which is divided into two groups: themain libraryand packages.
• The main library contains the most frequently used Maple commands.
• Packages contain related commands for performing tasks from disciplines such as Student Calculus, Statistics, or General Relativity Theory. For example, the Optimization package contains commands for numerically solving optimization problems.
3.2 Entering Commands
If you want to interact with Maple using commands, simply enter the com-mand using 2-D math. You will notice that comcom-mands and variable names display in italics. Maple commands are constructed in a format similar to
command(arguments) based on the command you are using.
To factor an expression, enter:
To integrate an expression in the range [ enter:
To plot an expression, enter:
For a list of the top commands in Maple, see Top Commands and Pack-ages (page 61).
Package Commands
There are two ways to access commands within a package, using the long form of the package command or the short form.
Long Form of Accessing Package Commands
The long form specifies both the package and command names using the syntax package[command](arguments).
Short Form of Accessing Package Commands
The short form loads all of the commands in the package using the with
command, with(package). If you are using a number of commands in a package, loading the entire package is recommended. Using the with com-mand, a list of all commands in the package displays. To suppress the display of all command names, end the with(package) command with a colon. Al-ternatively, you can load packages through Tools → Load Package.
After loading a package, you can use the short-form names, that is, the command names, without the package name.
For a list of the top packages in Maple, see Top Commands and Pack-ages (page 61).
Command Completion
To help with syntax and reduce the amount of typing when entering Maple commands, you can use command completion. Command completion displays a list of all Maple packages, commands, and functions that match the entered text.
To use command completion:
1. Begin entering a command or package name.
2. Select Tools → Complete Command or use short cut keys:
• Ctrl + Space or Esc, Windows
• Command + Shift + Space or Esc, Macintosh
• Ctrl + Shift + Space or Esc, UNIX
If there is a unique completion, it is inserted. Otherwise, a list of matches is displayed.
3. Select the correct completion from the list.
Equation Labels
Equation labels help to save time entering expressions by referencing Maple output. The label is associated with all output within an execution group. See Figure 3.1 and 3.2. You cannot apply equation labels to the following:
• Error, warning, and information messages
• Tables, images, plots, sketches, or spreadsheets
1. From the Tools menu, select Options, and click the Display tab. Ensure that the Show equation labels check box is selected.
2. From the Format menu, select Labels. Ensure that Execution Group is selected.
Figure 3.1: Inserting an Equation Label
Figure 3.2: Equation Label
To apply equation labels:
1. Enter an expression and press Enter. Note that the equation label is dis-played to the right of the answer in the document.
2. In a new execution group, enter another expression that will reference the output of the previous execution group.
3. From the Insert menu, select Label. Alternatively, press Ctrl+L ( Com-mand+L, for Macintosh) to open the Insert Label dialog. Enter the label number in the Insert Label dialog and click OK. The item is now a label.
To change the format of equation labels:
• Select Format →Labels → Label Display. In the Format Labels dia-log, select one of the numbering schemes.
• Optionally, enter an appropriate numbering prefix.
Figure 3.3: Format Labels Dialog: Adding a Prefix
The Label Reference menu item allows you to switch between the label name and its reference content. Place the cursor on the referenced equation label and select Format → Labels → Label Reference.
Figure 3.4: Label Reference
3.3 Accessing Help with Commands
and Packages
Most command names in Maple are quite intuitive, but if you are unable to determine the command or proper syntax you need, you can search the Maple help system. The Maple help system is complete with help pages for every command available, along with tours, examples, and a mathematical diction-ary. Each help page contains the correct syntax for a command: calling se-quences, parameters, and description of use. See Figure 3.5. Examples and links to related subjects are provided at the bottom of each help page.
To launch the Help browser:
1. You can launch the Maple help browswer in three ways:
• From the Help menu in your worksheet, select Maple Help
• Click in the toolbar
• In the document or worksheet, enter ?topicname. For example, enter
?LinearAlgebra and then press Enter.
To search the help system:
2. In the left pane, enter a search string in the text region provided.
3. By default, a topic search is performed. To perform a text search, select the Text radio button. For more information on topic searches, see Using the Help Navigator (page 67).
4. Enter the term and click Search.
5. The left pane is populated with matches to your search term in the Search Results tab. With text searches, the help page with the highest number of instances that term appears in the help page displays first followed by the second highest and so forth.
For more information on the Maple Help system, see The Maple Help Sys-tem (page 65).
Figure 3.5: Search Results for Optimization
3.4 Viewing Maple Code in Document
Mode
In Document mode, content is created as a series of document blocks. Doc-ument blocks allow you to hide the syntax used to perform calculations, which in turn lets you focus on the concept presented instead of the command used to manipulate or solve the problem. Document blocks are typically collapsed to hide the Maple code, but these regions can also be expanded to reveal this code.
Document block regions are identified using markers that are located in a vertical bar along the left pane of the document. See Figure 3.6. In addition to document block boundaries, these markers (icons) indicate the presence of hidden attributes in the document such as annotations, bookmarks, and numeric formatting.
To activate markers:
From the View menu, select Markers. See Figure 3.6.
Figure 3.6: Document Block Markers
To view code in Document mode:
1. Place the cursor in a document block to be expanded.
2. From the View menu, select Expand Document Block.
Figure 3.7: Expanded Document Block
With the Document Block expanded, you can see the Maple command that was used to perform this calculation. In Figure 3.7, the solve command was used.
You will also notice a red prompt ( > ) before the original expression and the solve command. Entering commands outside of a document block region is done at this input region. To insert an input region, click the button in the toolbar menu.
In Figure 3.7, an equation label was used to refer to the expression. For more information, see Equation Labels (page 47).
To collapse a Document Block:
With your cursor inside the document block, select View →Collapse Doc-ument Block.
You can use this process of expanding document blocks to begin learning Maple commands.
3.5 Document Mode vs. Worksheet
Mode
Worksheet Mode and Document Mode are identical in the functionality that they both offer; therefore in each mode context menus and palettes are available when entering expressions; tables, spreadsheets, and images can be inserted; and access to the complete Maple library is available. You can even insert a document block while in Worksheet mode or insert a Maple prompt while in Document Mode. The only difference between the two modes is the default input format.
Table 3.1: Worksheet Mode vs. Document Mode
Worksheet Mode Document Mode
To start a worksheet session:
From the File menu, select New, and then
Worksheet Mode.
To start a document session:
From the File menu, select New, and then
Document Mode.
Default input region is a Maple input prompt. Default input region is a document block.
Syntax is displayed when using context menus. Syntax is hidden when using context
menus.
Worksheet Mode Document Mode
Context menus do not offer an option to evalu-ate and display an expression inline. All other context menu options are identical when using context menus in Document Mode.
3.6 Math Mode vs. Text Mode
The default mode of entry in Document or Worksheet mode is Math Mode which displays input in 2-D Math. In earlier releases of Maple, commands and expressions were entered using Maple Input or 1-D Math.
Important: With Maple Input, you must terminate commands with a semi-colon or semi-colon.
cos(alpha)^2+sin(alpha)^2; >
a*int(exp(sqrt(2)*x),x); >
limit(f(x),x=infinity); >
sum(a[k]*x^k, k=0..m)=product(b[j]*x^j, j=0..n); >
To enter input using Maple Input mode, insert a Maple prompt by clicking
Table 3.2: Math Mode vs. Text Mode
Text Mode* Math Mode
Executable Maple notation. This is also re-ferred to as 1-D Math Input or Maple Input.
Maple's default setting. Executable standard math notation. This is also referred to as 2-D Math Input.
Access from the Insert → Maple Input
menu. Access from the Insert → 2-D Math menu.
When entering Maple Input or text in a text region, the Text mode icon is highlighted in the toolbar.
When using 2-D Math, the Math mode icon is highlighted in the toolbar.
To convert a 1-D Math expression to 2-D Math, right-click the expression ( Command-click for Macintosh) and select Convert To
→2-D Math Input. To convert a 2-D Math expression to 1-D
Math, right-click the expression ( Com-mand-click for Macintosh) and select 2-D Math →Convert To→1-D Math Input.
All input must end with a semi-colon ( ; ) or a colon ( : ).
No termination symbol is required.
Using palettes while in 1-D Math teaches you the related Maple command syntax. If you are a new Maple user, palettes make
entering expressions in familiar notation easier than entering foreign syntax and re-duces the possibility of introducing typing errors.
* In a Document Block, Text Mode displays regular text.
To change math input notation for a session or globally across all docu-ments:
1. From the Tools menu, select Options. The Options Dialog opens.
2. Click the Display tab.
3. In the Input Display drop-down list, select Maple Notation.
4. Click the Apply to Session or Apply Globally button.
Important: The new input display becomes the default setting after selecting the Enter key.
3.7 Maple Toolbar Options
The Maple toolbar offers several buttons to assist you when interacting with Maple. See Table 3.3.
Table 3.3: Maple Toolbar Options
Equivalent Menu Option or Command Icon
Basic Usage
From the Insert menu, select Text. Insert Plain Text after the current
execution group.
From the Insert menu, select Execution Group and then After Cursor.
Insert Maple Input after the cur-rent execution group.
From the Format menu, select Indent. Enclose the selection in a
subsec-tion.
From the Format menu, select Outdent. Remove any section enclosing
the selection.
From the Edit menu, select Execute and then Worksheet.
Executes all commands in the worksheet or document
From the Edit menu, select Execute and then Selection.
Executes a selected area.
Equivalent Menu Option or Command Icon
Basic Usage
Enter restart.
Causes Maple to clear its intern-al memory.
From the View menu, select Zoom Factor
and then a zoom size. Adjusts the display size of
docu-ment content. Note: plots, spreadsheets, images, and sketches remain unchanged.
From the Help menu, select Maple Help. Opens the Maple help system.
For 1-D Math and text regions, the Tab icon in the toolbar allows you to set the Tab key to move between placeholders or to indent text.
Table 3.4: Tab Icon Description
Description Tab Icon
Tab icon off. Allows you to move between placeholders using the Tab
key.
Tab icon on. Allows you to indent in the worksheet using the Tab key.
The Tab icon is disabled when using 2-D Math (Math mode), and as such, the Tab key allows you to move between placeholders.
Toolbar icons are controlled by the location of the cursor in the document. For example, place the cursor at an input region and the Text and Math
icons are accessible while the others are greyed out. See Table 3.5 for a list of the tools available in each icon.
Table 3.5: Toolbar Icons and their Tools
Toolbar Icon Options
Text tools
Math tools
Drawing tools
Plot tools
Animation tools
Table 3.6: Toolbar Icon Availability
Available Tools Region
Text and Math icons Input region
Drawing and Plot icons Plot region
Drawing, Plot, and Animation icons Animation region
Drawing icon Canvas and Image regions
The Text and Math icons allow you to enter text and math in the same line by choosing the appropriate input style at each stage when entering the sen-tence.
The derivative of is
Using the tools available in these icons, you can customize the input style of the text and 2-D Math. For the Text and Math icons, the icon that is se-lected remains in that state until prompted otherwise; therefore if the Text
icon is selected and you press the Enter key, the new input region remains a Text region.
The Text and Math icons differ while at a Maple input prompt. The Math icon displays input as 2-D Math, whereas the Text icon displays Maple input.
>
x^2/2; >
To access the tools available in the Plot and Drawing icons, click a plot re-gion. The tools available in these icons allow you to manipulate the plot or draw shapes and enter text on the plot region. By clicking an animation re-gion, you have the same features available for a plot rere-gion, in addition to tools for playing the animation in the Animation icon.
For the remaining icons, hover the mouse over the icon to display the icon description.
3.8 Top Commands and Packages
After you have reviewed the contents of the first few chapters, you can scan the top Maple commands and packages (topics).
Table 3.7: Top Commands
Description Command Name
Create a two-dimensional and three-dimensional plot of functions.
plotand plot3d
Solve one or more equations or inequalities for their unknowns.
solve
Solve one or more equations using floating-point arithmetic.
fsolve
Evaluate an expression at a given point.
eval
Numerically evaluate expressions.
evalf
Solve ordinary differential equations (ODEs).
dsolve
Compute an indefinite or definite integral.
int
Compute an ordinary or partial derivative, as the context dictates.
diff
Calculate the limiting value of a function.
limit
For symbolic summation. It is used to compute a closed form for an indefinite or definite sum.
sum
Set variable properties and relationships between variables. Similar functionality is provided by the assumingcommand.
assume/is
Compute the value of an expression under assumptions.
assuming
Apply simplification rules to an expression.
simplify
Distribute products over sums.
expand
Normalize a rational expression.
normal
Convert an expression to a different type or form.
convert
Type-checking command. In many contexts, it is not necessary to know the exact value of an expression; it suffices to know that an expression belongs to a broad class, or group, of expressions that share some common properties. These classes or groups are known as types.
type
Description Command Name
Generalized series expansion.
series
Apply a procedure to each operand of an expression.
map
A complete list of top-level commands is available at Help → Manuals, Dictionary, and more → List of Commands.
Tab