UJI VALIDITAS DAN RELIABILITAS VARIABEL HARGA
Case Processing Summary
N %
Cases
Valid 30 100.0
Excludeda 0 .0
Total 30 100.0
a. Listwise deletion based on all variables in the
procedure.
Reliability Statistics
Cronbach's
Alpha
N of Items
.806 5
Item Statistics
Mean Std. Deviation N
x1_1 3.77 .858 30
x1_2 3.57 .898 30
x1_3 3.80 .610 30
x1_4 3.93 .785 30
X1_5 3.60 .814 30
Item-Total Statistics
Scale Mean if
Item Deleted
Scale Variance
if Item Deleted
Corrected
Item-Total
Correlation
Cronbach's
Alpha if Item
Deleted
x1_1 14.90 5.472 .692 .735
x1_2 15.10 5.266 .708 .729
x1_3 14.87 6.947 .519 .792
x1_4 14.73 5.926 .640 .754
UJI VALIDITAS DAN RELIABILITAS VARIABEL KUALITAS LAYANAN
Case Processing Summary
N %
Cases
Valid 30 100.0
Excludeda 0 .0
Total 30 100.0
a. Listwise deletion based on all variables in the
procedure.
Reliability Statistics
Cronbach's
Alpha
N of Items
.932 5
Item Statistics
Mean Std. Deviation N
x2_1 3.90 .845 30
x2_2 3.90 .923 30
x2_3 3.90 .960 30
x2_4 3.93 1.048 30
X2_5 3.83 .950 30
Item-Total Statistics
Scale Mean if
Item Deleted
Scale Variance
if Item Deleted
Corrected
Item-Total
Correlation
Cronbach's
Alpha if Item
Deleted
x2_1 15.57 12.392 .762 .927
x2_2 15.57 11.564 .832 .914
x2_3 15.57 11.495 .802 .920
x2_4 15.53 10.326 .922 .896
UJI VALIDITAS DAN RELIABILITAS VARIABEL PROMOSI
Case Processing Summary
N %
Cases
Valid 30 100.0
Excludeda 0 .0
Total 30 100.0
a. Listwise deletion based on all variables in the
procedure.
Reliability Statistics
Cronbach's
Alpha
N of Items
.787 3
Item Statistics
Mean Std. Deviation N
x3_1 3.73 .691 30
x3_2 3.83 .986 30
x3_3 3.90 1.094 30
Item-Total Statistics
Scale Mean if
Item Deleted
Scale Variance
if Item Deleted
Corrected
Item-Total
Correlation
Cronbach's
Alpha if Item
Deleted
x3_1 7.73 3.926 .424 .896
x3_2 7.63 2.171 .835 .457
UJI VALIDITAS DAN RELIABILITAS VARIABEL KEPUASAN KONSUMEN
Case Processing Summary
N %
Cases
Valid 30 100.0
Excludeda 0 .0
Total 30 100.0
a. Listwise deletion based on all variables in the
procedure.
Reliability Statistics
Cronbach's
Alpha
N of Items
.951 7
Item Statistics
Mean Std. Deviation N
x4_1 3.80 .714 30
x4_2 3.87 .900 30
x4_3 3.67 .802 30
x4_4 3.80 .887 30
X4_5 3.83 .834 30
X4_6 3.57 1.135 30
X4_7 3.73 .828 30
Item-Total Statistics
Scale Mean if
Item Deleted
Scale Variance
if Item Deleted
Corrected
Item-Total
Correlation
Cronbach's
Alpha if Item
Deleted
x4_1 22.47 23.085 .842 .945
x4_2 22.40 21.421 .858 .942
x4_3 22.60 23.076 .734 .952
x4_4 22.47 21.637 .843 .943
X4_5 22.43 21.978 .857 .942
X4_6 22.70 19.045 .913 .940
UJI VALIDITAS DAN RELIABILITAS VARIABEL PEMBELIAN
Case Processing Summary
N %
Cases
Valid 30 100.0
Excludeda 0 .0
Total 30 100.0
a. Listwise deletion based on all variables in the
procedure.
Reliability Statistics
Cronbach's
Alpha
N of Items
.866 6
Item Statistics
Mean Std. Deviation N
y_1 3.67 .802 30
Item-Total Statistics
Scale Mean if
Item Deleted
Scale Variance
if Item Deleted
Corrected
Item-Total
Correlation
Cronbach's
Alpha if Item
Deleted
y_1 19.27 10.961 .593 .854
y_2 19.23 11.771 .573 .858
y_3 19.10 10.300 .753 .827
y_4 18.87 9.016 .811 .813
y_5 19.13 9.844 .699 .836
Descriptive Statistics
Mean Std. Deviation N
Pembelian (Y) 23.01 3.800 98
Harga (X1) 18.50 3.565 98
Kualitas Layanan (X2) 19.49 4.150 98
Promosi (X3) 11.66 2.247 98
Kepuasan Konsumen (X4) 26.31 5.687 98
Variables Entered/Removeda
Model Variables Entered Variables
Removed
Method
1
Kepuasan Konsumen (X4),
Promosi (X3), Harga (X1),
Kualitas Layanan (X2)b
. Enter
a. Dependent Variable: Pembelian (Y)
b. All requested variables entered.
Model Summary
Model R R Square Adjusted R
Square
Std. Error of the
Estimate
1 .844a .712 .700 2.082
a. Predictors: (Constant), Kepuasan Konsumen (X4), Promosi (X3), Harga
(X1), Kualitas Layanan (X2)
ANOVAa
Model Sum of Squares df Mean Square F Sig.
1
Regression 998.051 4 249.513 57.589 .000b
Residual 402.939 93 4.333
Total 1400.990 97
a. Dependent Variable: Pembelian (Y)
Coefficientsa
Model Unstandardized
Coefficients
Standardized
Coefficients
t Sig.
B Std. Error Beta
1
(Constant) 5.010 1.229 4.075 .000
Harga (X1) .311 .096 .292 3.226 .002
Kualitas Layanan (X2) .225 .086 .245 2.607 .011
Promosi (X3) .348 .151 .206 2.314 .023
Kepuasan Konsumen (X4) .145 .062 .216 2.319 .023
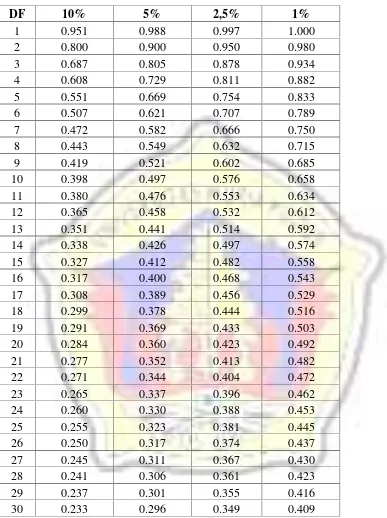
TABEL R
DF
10%
5%
2,5%
1%
1
0.951
0.988
0.997
1.000
2
0.800
0.900
0.950
0.980
3
0.687
0.805
0.878
0.934
4
0.608
0.729
0.811
0.882
5
0.551
0.669
0.754
0.833
6
0.507
0.621
0.707
0.789
7
0.472
0.582
0.666
0.750
8
0.443
0.549
0.632
0.715
9
0.419
0.521
0.602
0.685
10
0.398
0.497
0.576
0.658
11
0.380
0.476
0.553
0.634
12
0.365
0.458
0.532
0.612
13
0.351
0.441
0.514
0.592
14
0.338
0.426
0.497
0.574
15
0.327
0.412
0.482
0.558
16
0.317
0.400
0.468
0.543
17
0.308
0.389
0.456
0.529
18
0.299
0.378
0.444
0.516
19
0.291
0.369
0.433
0.503
20
0.284
0.360
0.423
0.492
21
0.277
0.352
0.413
0.482
22
0.271
0.344
0.404
0.472
23
0.265
0.337
0.396
0.462
24
0.260
0.330
0.388
0.453
25
0.255
0.323
0.381
0.445
26
0.250
0.317
0.374
0.437
27
0.245
0.311
0.367
0.430
28
0.241
0.306
0.361
0.423
29
0.237
0.301
0.355
0.416
Cuplikan Tabel t
0
No
10%
5%
2,5%
70
1.294
1.667
1.994
71
1.294
1.667
1.994
72
1.293
1.666
1.993
73
1.293
1.666
1.993
74
1.293
1.666
1.993
75
1.293
1.665
1.992
76
1.293
1.665
1.992
77
1.293
1.665
1.991
78
1.292
1.665
1.991
79
1.292
1.664
1.990
80
1.292
1.664
1.990
81
1.292
1.664
1.990
82
1.292
1.664
1.989
83
1.292
1.663
1.989
84
1.292
1.663
1.989
85
1.292
1.663
1.988
86
1.291
1.663
1.988
87
1.291
1.663
1.988
88
1.291
1.662
1.987
89
1.291
1.662
1.987
90
1.291
1.662
1.987
91
1.291
1.662
1.986
92
1.291
1.662
1.986
93
1.291
1.661
1.986
94
1.291
1.661
1.986
95
1.291
1.661
1.985
96
1.290
1.661
1.985
97
1.290
1.661
1.985
98
1.290
1.661
1.984
99
1.290
1.660
1.984
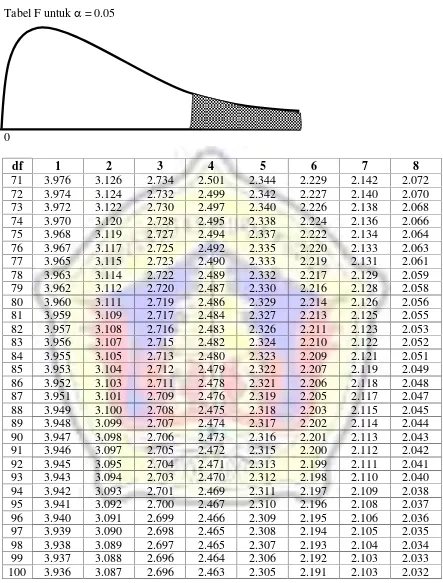
Tabel F untuk
= 0.05
0
df
1
2
3
4
5
6
7
8
Frekuensi Identitas Responden
Statistics
jenis kelamin Usia Pekerjaan
N
Valid 98 98 98
Missing 0 0 0
Frequency Table
jenis kelamin
Frequency Percent Valid Percent Cumulative
Percent
Valid
perempuan 28 28.6 28.6 28.6
Laki-laki 70 71.4 71.4 100.0
Total 98 100.0 100.0
Usia
Frequency Percent Valid Percent Cumulative
Percent
Valid
20-25 tahun 15 15.3 15.3 15.3
26-30 tahun 38 38.8 38.8 54.1
31-40 tahun 19 19.4 19.4 73.5
di atas 40 tahun 26 26.5 26.5 100.0
Total 98 100.0 100.0
Pekerjaan
Frequency Percent Valid Percent Cumulative
Percent
Valid
Lain-Lain 26 26.5 26.5 26.5
Karyawan Swasta 35 35.7 35.7 62.2
Wiraswasta/Pedagang 20 20.4 20.4 82.7
Pegawai Negeri 17 17.3 17.3 100.0
Frekuensi variabel harga
Statistics
x1_1 x1_2 x1_3 x1_4 X1_5 Harga (X1)
N Valid 98 98 98 98 98 98
Missing 0 0 0 0 0 0
Mean 3.63 3.59 3.72 3.89 3.66 18.50
Median 4.00 4.00 4.00 4.00 4.00 19.50
Mode 4 4 4 4 4 22
Sum 356 352 365 381 359 1813
Frequency Table
x1_1
Frequency Percent Valid Percent Cumulative
Percent
Total 98 100.0 100.0
x1_2
Frequency Percent Valid Percent Cumulative
Percent
x1_3
Frequency Percent Valid Percent Cumulative
Percent
Total 98 100.0 100.0
x1_4
Frequency Percent Valid Percent Cumulative
Percent
Total 98 100.0 100.0
X1_5
Frequency Percent Valid Percent Cumulative
Percent
Harga (X1)
Frequency Percent Valid Percent Cumulative
Percent
Valid
9 1 1.0 1.0 1.0
11 2 2.0 2.0 3.1
12 7 7.1 7.1 10.2
13 2 2.0 2.0 12.2
15 13 13.3 13.3 25.5
16 2 2.0 2.0 27.6
17 7 7.1 7.1 34.7
18 8 8.2 8.2 42.9
19 7 7.1 7.1 50.0
20 14 14.3 14.3 64.3
21 12 12.2 12.2 76.5
22 15 15.3 15.3 91.8
23 5 5.1 5.1 96.9
24 3 3.1 3.1 100.0
Frekuensi variabel kualitas layanan
Statistics
x2_1 x2_2 x2_3 x2_4 X2_5 Kualitas
Layanan (X2)
N Valid 98 98 98 98 98 98
Missing 0 0 0 0 0 0
Mean 3.77 3.89 3.95 3.96 3.93 19.49
Median 4.00 4.00 4.00 4.00 4.00 20.00
Mode 4 4 4 4 4 22
Sum 369 381 387 388 385 1910
Frequency Table
x2_1
Frequency Percent Valid Percent Cumulative
Percent
Total 98 100.0 100.0
x2_2
Frequency Percent Valid Percent Cumulative
Percent
x2_3
Frequency Percent Valid Percent Cumulative
Percent
Total 98 100.0 100.0
x2_4
Frequency Percent Valid Percent Cumulative
Percent
Total 98 100.0 100.0
X2_5
Frequency Percent Valid Percent Cumulative
Percent
Kualitas Layanan (X2)
Frequency Percent Valid Percent Cumulative
Percent
Valid
7 1 1.0 1.0 1.0
8 2 2.0 2.0 3.1
10 2 2.0 2.0 5.1
11 1 1.0 1.0 6.1
12 1 1.0 1.0 7.1
13 2 2.0 2.0 9.2
14 3 3.1 3.1 12.2
15 6 6.1 6.1 18.4
16 3 3.1 3.1 21.4
17 4 4.1 4.1 25.5
18 6 6.1 6.1 31.6
19 7 7.1 7.1 38.8
20 12 12.2 12.2 51.0
21 10 10.2 10.2 61.2
22 13 13.3 13.3 74.5
23 12 12.2 12.2 86.7
24 8 8.2 8.2 94.9
25 5 5.1 5.1 100.0
Frekuensi variabel promosi
Statistics
x3_1 x3_2 x3_3 Promosi (X3)
N Valid 98 98 98 98
Missing 0 0 0 0
Mean 3.73 3.92 4.01 11.66
Median 4.00 4.00 4.00 12.00
Mode 4 4 4 12
Sum 366 384 393 1143
Frequency Table
x3_1
Frequency Percent Valid Percent Cumulative
Percent
Total 98 100.0 100.0
x3_2
Frequency Percent Valid Percent Cumulative
Percent
x3_3
Frequency Percent Valid Percent Cumulative
Percent
Valid
1 2 2.0 2.0 2.0
2 3 3.1 3.1 5.1
3 16 16.3 16.3 21.4
4 48 49.0 49.0 70.4
5 29 29.6 29.6 100.0
Total 98 100.0 100.0
Promosi (X3)
Frequency Percent Valid Percent Cumulative
Percent
Valid
5 1 1.0 1.0 1.0
6 1 1.0 1.0 2.0
7 4 4.1 4.1 6.1
8 4 4.1 4.1 10.2
9 8 8.2 8.2 18.4
10 8 8.2 8.2 26.5
11 12 12.2 12.2 38.8
12 20 20.4 20.4 59.2
13 18 18.4 18.4 77.6
14 16 16.3 16.3 93.9
15 6 6.1 6.1 100.0
Frekuensi variabel Kepuasan Konsumen
Statistics
N Mean Median Mode Sum
Valid Missing
x4_1 98 0 3.84 4.00 4 376
Kepuasan Konsumen (X4) 98 0 26.31 27.00 28 2578
Frequency Table
x4_1
Frequency Percent Valid Percent Cumulative
Percent
Total 98 100.0 100.0
x4_2
Frequency Percent Valid Percent Cumulative
Percent
x4_3
Frequency Percent Valid Percent Cumulative
Percent
Total 98 100.0 100.0
x4_4
Frequency Percent Valid Percent Cumulative
Percent
Total 98 100.0 100.0
X4_5
Frequency Percent Valid Percent Cumulative
Percent
X4_6
Frequency Percent Valid Percent Cumulative
Percent
Valid
1 5 5.1 5.1 5.1
2 8 8.2 8.2 13.3
3 22 22.4 22.4 35.7
4 41 41.8 41.8 77.6
5 22 22.4 22.4 100.0
Total 98 100.0 100.0
X4_7
Frequency Percent Valid Percent Cumulative
Percent
Valid
1 2 2.0 2.0 2.0
2 9 9.2 9.2 11.2
3 15 15.3 15.3 26.5
4 59 60.2 60.2 86.7
5 13 13.3 13.3 100.0
Kepuasan Konsumen (X4)
Frequency Percent Valid Percent Cumulative
Percent
Valid
12 2 2.0 2.0 2.0
13 1 1.0 1.0 3.1
14 3 3.1 3.1 6.1
16 4 4.1 4.1 10.2
17 1 1.0 1.0 11.2
18 1 1.0 1.0 12.2
19 2 2.0 2.0 14.3
21 5 5.1 5.1 19.4
22 4 4.1 4.1 23.5
23 1 1.0 1.0 24.5
24 4 4.1 4.1 28.6
25 1 1.0 1.0 29.6
26 12 12.2 12.2 41.8
27 10 10.2 10.2 52.0
28 14 14.3 14.3 66.3
29 5 5.1 5.1 71.4
30 3 3.1 3.1 74.5
31 6 6.1 6.1 80.6
32 5 5.1 5.1 85.7
33 6 6.1 6.1 91.8
34 8 8.2 8.2 100.0
Frekuensi variabel pembelian
Statistics
N Mean Median Mode Sum
Valid Missing
y_1 98 0 3.72 4.00 4 365
Pembelian (Y) 98 0 23.01 24.00 26 2255
Frequency Table
y_1
Frequency Percent Valid Percent Cumulative
Percent
Total 98 100.0 100.0
y_2
Frequency Percent Valid Percent Cumulative
Percent
y_3
Frequency Percent Valid Percent Cumulative
Percent
Total 98 100.0 100.0
y_4
Frequency Percent Valid Percent Cumulative
Percent
Total 98 100.0 100.0
y_5
Frequency Percent Valid Percent Cumulative
Percent
26
y_6
Frequency Percent Valid Percent Cumulative
Percent
Total 98 100.0 100.0
Pembelian (Y)
Frequency Percent Valid Percent Cumulative
Percent