CHAPTER III RESEARCH METHOD
In this chapter, thewriter describes research type, research design, place of the study, population and sample of the study, instrument of study, research instrument validity, research instrument reliability, data collection procedures, and data analysis.
A.Research Type
The type of the research was quantitative research. It was because the writer wanted to investigate the effect of K-W-L Strategy on students’ reading scores. experimental design was used in the present study. Quasi-experimental designs are similar to randomized Quasi-experimental designs in that they involvemanipulation of an independent variable but differ in that subjects are not randomlyassigned to treatment groups. Because the quasi-experimental design doesnot provide full control. It is extremely important that writer be aware of thethreats to both internal and external validity and consider these factors in theirinterpretation.1
B.Research Design
The design of the study was experimental design using quasi-experimental design. Experimental design is a plan for an experiment that specifies theapplied
1
Donald Ary, Lucy Cheser, Jacobs, Chris Sorensen, Asghar Razavieh, Introduction ..., p.316.
independent variables, the number of levels of each, how subject are assigned to groups, and the dependent variable. The writer used quasi- experimental design since it was not possible to randomly assign subjects to treatment group.
In the present study, there were two classes. The first class was control group (CP). The second class was experiment group (EG) group which applied K-W-L Strategy. Groups were given pre-test and post-test to measure the result of
the students’ reading scores.
The treatment that used K-W-L strategy was given to the experiment group only. The description of the experiment is in the table below:
Table 3.1. The Description of Quasi-Experiment Design
Group Pre-test Treatment Post-test
EG
Y1 X Y2
CG Y1 - Y2
Where:
EG : Experiment Group CG : Control Group
X : Treatment using K-W-L Strategy Y1 : Pre-test
C.Variables of the Study
There were two variables of this study: 1. Independent variable
K-W-L strategy in teaching reading subject (X) 2. Dependent variable
The students’ reading scores (Y) D.Population and Sample
1. Population
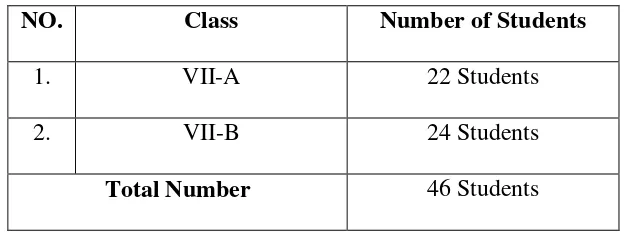
Population is the group to which a writer would like the results of a study to be able to generalize. In the present study, the population of the study was all of the seventh grade students at SMP Al-Amin Palangka Raya. The number of the population was46 students. The writer took all students of two classes as the sample of the study. They were class (VII-A) which consisted of 22 students and class (VII-B) which consisted of 24 students. Therefore, it was called research population.
Table 3.2 The Population of Study
NO. Class Number of Students
1. VII-A 22 Students
2. VII-B 24 Students
2. Sample
Sample is subset of Individuals or case from within a population.2The writer choseall of the population as sample, because the total number of the populationwas 46 students from two classes of the seventh grade students at SMP Al-Amin Palangka Raya. So, this research was also determined as the population research. The population sampling was used in this study. Based on that case, the writer determined the class of experiment and control group by two classes at the seventh grade students at SMP Al-Amin Palangka Raya to be experiment or control group classes.
The sample of the study is as shown in the following table: Table 3.3 The Sample of Study
NO. Classes Groups Number of Students
1. VII-A Experiment Group 22 Students
2. VII-B Control Group 24 Students
Total Number of Sample 46 Students
The writer chose the class as the sample for some reasons. Frist, the syllabusof the school showed that the material was given in class VII. Second, the students were difficult to read the text. Third, the English teacher wanted to know the effect of K-W-L strategy on students’ reading scores.
2
E.Research Instrument
The data wasneeded to prove and support in this study. By this collecting data, the writer could measure the effect of K-W-L strategy toward reading comprehension of the seventh grade students at SMP Al-Amin Palangka Raya. There were two instruments in this research, namely test and documentation. The schedule to get the data is available in appendix 10.
1. Test
A test is a set of stimuli presented to an individual in order to elicit responses on the basis of which a numerical score can be assigned. This score, based on a representativesample of the individual’s behavior, is an indicator of the extent to which thesubject has the characteristic being measured.3The writer used
a test as an instrument to collect data of this study because the students’ reading
scores could be known by using test.
The writer collected the data of this study by using a test. The result of the test was used to measure the students’ reading scores on descriptive text. According to level of comprehension, this test was constructed in literal level 70%, and Inferential level 30%. The test in this study was multiple choice test item which consists of 30 items for pre-test and 30 items for post-test. The test item was showed in appendix and adapted from some books, as follow:
Through the World English for SMP/MTS Class VII by Nanik Retnowati,
Publisher: Arya Duta,2007, Depok: Indonesia
3
Bahasa Inggris untuk SMP/MTS Kelas VII Semester 2 by Sulistiani, S.S
Publisher: PT Pratama Mitra Aksara, Karanganyar: Indonesia.
The reason why the test item is constructing in multiple choice form is because multiple choice is objective test. Objective test are frequently criticized on the ground that they are simpler to answer than subjective examinations. Item in objective test, however, can be made just as easy or as difficult as the test constructor wishes. Beside of having the strength, a test in form of multiple choices also has a weakness. Multiple choice test type encourages guessing. It can be solved by doing try out of the test items to find out the test validity and reliability.4
a. Scoring Rubric
Indicator Assessment
Technique Instrument Example
Students read descriptive
Result = Maximal score X correct answer Number of items
b. Aspect of Scoring
In connection with the score of students test, the writerused the following table as scoring.
Table 3.4 Aspect of scoring for students Reading Comprehension.5
No. Categories Scoring
1 Excellent 85-100
2. Good 70-84
3. Enough 60-69
4 Less 50-59
2. Documentation
The writer used documentation as the second instrument of the study.
Arikunto’s opinion states that “there are three kinds of source namely paper,
place, and people. This technique was used to collect the data in the form of document on the study place. The data that was needed such as:
a) The amount, the name, and the student’s registration number of the school b) The syllabus of reading subject
c) The student’s score of reading
The writer got all the data above, it was classify the students that was would be the subject of the test and the students tried out. The writer took some photos
5
when tried out and the test was conducted. The data above is available in appendix.
3. Instrument of Try Out
To know the reliability, validity and level of difficulties of the test, writerwas performed the try out. The writer chose the different school to test the try out. The writergave try-out to the Seventh grade students of MTS RaudhatulJannahPalangka Raya. The number of students were 25.The try out test conducted for two times with the same class. The first try out test conducted on February 21st 2015, it was as try out for pre-test. Second try out test conducted on February 26th 2015, it was as try out for post-test. The test was students’ reading comprehension score in multiple choice test form with the same level and content for the try out for pre-test and post-test. There were 50 items test for pre-test and post-test. The result of the try out test for pre-test and post-test was there were 20 items was invalid and there were 30 items was valid. The writer used 30 items to give the pre-test and post-test. The instrument is available in appendix.
1. Research Instrument Validity
1. Content Validity
According to Heaton, content validity is:
Kinds of validity depends on a careful analysis of the being test and the particular course objective. The test should be as constructed as contain a representative sample of the course, the relationship between the test item and the course objectives always being apparent.6
In this study, the writer usedmultiplechoiceitem tests for students. It is useful to measure their reading comprehension thematerial should be test is about descriptive text, it contains generic structure and language features.The contents of test items were then show in the following table:
Table 3.5Content Specificationof Items Research Instruments
Skill to measure Level of comprehension
From the table above, it was shown that the test items content of 100 items each pre-test 50 and post test 50 item. The percentage of level of comprehension was 70% of literal questions and 30% of inferential questions. The result is available in appendix 4.
To measure the validity of the instrument, the writer used the formulation of Product Moment by Pearson as follows:7
r
xy=
𝐍𝚺𝐗𝐘−(𝚺𝐗)( 𝚺𝐘)
√{𝐍𝚺𝐗²−(𝚺𝐗) ²}{𝐍𝚺𝐘²−(𝚺𝐘) ²}
Where:
rxy : Total coefficient of correlation
ΣX : Total Value of Score X
ΣY : Total Value of Score Y
ΣXY : Multiplication Result between Score X and Y
N : Number of students
To know the level of validity of instrument, the value of was interpreted based on the qualification of validity as follows:
rxy>t-table = Valid
rxy<t-table= Not Valid
The writer analyzed the data using Pearson Product Moment calculation manually.Then, re-check the manual calculation using Microsoft Excel program.
The analysis is available in appendix 5.
7
2. Construct Validity
This type of validity assumes the existence of certain learning theories or
constructing underlying the acquisition of abilities and skills. If a test has
construct validity, it is capable of measuring certain specific characteristic in
accordance with a theory of language behavior and learning. Construct
validity refers to the extent to which operational of a construct (e.g. practical tests
developed from a theory) do actually measures what the theory says they do.
The tests would be based on the syllabus in making. The test will be refers to scope and limitation of the study. The test is about descriptive text, reading literacy (Literal) and reading interpretative (inferential) which is refers to Junior High School students. The item test is suitable to the syllabus of the seventh grade students of SMP AL-AMIN Palangka Raya. It is available in appendix 1.
2. Research Instrument Reliability
Reliability refers to the consistency of test score. It means how consistent test scores or other evaluation results are from one measurement to another.8 Basically there are three basic methods and the type of information each provides are as follow:
a. Test–Retest method, which indicates the stability of test scores over some given period of time.
b. Equivalent forms method, which indicates the consistency of test scores over different forms of the test.
8
c. Internal consistency method, which indicates the consistency of test scores over different parts of the test.
The steps in determining the reliability of the test were: a) Making tabulating of tester’s scores.
b) Measuring the mean of the testers’ scores with the formula :
M= 𝑿 𝑵x100
c) Measuring the total variants with the formula:
S2= 𝑿
= the square of score total N = the number of testers
d) Calculating the instrument reliability using KR-21.
r11=𝒌−𝟏𝒌 𝟏 −𝑴 𝒌−𝑴 𝒌
.𝑺𝟐
Where:
r11= Reliability of instrument k = the number of items
M = the mean score for all the testers S2 = the standard deviation of the test score
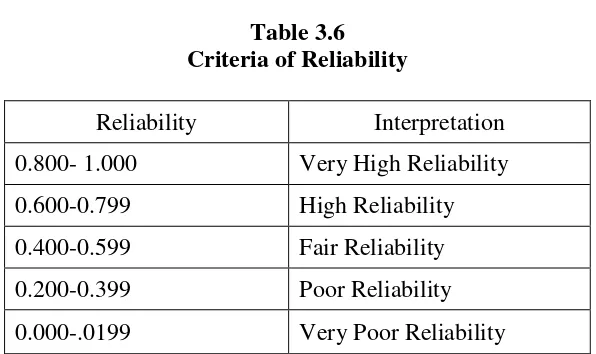
f) To know the level of reliability of instrument, the value of r11was interpreted based on the qualification of reliability as follows:
r11>Ttable= Reliable r11 <Ttable= Not Reliable
Table 3.6 Criteria of Reliability
Reliability Interpretation 0.800- 1.000 Very High Reliability 0.600-0.799 High Reliability 0.400-0.599 Fair Reliability 0.200-0.399 Poor Reliability 0.000-.0199 Very Poor Reliability
The result of reliability test was 0.85259594. Based on criteria of reliability above, the interpretation was Very High reliability. Then, re-check the
manual calculation using Microsoft Excel program.The analysis is available in
4. Data Collecting Procedure
Figure 3.1 Data Collecting Procedure
Teaching Reading Descriptive text using K-W-L Strategy On The Seventh Grade Students of SMP Al-Amin
Palangkaraya
Pre-test
Experiment Group (EG)
Control Group (CG)
Teaching Without K-W-L Strategy Teaching using
K-W-L Strategy
Discussion and Conclusion Analyzing The Data Using T-test
Based on the figure above, the data collecting procedure was explainedas follows:
1. The writer observed the classes. The writer directly did observation in the field where the place was taken. It was done to observe the class condition in learning English, to know how the students’ attitude while teaching learning process was going on.
2. The observation was purposed to get specific data, they were: a. The general description of the location of the study. b. The syllabus and lesson plan of the school.
c. The number of class.
d. The number of students and students’ name e. The number of the English Teacher.
f. The process of teaching learning English. The writer did it once. 3. Grouping the students into experimental group and control group. 4. Giving pre-test to the experimental group and control group.
5. Teaching English Reading for three times to students in the experimental group by implementing the K-W-L strategy and teach English reading to students in the control group without by implementing the K-W-Lstrategy. It supported with lesson plan. ( see appendix 2)
6. Giving post-test to the experimental group and control group. 7. Analyzing the data using T-test.
5. Data Analysis Procedure
The data of this study were students’ reading ability score. Therefore, the
data were quantitative. The pretest and post-test raw score were converted into percentages (see appendix 8). In order to analyze the data that had been collected. The mean, standard deviation and standard error of students’ score be computed for the pretest and post-test scores of the experiment and control groups. The writer used statistical ttest to answer the problem of the study. In Order to analyze
the data, the writer did some way procedures:
1. Gave the tests to the students of the seventh grade students at SMP Al-Amin Palangka Raya.
2. Collected the data of the students’ worksheet tests result. 3. Gave score to the students’ test result by using formula:
𝑆𝑐𝑜𝑟𝑒= 𝐵
𝑁 × 100%
B : Frequency of the correct answers N : Number of test items
4. Tabulated the students’ score into distribution of frequency in the table, then
find out the mean of students’ score, standard deviation, and standard error of
variable X 1 (Experiment Group) and X 2 (Control Group). 5. Normality Test
6. Homogeneity Test
It isusedtoknowwitherexperimentalgroupandcontrolgroup, thatweredecided,comefrompopulationthathasrelatively samevariantor not. 7. Calculated the data by using T-test to test the hypothesis of the study, whether
the use K-W-L Strategy give effect to the students reading score or not. To examine the hypothesis, the writer used T-test. T-test is statistical test which is used to examine the truth or falseness of null hypothesizes states that between two of Sample Mean taken randomly from the same population, there is no significant different.9 T-test is used to measure whether K-W-L Strategy give effect to the students reading descriptive text score using formula as follows:10
to= To know the hypothesis is accepted or rejected using the criterion:
If t-test (the value) ≥ ttable, it means Ha is accepted and Ho is rejected. If t-test (the value) ≤ ttable, it means Ha is rejected and Ho is accepted.
8. Interpreted the result of t-test. Previously, the writer counted the degrees of freedom (df) with the formula:11
df = (N1 + N2– 2)
9
AnasSudijono, PengantarStatistikPendidikan, Jakarta: Raja GrafindoPersada, 1987, p.278 10
Ibid, p. 284. 11
Note:
df : degrees of freedom
N1 : Number of subject group 1
N2 : Number of subject group 2
2 : Number of variables
After that, the vvalue of ttest is consulted on the ttableat the level of significance
1% and 5%. In this research, the writer used the level of significance at 5%. If the result or t-test is higher than ttable, it means Ha is accepted.
9. The writer made the conclusion of data analysis obtained.