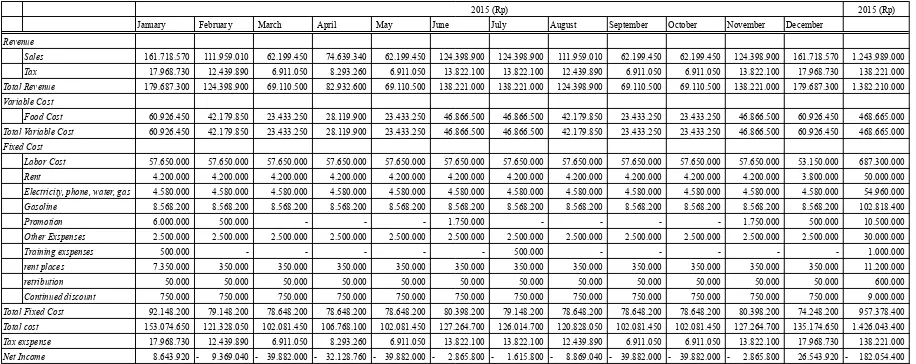
7.6. Arus Kas
Tabel 7.12.
Cashflow Projection
2015
2015 (Rp)
January February March April May June July August September October November December
Sales 161.718.570 111.959.010 62.199.450 74.639.340 62.199.450 124.398.900 124.398.900 111.959.010 62.199.450 62.199.450 124.398.900 161.718.570 1.243.989.000
Tax 17.968.730 12.439.890 6.911.050 8.293.260 6.911.050 13.822.100 13.822.100 12.439.890 6.911.050 6.911.050 13.822.100 17.968.730 138.221.000 179.687.300
124.398.900 69.110.500 82.932.600 69.110.500 138.221.000 138.221.000 124.398.900 69.110.500 69.110.500 138.221.000 179.687.300 1.382.210.000
Food Cost 60.926.450 42.179.850 23.433.250 28.119.900 23.433.250 46.866.500 46.866.500 42.179.850 23.433.250 23.433.250 46.866.500 60.926.450 468.665.000
60.926.450
42.179.850 23.433.250 28.119.900 23.433.250 46.866.500 46.866.500 42.179.850 23.433.250 23.433.250 46.866.500 60.926.450 468.665.000
Labor Cost 57.650.000 57.650.000 57.650.000 57.650.000 57.650.000 57.650.000 57.650.000 57.650.000 57.650.000 57.650.000 57.650.000 53.150.000 687.300.000
Rent 4.200.000 4.200.000 4.200.000 4.200.000 4.200.000 4.200.000 4.200.000 4.200.000 4.200.000 4.200.000 4.200.000 3.800.000 50.000.000
Electricity, phone, water, gas 4.580.000 4.580.000 4.580.000 4.580.000 4.580.000 4.580.000 4.580.000 4.580.000 4.580.000 4.580.000 4.580.000 4.580.000 54.960.000
Gasoline 8.568.200 8.568.200 8.568.200 8.568.200 8.568.200 8.568.200 8.568.200 8.568.200 8.568.200 8.568.200 8.568.200 8.568.200 102.818.400
Promotion 6.000.000 500.000 - - - 1.750.000 - - - - 1.750.000 500.000 10.500.000
Other Exspenses 2.500.000 2.500.000 2.500.000 2.500.000 2.500.000 2.500.000 2.500.000 2.500.000 2.500.000 2.500.000 2.500.000 2.500.000 30.000.000
Training exspenses 500.000 - - - - - 500.000 - - - - - 1.000.000
rent places 7.350.000 350.000 350.000 350.000 350.000 350.000 350.000 350.000 350.000 350.000 350.000 350.000 11.200.000
retribution 50.000 50.000 50.000 50.000 50.000 50.000 50.000 50.000 50.000 50.000 50.000 50.000 600.000
Continued discount 750.000 750.000 750.000 750.000 750.000 750.000 750.000 750.000 750.000 750.000 750.000 750.000 9.000.000
92.148.200
79.148.200 78.648.200 78.648.200 78.648.200 80.398.200 79.148.200 78.648.200 78.648.200 78.648.200 80.398.200 74.248.200 957.378.400
153.074.650
121.328.050 102.081.450 106.768.100 102.081.450 127.264.700 126.014.700 120.828.050 102.081.450 102.081.450 127.264.700 135.174.650 1.426.043.400
17.968.730
12.439.890 6.911.050 8.293.260 6.911.050 13.822.100 13.822.100 12.439.890 6.911.050 6.911.050 13.822.100 17.968.730 138.221.000
8.643.920
- 9.369.040 - 39.882.000 - 32.128.760 - 39.882.000 - 2.865.800 - 1.615.800 - 8.869.040 - 39.882.000 - 39.882.000 - 2.865.800 26.543.920 - 182.054.400
Sumber: Data diolah (2013)
139
Total Revenue2015 (Rp)
Revenue
Total cost
Net Income Total Fixed Cost