A Corporate Social Responsibility of Engineering the Liquidity-Adjusted
Capital Asset Pricing Modelling Sub-Sahara Africa:
Evidence from Ghana
Solomon Duduchoge
ab*,Yao Hongxing
a, Benjamin Chris Ampimah
c,
Prince
Harvim
caSchool of Finance and Economics, Jiangsu University, 301 Xuefu Road, Zhenjiang, P.R. China, bKoforidua Technical University, Koforidua, Box 891,Koforidua Ghana,
cFaculty of Science,Jiangsu University, 301 Xuefu Road, Zhenjiang, P.R. China [email protected],[email protected], [email protected],
Keywords: Corporate Social Responsibility, Liquidity Risk, Asset Pricing, Emerging Market, Sub– Sahara Africa.
Abstract. This paper estimates a conditional version of liquidity–adjusted capital asset pricing model in an emerging market in line with the corporate social responsibility (CSR) of the Ghana Stocks Exchange. We find out that for several years, Ghana stock market has been excluded from the global financial watch and from empirical verification model for lack of transparency in the performance of Exchange. Our evaluation concludes that illiquidity risk can be measured in the local market and exhibit a strong trend of mix reactions from liquidity premia.While the effect of the recent financial crisis do not show much difference between the different market conditions, the effect is more stronger in the down market than the up market. Finally, we explore the size effect on the market and conclude that the net beta as well as the systematic liquidity risk is pronounced in the smaller market though insignificant.
1. Introduction
Globally, issues concerning corporate social responsibility (CSR), liquidity with its associated marketability and trading cost has become the centre of attention to investors in the field of financial market. According to a standard definition (Paul and Siegel 2006) corporate social responsibility (henceforth CSR) defines a set of corporate practices which improve upon social and environmental regulatory standards of the markets in which such corporations operate. The KPMG International Survey on CSR reporting (KPMG 2008) documents that corporate responsibility information is released (in stand-alone reports or integrated with annual financial reports) by 80% of the constituents of the Global Fortune 250, up from 50% in 2005.In the modern world, a CSR is a shift from the maximization of an investor profit to a shareholders welfare. The question is whether the change in focus is the answer to the poor performance of stocks in Sub-Sahara Africa. As an example, the GSE recently engineered the operation of what it termed as the Ghana alternative Market in 2015 with a focus on businesses with a high potential for growth. The aim is to accommodate these companies at various stages of their development, including start-ups and existing ones, both small and medium with the aim of grooming them to become bigger in the future (GSE, 2015).
An opportunity to examine the nexus between the role of corporate social responsibility and corporate performance is to test the Liquidity-adjusted capital asset pricing modelthrough the performance of the Ghana stock exchange from 2006 to 2015.
It is important to stress the role play by liquidity when investing with the aim of maximising returns since it determines the marketability or otherwise of a stock. Liquidity is seen as one of the pivots on which investment stand as it is of a bigger concern to both local and international investors in emerging markets because of its cross-sectional and temporal variations (Bekaert et al., 2007).
Although, many of the existing literature focus on the US stock market to the detriment of most of the developing market, there is a an indication in recent times of many researchers focusing on other developed and emerging markets(e.g. Karolyi et al., 2012) .The total value of African stocks outside South Africa is only 0.6 per cent of all emerging-market stocks.
Sub-Saharan Africa (SSA) markets are the only ones that have not attracted the needed study, though not surprising since these markets were established not long ago. It is dominated with volatile but substantial returns which is crowded with different degrees of liquidity cost.(Wheeler, 1984; Mosley et al., 1995) document that Africa’s past problems were largely a function of structural and international factors and, as such, they are likely to continue.
In recent years however, many of the African countries have seen the establishment of financial stock markets as one of the surest way of galvanising the needed resources to embark on the journey of economic emancipation. However (Hearn & Piesse, 2009) document that Sub-Sahara Africa is a region made up of smaller, unregulated and a lack of proper governance system. These shortcomings and other factors make it impossible for the markets to make it to the regional equity market indices and is therefore excluded from the Global Emerging Market (GEM) portfolio funds (Hearn&Piesse, 2009). However, with only 11 stock markets operating in Sub-Sahara Africa by the end of 1997, the numbers have increased to more than 20 including one of the only sub regional stock exchanges in the world, linking eight French-speaking West Africa countries(Sally, 2013).Ghana’s stock market which was established in 1989 and started operation in 1990 was adjudged as the world’s best performing market at the end of 2004 with a year return of 144% in US dollar terms compared with a 30% return by Morgan Stanley Capital International Global Index (Databank Group, 2004).Even though the market is a G30 compliant, trade and prices are often agreed informally and the market institutions are merely being used to announce pre-agreed details(Akotey,2008).As stated by Bruce Hearn(2013),stock price, volatility, traded
volume and size (market capitalization) are all negatively associated with illiquidity in Ghana and other 11 west African countries with the exception of Cape Verde where size has a positive association with Lesmond zero (0.173) and Liu (0.520) measures.
Our paper contribute to the body of literature by looking at the effect of systematic liquidity risk on the Ghanaian market using the liquidity–adjusted capital asset model (LCAPM) propended by Acharya and Petersen (2005). To the best of our knowledge, our paper is the first to empirically carry out this task in the entire West Africa sub-region. Second, the study intends to verify the extent to which the price factor influences a smaller capitalist market like Ghana. Third, this paper examines the illiquidity risk factors and how they affect stock returns in Ghana.
The rest of this paper is organized as follows; in section 2, we present various hypothetical statements. Section 3 looks at the methodology and the research design. Section 4 discusses data and report summary statistics for the market and section 5 serves as the conclusion of the study.
2. Hypothesis
It is imperative to say that liquidity risk is a factor which influences investors due to its multifaceted effect on stock returns. The Ghanaian market though emerging has not been tested as compare to the US, Europe and other parts of Asia due to its size and unattractiveness. We intend to break this barrier by empirically investigating the relations between liquidity and asset pricing in Ghana. The US market is a quoted- driven one which is different from the simple continuous auction system in Ghana where bid and ask orders are written manually on a series of boards (Hearn and Piesse, 2011).The difference between the developed approach in the US and the makeshift approach in Ghana means that the impact of liquidity risk in both countries will not be the same. However, whether this assertion is the case will have to be subject to empirical assessment. We therefore assume the following hypothesis for the study:
3. The relation between market liquidity and Individual stock returns is negatively related to stock returns.
The three hypotheses stated above mainly relates to the liquidity risk in the LCAPM model of Acharya and Pedersen which is an addition to the traditional CAPM model. This theoretical model was empirically verified by Pastor and Stambaugh (2003).
We intend to know the combine systematic effect of the individual liquidity risk on a market-wide basis in the Ghanaian market. To this end, our stated next hypothesis is that
4. The combined liquidity risk is priced in Ghana.
It has been posited that Sub-Saharan African market is small and risky. To this end, our study intends to look into this using the Ghanaian market. This brings us to our next hypothesis which states that;
5. It is risky to invest in smaller market than in bigger market.
3.Research Design
3.1. Measuring Liquidity
Bruce Hearn (2013) in studying the West African terrain including Ghana adopted three liquidity measures to wit, the bid-ask spread of Jones (2002), zero daily return measure of Lesmond (1999) and Liu (2006) illiquidity measure. For the purpose of this study, we employ the Amihud (2002) illiquidity ratio as the basis for our measurement. This is in line with the price impact of Kyle (1985).
The ratio is described as:
, =
, ∑
, , , ,
, (1)
Where , , denotes absolute stock return of i on day d and month t. , , is the volume of trading for stock i on day d and of month t, and , is the sum of trading days for stock i and month t. The Amihud illiquidity measurement is premise on everyday trading on the stock market and it is measured on data from daily trading activities of returns on volume ratio. It is anticipated that a higher ratio of the Amihud illiquidity measure is assumed to be preceded by a lower liquidity. This means that investors will prefer to be compensated (normally called risk premium) for holding such securities in period of insecurity.
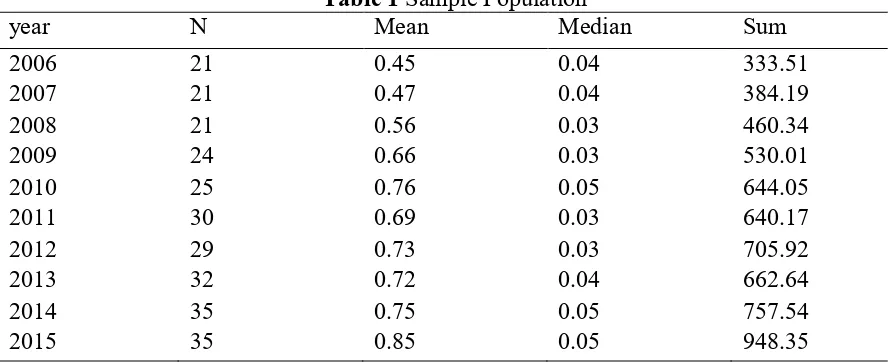
This is a summary of the sample population data that was gathered during the period from the GSE database showing the mean, median and the sum for the period under review.
Table 1 Sample Population
year N Mean Median Sum
2006 21 0.45 0.04 333.51
2007 21 0.47 0.04 384.19
2008 21 0.56 0.03 460.34
2009 24 0.66 0.03 530.01
2010 25 0.76 0.05 644.05
2011 30 0.69 0.03 640.17
2012 29 0.73 0.03 705.92
2013 32 0.72 0.04 662.64
2014 35 0.75 0.05 757.54
2015 35 0.85 0.05 948.35
3.2. Conditional LCAPM Model
CAPM and the LCAPM is the introduction of liquidity cost such as cost of a round trip, administrative cost etc. in the LCAPM as against a cost free CAPM. According to Acharya and Pedersen (2005),the standard CAPM hold for expected net returns(that is net of the relative illiquidity cost): ( − ).As a result, the conditional version of LCAPM is displayed at time
t as follows:
( ) = + + ( , + (( , ) + (( , ) + ( (( , ) (2)
Where ℎ Where is the gross return for stock i at month t, denotes gross risk-free rate, and represents the trading cost for stock i at month t. It is worth noting that, without the introduction of a cost element in the CAPM, equation 2 will be akin to the CAPM. By assuming conditional covariance, variance and equal risk premium across the different risk factors, an equivalent formulation of 3 is given − = + + − − (3)
Where the ’s in equation 3 denotes = ( , (4)
= (( , ) (5)
β3i= ( , ) ( (6)
β4i= ( , ) ( ( (7)
Where is the return of stocks i at month t, is the market return at month t, is the liquidity cost for stock i at month t, and is the market aggregate liquidity cost at month t. The net liquidity risk is given as = − − (8)
And the LCAPM net liquidity risk becomes: E ( − ) = + + (9)
And lastly, aggregate systematic risk is = + − − (10)
And the LCAPM becomes: E ( − ) = + + (11)
The Amihud Illiquidity ratio then becomes = + + +…+ (12)
We transform the Amihud illiquidity ratio where is the measure of liquidity for stock , is the number of lags included in the equation. − = + + + + + (13)
− = + + + + + + (14)
- = + + + + + + (15)
- = + + + + + + (16)
− = + + + + + + (17)
− = + + + + + + + + (19)
Where - indicates individual stock excess returns at month t+1 are the liquidity betas that are specified in equations (4) to (19), HLMt represents the High minus Low at month t, Sizetdenotes market capitalization at month t and is the cumulative returns over the past 12
months with a one lag.
Acharya and Pedersen, (2005); Lee, ( 2011) stated that equations (13) to (16) make it possible to determine what influence each individual liquidity risk, and moderate the multi-collinearity concerns for the betas. Equations (17) and (18) determine the aggregate liquidity risk effect and the aggregate systematic risks. Lastly, equation (19) investigates the joint effects of the liquidity betas.
3.3.Measuring Liquidity-Adjusted Capital Asset Pricing Model
In the light of Lee (2011), we construct portfolios for the LCAPM basically on the Ghanaian stock market with respect to market returns and illiquidity using panel regression. The intention for using the panel regression over others such as the cross-sectional regression is to avoid statistical bias that are known to be associated with it since it only accounts for correlation without accounting for serial correlation.
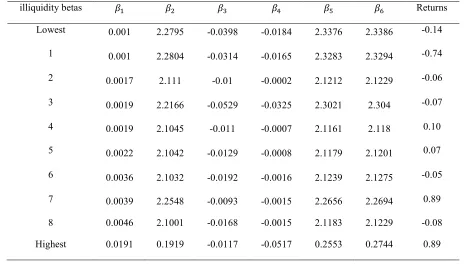
For Table 2, the illiquidity betas are measured based on equation 4 to 7 for ten portfolios which is basically in line with the Amihud (2002) illiquidity ratio by using the individual stocks and their respective market returns. In the construction of the illiquidity betas, we sort stocks into 10 equal parts and create 10 equally-weighted portfolios (deciles).Specifically, at the beginning of every year, illiquidity betas are calculated using the individual liquidity stocks as well as their respective market returns and create 10 equally weighted portfolios. The resultant outcome is the averages of these betas for each portfolio over the ten year period.
Table 2 Summary of illiquidity portfolio betas
illiquidity betas Returns
Lowest 0.001 2.2795 -0.0398 -0.0184 2.3376 2.3386 -0.14
1 0.001 2.2804 -0.0314 -0.0165 2.3283 2.3294 -0.74
2 0.0017 2.111 -0.01 -0.0002 2.1212 2.1229 -0.06
3 0.0019 2.2166 -0.0529 -0.0325 2.3021 2.304 -0.07
4 0.0019 2.1045 -0.011 -0.0007 2.1161 2.118 0.10
5 0.0022 2.1042 -0.0129 -0.0008 2.1179 2.1201 0.07
6 0.0036 2.1032 -0.0192 -0.0016 2.1239 2.1275 -0.05
7 0.0039 2.2548 -0.0093 -0.0015 2.2656 2.2694 0.89
8 0.0046 2.1001 -0.0168 -0.0015 2.1183 2.1229 -0.08
Highest 0.0191 0.1919 -0.0117 -0.0517 0.2553 0.2744 0.89
4. Empirical Results 4.1. Analytical Results
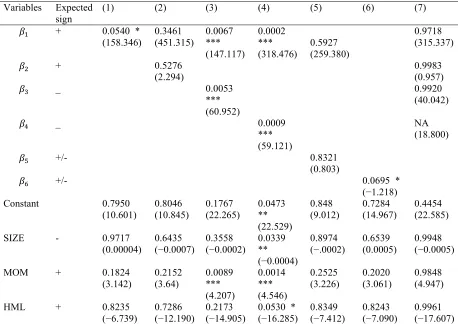
findings indicate that which shows the co-movement between the individual liquidity and market returns is highly insignificance in the presence of all the control variables such as the traditional , firm sizes, HML and momentum. This means that Hypothesis 1 which indicates that liquidity at the level of the firm and the market are positively related to returns, is insignificant in the Ghanaian situation as investors cannot rely on to predict the future outcome of events.
From table 3, we observe that is significant at the 1% level but with the wrong sign and thus rejecting Hypothesis 2 and rejecting the assertion by Acharya and Pedersen(2005) who documents that stocks whose returns are sensitive to market illiquidity are riskier and that investors require a higher return as a compensation for holding such assets. We belief that this assertion is not supported in the case of Ghana due to information asymmetry and the fact that most investors do not have access to the right information in the market. The result points to a phenomenon in which a decrease in liquidity level does not deter prospective investors from investing due to the lack of information concerning the true nature of the market. Table 3 also show the regress to be positive with 1% significant level. In the Ghanaian case, this again does not give support to the highly regarded Acharya and Pedersen (2005) assertion that investors are willing to accept lower return during period of meltdown. The results reject Hypothesis 3 which indicates that the relation between market liquidity and individual stock returns is negative. Having dealt with the implications of our analysis on the individual liquidity betas, we now turn our attention on the net as well as the aggregated liquidity betas. Both net liquidity and the systematic liquidity are all positively related to stock returns and more importantly, the systematic liquidity risk is priced though insignificant. In the final analysis, we can conclude that the Ghanaian market is full of variations and inconsistent with the literature even though systematic liquidity risk is insignificantly priced.
Table 3 The Panel regression fixed effect
4.2. The Size Effect
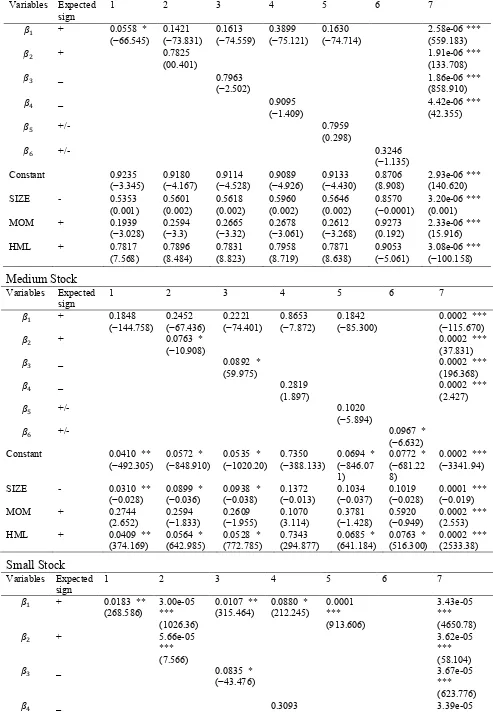
studies documented so far have proved that expected stock returns is negatively related to size (Fama and French,1992,Banz,1981,Chordia,2000).Limkriangkrai et al (2008) mentioned liquidity as being priced only in the smaller markets. He indicated that for smaller markets, the effect of liquidity is submerged in the size effect due to the higher cost of operation. However, others also defer in opinions on this issues. Fabre and Frino (2004) find that commonality in liquidity is mainly a large firm phenomenon. Having this in mind, we set out to find out the effect of size on liquidity in Ghana which is a lower middle income country. To do this, we sorted our data into three different groups with a ratio 30: 40:30 base on their market capitalization concurrently for each month.
The results from the analyses indicate that the market in Ghana is significant with respect to small size firms as oppose to the large as well as medium size groups as seen from table 4. From table 4, it is observe that the net liquidity and the market-wide liquidity are all carrying positive signs for the small size firms but with varying significant levels. In the case of the small firms, the net liquidity is highly significant with a 1% level of significance with the systematic liquidity β6 though significant but at the 10% level. However, in the case of the medium as well as the large size firms, only systematic liquidity carries a 10% level of significance. Regressing for smaller size firms produce some level of significance. It is also observe that and which are both positive and significant at 1% level in table 3 has it significance level varying to 10% for both medium and small firms in table 4. The conclusion that can be drawn from the net liquidity β5 and the aggregated liquidity β6 is that both remain significant in the smaller size group though the impact is minimal for the systematic liquidity β6. In effect, we can say that illiquidity risk is priced in the smaller firms in Ghana and confirm Hypothesis 4. The unit cost of production in smaller firms in Ghana carry some form of risk and investors need some form of compensation in order to invest their portfolios in such a risky market.
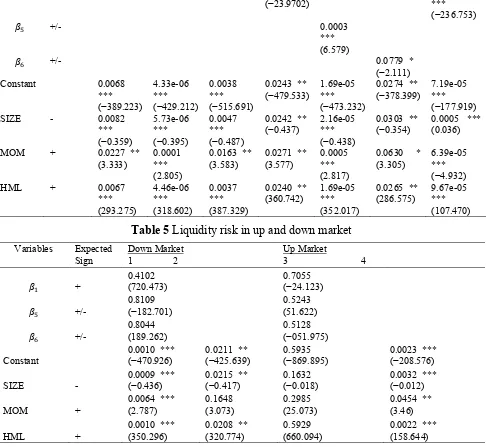
4.3. Illiquidity Effect during Different Market Situations
Asset pricing plays an important role during different market situations and may not exhibit either same or similar tendencies. Research documented so far indicates that stock returns behave differently during up and down market situations (Chiang and Zheng, 2010).The fact remains that, during down markets, price factors command more returns premiums as illiquidity is incorporated into asset pricing model(Brennan et al.,2011)
As a result, we decided to test the illiquidity risk with respect to returns in Ghana during different market scenario and see whether the resultant outcome will show some form of asymmetric effect during the period of up and down market situations. To do this, we grade the upward period from the year 2006 to 2008 and the meltdown period which span from 2009 to 2015.
(−23.9702) ***
Table 5 Liquidity risk in up and down market
Variables Expected
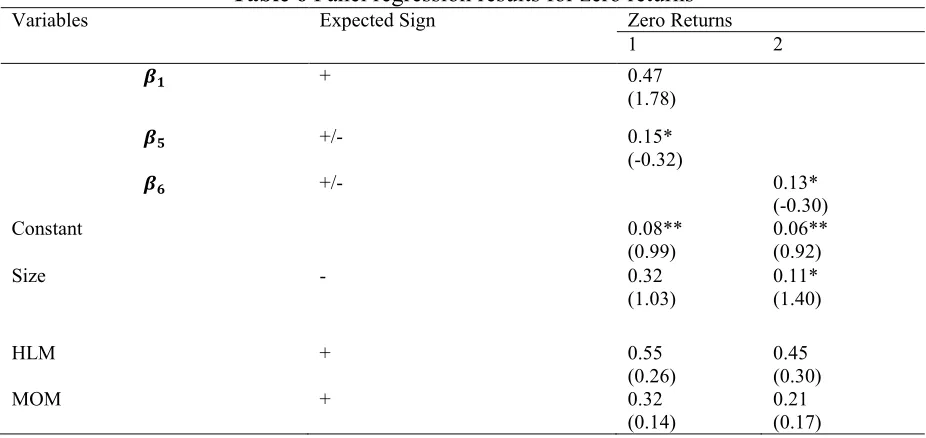
Several researchers often use different measures of liquidity to investigate the relations between liquidity and excess returns. This indicate that liquidity cannot be explain from one proxy.Brennan and Subrahmanyam(1996) use transaction cost as a measure of liquidity with Datar and Radcliffe(1998) using trading volume turnover as a proxy for the measurement of liquidity. The Amihud illiquidity ratio relies on the assumption that the percentage of the non-trading days is relatively low. However, when studying the West African terrain, Hearn and Piesse (2011) document that the greatest degree of illiquidity in the region can be seen in the BRVM and Ghana with Ghana having a percentage of daily zero returns of 77% for the entire market. Due to this, we use the Lesmond et al (1999) zero- return measurement as our proxy for this study. The zero return ratio explain and addresses the inherent concern of the Amihud ratio since it is able to capture the zero trading days in the Ghana situation.
Table 6 Panel regression results for zero returns
Variables Expected Sign Zero Returns
1 2
+ 0.47
(1.78)
+/- 0.15*
(-0.32)
+/- 0.13*
(-0.30)
Constant 0.08**
(0.99) 0.06** (0.92)
Size - 0.32
(1.03) 0.11* (1.40)
HLM + 0.55
(0.26) 0.45 (0.30)
MOM + 0.32
(0.14) 0.21 (0.17)
5.0. Conclusion
The entirety of this study examined the role play by liquidity in the pricing of asset in Ghana, an emerging market situated in West Africa which for several years has been excluded from the global market watch and from empirical valuation model. The Acharya and Pedersen LCAPM model is seen as one of the few models that can be used to study many forms of liquidity risk showing the relations between excess stock returns and illiquidity. Due to the volatility of the stock market in Ghana and the consistent high risk nature of the market, many investors do not have confidence in investing in the market and therefore demand a high form of compensation for the investment they make in the economy in the smaller and fragile market. We also find out that both the net liquidity beta and the systematic liquidity betas though positive are less stronger but have a greater influence in the down market than in the up market.We also find out that the effect of liquidity are not the same but keep varying across the different liquidity risk used in the analysis. The cost of equity in the market is also seen to be very high and the result makes it clear the depth and level of adherence to the proper regulations the entire stock market in the world and the volatile nature of the region. Overall, this study she some light and support for analysis.
Acknowledgement
The authors are very grateful for the financial support from the National Science Foundation of China with grant no. 71271103, 71371087. This work would not have been possible without their support. We are also grateful to the staff of the Ghana Stocks Exchange who provided the data for entire the work to be carried out. We also extend our appreciation to our colleagues whose suggestions enhanced the work. Finally, we cannot end without appreciating all those who contributed in divers ways in making the work complete.
References
[1] Acharya, V.V. and L.H. Pedersen (2005), 'Asset pricing with liquidity risk', J.Financ. Econ., 77 (2), 375-41.
[2] Akotey, A.J.(2007),Interview with Armah Akotey,Vice President of Investment, Data Brokerage Ltd, Accra, Ghana.23 December,2008.
[3] Amihud, Y. (2002), 'illiquidity and stock returns: cross-section and time –series effects', Journal of Financial Markets, 5, 31-56.
[5] Bekaert, G., Harvey, C.R., Lundblad, C., 2007.Liquidity and expected returns: lessons from Emerging Markets.Rev.Financ.Stud.20, 1783-1831
[6] Brennan, M.J., W. Huh and A. Subrahmanyam(2011), 'An analysis of the Amihud Illiquidity premium',Working paper,UCIA.
[7] Brennan M.J., and A. Subrahmanyam (1996), 'Market microstructure and asset pricing:on the compensation for illiquidity in stock returns',J.Financ. Econ,41 (3), 441-464.
[8] Chiang,T.C.and D. Zheng(2010), 'An empirical analysis and herd behavior in the global stock markets'. Journal of Banking and Finance, 34, 1911-1921.
[9] Chordia, T., R.Roll and A. Subrahmanyam(2000), 'Commonality in liquidity'.Journal of Financial Economics, 56, 3-2.
[10] Databank (2004). Epack Investment Fund Limited Annual Report, Ghana.
[11] Datar, V.T., Y.N. Naik and R. Radcliffe (1998), 'Liquidity and stock returns: an alternative test ‘J.Financ.Mark,1 (2), 203-219.
[12] Fabre, J., and A. Frino (2004), 'Commonality in liquidity: Evidence from the Australian stock exchange ', Account. Financ. 44 (3), 357-368.
Fama, E. F., and K. R. French (1992), 'the cross-section of expected stock returns’, Journal of Finance, 47,427–465.
[13] Hearn Bruce (2011)”Liquidity Estimation in African Emerging Markets’ School of Management, University of Leicester, and King’s College, London,
Hearn, B., Piesse, J., & Strange, R., (2009) market Liquidity and stock size Premia in Emerging Financial Markets: the implications for Foreign Investment. International Business Review, 16, special issue
[14] A., Lee, K.H.,van Dijk,M.,2012.understanding commonality in liquidity around the world.J. Financ. Econ.105,82-112.
[15] KPMG (2008) International survey of corporate responsibility reporting. http://www.kpmg.eu/docs/Corp_responsibility_Survey_2008.pdf
Kyle, A.S. (1985), 'Continuous auctions and insider trading', Econometrica, 5 3(6), 1315-1335. [16] Lee, K.H.(2011), 'The World price of liquidity risk', J.Financ.Econ.,99(1),136-161.
Lesmond,D.A., J.P. Orden and C.A. Trzcinka (1999), 'A new estimate of transaction costs',Rev.Financ.Stud.,12(5), 1113-1141.
[17] Limkriangkrai,M., R.B. Duran and I. Watson(2008), 'Is liquidity the missing link? 'Account.Financ., 48, 829-845.
[18] Liu,W. (2006), 'A liquidity-augmented capital asset pricing model',.J.Financ.Econ.,82 (3), 631-671.
[19] Mosley, P.Subusat;and Weeks ,J.,(1995)Assessing “adjustment in Africa World Development 23(9),1473.
[20] Pastor, l., and R.F. Stambaugh (2003), 'liquidity risk and expected stock returns', Journal of Political Economy, 111,642-685.
[21]Paul CM, Siegel D (2006) Corporate social responsibility and economic performance. J Prod Anal 3:207–211
[22] Sally,Farid(2013)Financial integration in African Emerging Markets.