Competition in the allocation of public spending: a new model to
analyse the interaction between expenditure categories
Julián Ramajoa,b, *, Miguel Márqueza,b, Francisco Pedrajaa, Javier Salinasa
a
Department of Applied Economics
University of Extremadura, Badajoz, E-06071, SPAIN b
Regional Economics Applications Laboratory (REAL) University of Illinois, Urbana-Champaign, IL 61801, USA
______________________________________________________________________
Abstract
Starting from the median voter model commonly used in the literature to analyse the determinants of the functional distribution of public spending, we propose a new multiproduct dynamic model that also allows one to classify the nature of the interaction –complementarity or substitutability– between the different categories of government expenditure.
As empirical application, we examine the pattern of public spending in Spain from 1990 to 1997. The results show that the basic determinants of the different items of expenditure are per capita income, population, the size of the public sector, and the presence of budget deficits, and that there are significant interdependencies between some components of the public expenditure.
JEL classification: H11, H50
Keywords: Composition of public spending; Functional classification of expenditure; Substitutability/complementarity.
______________________________________________________________________
___________
* Corresponding author. E-mail: [email protected]
1. Introduction
There exists a recent, but fertile literature on the influence on economic growth of the size and structure (of both income and expenditure) of the public sector1. In this sense, there have been several proposals of theoretical models to analyse under which conditions certain changes in the composition of taxation and public spending affect an economy's equilibrium growth rate (Barro, 1990; Barro and Sala-i-Martin, 1992; Cashin, 1995; Devarajan et al., 1996; Mendoza et al., 1997; Gemmell and Kneller, 2002; among others). Likewise, there have been some models developed in which both the taxation (Hettich and Winer, 1988) and the expenditure structures (Tridimas, 2001) result from a process of maximization on the part of the government, in which the objective function represents the expected electoral backing for the taxation and spending decisions that the government is thinking of making.
With respect to public budget structure, Sanz and Velázquez (2001) have recently analysed the process of convergence in the distribution by functions of public spending in different OECD countries. Their conclusion was that the significant harmonization in the functional distribution that took place in the 1970s came to a standstill in the following decades.
Two questions arise from the aforementioned studies. What factors determine the differences between countries in the functional distributions that are observed? And, for a given country, how have the spending structure evolved historically, what are the principal determinants of each function, and what is the observed pattern of complementarity-substitutability between the different budgetary items?
The first of these questions was addressed by Tanzi and Schuknecht (2000) and Sanz and Velázquez (2002), inter al. The former made a detailed analysis of the observed tendencies in the composition of the public spending of several countries during the XX century. And the latter analysed the main factors determining the differing functional composition of public spending observed in a sample of OECD countries in the period 1970-1997.
The present work addresses the second group of questions, proposing an empirical model that can be used in order to make explicit the nature of the interactions between
1
all expenditure components2. As an application, this model is used with reference to data for Spain's public administration sector from 1970 to 1997, analysing the factors that have determined the observed functional distribution in Spain's public spending in that period, and the nature of the relationship (whether competition or complementarity) between the various functions of that expenditure.
The article is structured as follows. Section 2 develops the model to use as the basis for the estimations: after describing the standard –static– model of demand for public services, this is extended to include the temporal evolution of the system describing each expenditure function's share in the total. The result is a new –dynamic– demand model that allows a simultaneous analysis of the effect of the moderating variables and of the relationship between the different types of expenditure. Section 3 presents details of the most significant results of the estimates made with this model applied to the Spanish economy. Finally, Section 4 gives the main conclusions of the work.
2. The theoretical and the empirical model
As in most studies of the demand for public services, the theoretical model that will be used as the point of departure is based on the median voter-taxpayer approach developed by Borcherding and Deacon (1972) and Bergstrom and Goodman (1973)3. In this model, the amount of public goods and services that taxpayers consume is basically a function of the per capita income of those demanding public spending, of the relative
2
Clements et al. (1998), Heller and Diamond (1990), Looney (1997) or Marlow and Shiers (1999) are examples of works that analyse the degree of complementarity or substitution between ‘some’ expenditure functions.
3 Although it has been most frequently applied to local government, the median voter model has been shown to be equally applicable at national level (see, for example, Ashworth, 1995; Gemmell et al., 1999). However, interpretation of empirical results is less straightforward than in the local case, because the application of the median voter model at local level is based on the fact that voters’ opinion is reflected in the allocation of public expenditure, as voter-consumers are well aware of the benefits and costs of public services. On the other hand, expenditure decisions at national level do not take into account voters’ opinion in such a degree, and such decisions might be influenced by other socio-political and institutional factors. Some results about the extent to which the empirical relevance of the median voter model diminishes at higher levels of administration can be found in Turnbull and Mitias (1999). Anyway, as applied to disaggregated analysis of spending, the median voter approach imposes some special restrictions on voter preferences that can limit its applicability (Riker and Ordeshook, 1973; Kramer, 1973; Romer and Rosentahl, 1979); although the empirical evidence shows that the median voter model is widely used as a very useful base for more elaborate models of public policy formation (see, for example, Congleton and Bennett (1995)).
price of public expenditure with respect to private sector goods, and of the size of the population. Specifically, the aggregate government expenditure demand function derived from individual voter-taxpayer consumption functions is:
γ β α
N P aY G= pc r
where γ =(β +1)(η−1)+η−2α, α and β are the income and price elasticities of
demand for general government provided good and services, respectively, η is the
degree of privatization of the public services, G is the total public spending in real terms, Ypc is the real per capita income, Pr the relative price of the public sector (defined by C/Px, C being the unit cost of G and Px the price of private goods), and N is the population.
Assuming that the total spending G may be disaggregated into n groups, and that
one has a function of type4 , for each expenditure function i=1,2,…,n,
then the proportion of public spending allocated to each expenditure group will be given by the expression
i i iP N
Y a Gi i pc r
γ β α =
γ γ β β α
α− − −
=
=G G a a Y i P i N i
wi i/ ( i/ ) pc r (1)
which is the basic (static) theoretical expression for the disaggregated demand for public services in terms of each expenditure function's share.
The theoretical relationship (1) can be made dynamic by applying the statistical support proposed by Marquez et al. (2003). Let the share of the i-th spending function
in total public spending at time t be . Then this model examines the possible forms
of interaction between those shares by describing the temporal evolution of the system
given by the n-dimensional vector ) (t wi
(
)
′= ( ), ( ), , ( )
)
(t w1 t w2 t w t
W K n for t=1,2,..,T (where n
indicates the number of spending categories considered and T is a finite time period). The model gives the (discrete) dynamics of the system as (Dendrinos and Sonis, 1990, p. 20):
(
)
(
W t)
i n t TF t W F t
w n
j j i
i 1,2, , 1,2, ,
) 1 (
) 1 ( )
(
1
K
K =
= −
− =
∑
=
4
In principle, one would expect a different relative price (Pr,i) for each expenditure group, and a function
for Gi that would not only depend on this relative price but also on the prices of the other groups. In our
with w t w t t and
n
i i
i < = ∀
<
∑
= , 1 1 ) ( 1 ) (0 Fk
(
W(t))
>0, and the function beingarbitrary as long as it satisfies the condition of being positive.
( )
•k
F
If one takes the n-th expenditure group as being numerary5, one could then work
with the functions Hk
( )
• =Fk( ) ( )
• Fn • k =1,2,3,K,n−1, and the dynamic system will be given by the expression(
)
(
)
⎪ ⎪ ⎩ ⎪⎪ ⎨ ⎧ − = − = − + =∑
− = 1 , , 3 , 2 , 1 ) 1 ( ) ( ) ( ) 1 ( 1 1 ) ( 1 1 n i t W H t w t w t W H t w i n i n j j n K (2)Instead of working with the specification
(
)
=∏
k a k i i ik t w A t W
H ( ) ( ) put forward by
Dendrinos and Sonis (1990), Marquez et al. (2003) propose the function6
(
)
niG n ik a a n k n k i n i
i G t
t w t w A t w t w t W
H ( 1)
) ( ) ( ) 1 ( ) 1 ( ) ( 1 1 + ⎟⎟ ⎠ ⎞ ⎜⎜ ⎝ ⎛ = + + =
∏
− = (3)where
∑
is the total public spending.= = n i i t G t G 1 ) ( ) (
This expression together with the theoretical specification (1) leads to the following system of log-linear equations7:
+ +
+ +
= log ( ) log () log ( )
) (
logHi t δin αin Ypc t βin Pr t γin N t
) ( log ) 1 ( log 1 1 t G a t H a n iG n k k n
ik − +
+
∑
− =(4)
where , is the intersect of each equation, ,
and .
) ( / ) ( )
(t w t w t
Hi = i n δin αin =αi −αn
n i n
i β β
β = − i n
n
i γ γ
γ = −
One observes that the parameters of the variables Ypc, Pr and N are elasticities relative to that of the numerary spending function8, and therefore measure the effect of a
5
All the statistical procedures are invariant with respect to the choice of numerary function (for details of this result, see Aitchison, 1986, pp. 93-98).
6
The introduction of the function G(•) is based on the theoretical results of Aitchison (1986, pp. 220-227).
7
It is interesting to note that the conditions established by Devarajan et al. (1996, p. 319) for a change in the share of group i -compensated by the group n- to produce a rise in the economy's equilibrium rate may be written as logwi/wn <θlogβi/βn. One sees that the variable on the left-hand side of this equation
is the same as the dependent variable of model (4), so that the latter could be interpreted as a form of analysing the temporal evolution of the basic variable defining the equilibrium condition corresponding to each observed spending structure.
8
unitary change in the relevant variable, balanced out by an also unitary change in the numerary category. Furthermore, a null value of any of these parameters should not be interpreted as indicating that the corresponding variable does not affect the spending allocated to a given group, but that the way it does so is the same as that of the numerary spending group.
The parameters and represent the pseudo-elasticities of inter-functional and
total growth, respectively. The former are basic in the analysis of substitutability/complementarity between the different spending functions, in terms of
both sign and magnitude: a positive value for a parameter will denote
complementary growth between the two expenditure groups and a negative value a competitive relationship (if the relative share of the function k rises one year, the other
relative share will fall the following year)
n ik
a aiGn
n ik
a
9
. Likewise, if the parameter is positive,
the relative share of the i-th expenditure group grows when total public spending grows, while a negative value means that this group loses share when the total spending rises.
n iG
a
Finally, it should be remarked that the system (4) can be understood as "basic", in the sense of deriving from both the elementary theoretical specification (1) and the dynamic system (2)-(3). Nevertheless, it could be extended by adding other control variables proposed in the literature to explain the variations in median-voter’s preferences or the growth of specific public spending groups, and other political and institutional variables that can help to improve the specification of the system. Candidates for such additional variables are the country's demographic structure, the population density, the ratio of revenues to public spending, the level of visibility of taxes, the degree of decentralization in public spending, or additional lags in the explanatory variables.
We here extend the original model (4) in two directions. Firstly, we start with the hypothesis that taxpayers may have a mistaken perception of the price of public services (Gemmell et al., 1999). We shall thus assume that the phenomenon of fiscal illusion is basically caused by inadequate visibility in the payment of taxation, as well as by the existence of deficits in public accounts. This means the addition of two new variables to
9
The interpretation of the parameters is, of course, different. In this case, they are associated to the degree of persistence of the volume of resources dedicated to the i-th expenditure item: in particular, they measure to what degree the (relative) share of one year determines the proportion dedicated to this expenditure function the following year.
n ii
the system: the logarithm of the deficit ratio ( ) and the logarithm of the degree of
visibility of taxes ( ).
D log
V log
One also finds reports in the literature that the demographic structure can bias the structure of public spending towards specific items10. For this reason, while bearing in mind that the groups of spending considered here are too broad to allow clear results to be derived concerning this issue, we also incorporated the variables and
into the model. These measure the logarithm of the fractions of the
population below 15 years old and above 65 years old, respectively.
15 logPN
65 logPN
3. Empirical application: The allocation of public spending in Spain
In this section, the model described in the previous section will be used to analyse the disaggregated demand for public services in Spain during the period 1970-199711.
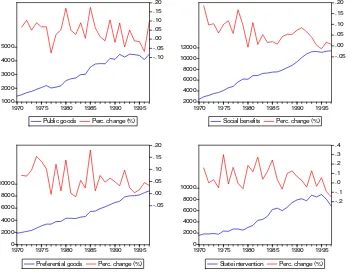
With respect to the categories of public expenditure (Gi) that we shall consider, since the data are for a single country only and a time period of less than thirty years, we aggregated the initially available groups into just four. Specifically, we distinguished between expenditure on public goods (defence and general Administration services), social benefits (pensions, unemployment, and other benefits), preferential goods (education, health, housing and collective services), and State intervention in the economy including both economic services (investment, subsidies to exploitation and capital transfers) and interest payments on public debt. Figures 1 and 2 show the evolution of the different categories of spending12 together with their growth rates during the period studied.
The other variables used in the estimation are the following: total public spending in real terms (G) is the sum of the expenditures in the four categories considered; real per capita income (Ypc) as measured by the per capita GDP at 1995 market prices in pesetas; the relative price (Pr) as approximated by the ratio between the public sector deflator (calculated as the weighted mean of the deflators of the different components of consumption of the public administrations –government final consumption, government gross domestic fixed capital formation and transfers) and the implicit GDP price index
10
For example, the older the population, the higher the proportion of public expenditure dedicated to transfer payments (typically dominated by pensions and social security benefits). Also a rise in the ratio of young people could generate parents’ pressure to increase public educational expenditure.
11
The statistical data were obtained from the National Statitical Institute (INE), the Bank of Spain, the Ministry of Finance and other indirect sources (Alcaide, 1988; Argimón et al., 1999; Valle, 1996).
12
(base 1995=100); the public administration deficit, D, calculated as the ratio between revenues and expenditures; Spain's total resident population, N; the proportions, PN15 and PN65, below 15 years old and above 65 years old, respectively; and a measure of the degree of visibility of taxation, V, as the ratio between indirect taxes (specifically, the taxes linked to production and imports) and total government revenues. Table 1 contains the main descriptive statistics of the variables used in this empirical section.
After this description of the variables, we shall next describe how we approached the problem of estimating the demand system formulated in the previous section.
Firstly, with respect to the econometric specification used, we added to the
formulated system of equations a multivariate normal (n-1)-vector ,
with null means and non-diagonal (constant) covariance matrix given by Ω, to take into account the possible correlation between the errors of the different equations
) , ,
( 1 −1
= u un
u K
13
. Given this specification, the method of estimation chosen was the SUR (Zellner, 1962) as being appropriate for these "seemingly" unrelated regressions.
Secondly, we estimated the demand system with all the control variables ("basic" and "complementary") included. Of the extra variables initially added to the model (4), only the variable logD was found to be globally significant14. We therefore decided to
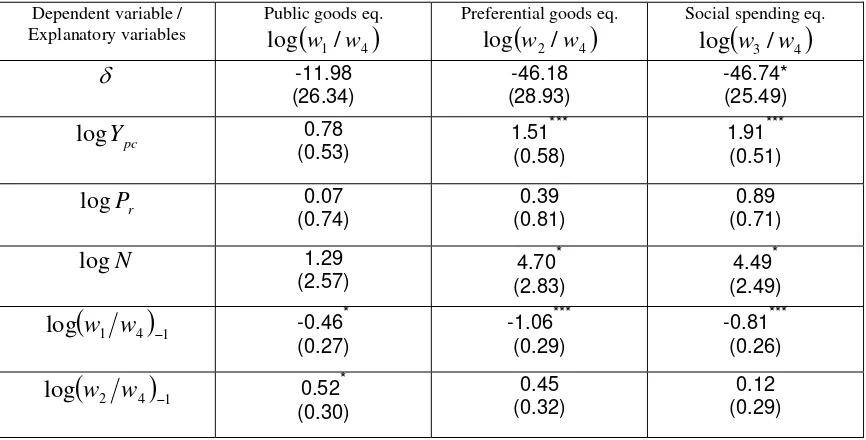
eliminate the rest, and only include the basic variables plus the aforementioned deficit variable. Neither in this model was the price variable found to be significant at the standard significance levels (W=5.843, P=0.11), but since it did lie within the 90% interval, we finally decided not to eliminate it. The final results following this initial specification search are given in Table 215.
)
13There are certain distribution results related to the proposed error specification that need commenting on. Firstly, if the log-ratios yi =log
(
wi/wn follow a multivariate (n-1)-normal distribution N(µ,Ω), then the shares wi will follow a logistic-additive (n-1)-normal distribution, L(µ,Ω), where µ is the mean of the log-ratios and Ω is their covariance matrix. Also, it can be shown that if y≅ N(µ,Ω) and) ,
( Ω
≅L µ
w then the bases of the shares, , will follow a multivariate (n-1)-log-normal distribution. Details of these properties can be found in Aitchison (1986, pp. 112-122), and a general discussion of the stochastic specification used in Fry et al. (1996).
i
G
14
The Wald statistic and the P-value corresponding to the nullity constraints of the parameters of the variables , and were W=5.016 (P=0.17), W=0.837 (P=0.84), and W=2.102 (P=0.55), respectively. Since we are searching for additional explanatory power of other regressors, we have decided to drop those variables not found to be significant in the empirical analysis in order to avoid problems of multicollinearity between all the variables of the system. Anyway, when the variables , and are included in the model, the results do not differ significantly from those reported in Table 2. The authors will provide these results upon request.
V
log logPN15 logPN65
V log 15
logPN logPN65
15
In general terms, the statistical fit was good for the three equations estimated
( 9 ), with several significant variables in each, and was especially so for the preferential goods and social benefits demand equations. Nevertheless, we shall perform a conjoint significance analysis of each of the model's variables because of the problems of multicollinearity to which the estimated system may be subject. As mentioned in Section 3, the elasticities of the Y
. 0
2 ≈
R
pc, Pr and N regressors (and the variable D) should be interpreted in relation with that corresponding to the numerary group –in our case government expenditure on intervention in the economy.
With regard to the first variable in order of statistical significance, per capita income was found to be a basic determinant in the distribution of public spending (W=25.338, P=0.00), with notably high values of the (relative) income elasticities of the preferential goods and social benefits groups. This result indicates that government expenditures in these groups appear to increase –relatively– more than proportionately with per capita national income16.
Secondly, total public spending (G) was also highly significant (W=18.429, P=0.00), with the estimated pseudo-elasticities being negative in the three cases. This result suggests a preference to increase the share of intervention expenditure (to the detriment of the rest) when the available volume of resources increases, and it also shows that in Spain the size of the public sector has a decisive effect on both economic services and public debt interest expenditures17.
The third variable in order of significance (W=10.980, P=0.01) was the deficit (D), which indicates that the share of taxation-financed spending significantly conditions not only the volume of resources available but also how they are allocated18. Thus, our
16
A wide range of studies in the literature have found absolute elasticities greater than one for public spending on health, education or housing, revealing their luxury good nature (see, for example, Falch and Rattso, 1997; Gerdham et al., 1992; Newhouse, 1987; Snyder and Yackovlev, 2000). Additionally, the level of per capita income allows broader social security coverage, at the same time that influences aspects related to inequality (Atkinson, 1995; Clements et al., 1998; Tait and Heller, 1982).
17
Similar results were obtained in Mongelli (1997) and Randolph et al. (1996).
18
In order to find evidence for how the deficit influences the volume of public spending, we estimated the aggregate expenditure demand function presented at the beginning of Section 2 (extended with fiscal illusion measures). The results were as follows (the equation was estimated by OLS, but a similar result was obtained, except for the case of the price variable, on using the fully-modified OLS estimator proposed by Phillips and Hansen, 1990):
V D
N P
Y
G pc r log
) 09 . 2 ( 30 . 0 log ) 12 . 2 ( 52 . 0 log ) 85 . 9 ( 51 . 6 log ) 13 . 2 ( 24 . 1 log ) 17 . 10 ( 33 . 1 ) 8 . 10 ( 19 . 68 ˆ log + − − + − − + − − =
[The values in parentheses are the t statistics for each estimated parameter].
empirical evidence supports the hypothesis of deficit illusion and it also shows that Spanish fiscal policy influences the preferences of the median voters, changing their expenditure allocation model on the various public goods and services19.
In addition to the above variables, the population also has a major impact on the distribution of public spending (W=7.197, P=0.06), again with a notably different effect on the allocations to preferential goods and social benefits. However, as previously mentioned, the age structure of the population does not seem to affect the pattern of demand for public services20, although this result is probably reflecting the aggregated nature of those expenditure groups considered in this work.
Last, the relative price of public-sector goods and services seems to have no significant differential effect on any of the budgetary groups, although this result could be an artefact of the high degree of aggregation of the expenditure groups considered and/or to the fact that we are using the same price for all expenditure groups (see note 4). Nevertheless, as was observed in the results for the estimated aggregate expenditure function, the effect of the relative cost of public services is significant and negative in sign, suggesting price-elastic demand for aggregate government-provided goods and services.
Overall, the findings confirm the results in the literature on the importance of income, the size of the public sector, and the population in explaining the behaviour of public administration spending, and also show the significant influence of public deficit on the administration's budgeting process.
With respect to the observed pattern of interaction between the different expenditure functions, firstly there was the weak interrelationship in the case of public goods, where
only the elasticity of the preferential goods group ( ) was found to be marginally
significant, with a value of 0.52. This positive value shows that an increase of the significance of the expenditures in preferential goods in the Spanish economy also increases the relative proportion of expenditures on public goods.
4 2 , 1
a
mention that the measure of invisibility of taxes is significantly different from zero, showing that voter-taxpayers demand more public expenditure when the tax structure switches towards indirect taxes.
19
Fiscal illusion in the form of excess demand for public goods and services has been also found in Ashworth (1995) and Gemmell et al. (1999). On the other hand, some recent evidence about the effects of fiscal policy on the structure of government expenditures can be found, for example, in Cashin et al.
(2001), Baqir (2002) or Jonakin and Stephens (1999).
20
On the contrary, there were significant interactions between preferential goods expenditure and the public goods and social benefits groups. In the former case, the
estimate of -1.06 for the elasticity indicates a high level of substitutability between
the two functions while, in the latter ( ), the elasticity of 0.65 indicates a
complementarity relationship between the expenditures in preferential goods and in social benefits.
4 1 , 2
a
4 3 , 2
a
Likewise, in the case of the social benefits demand equation, the value of the
elasticity (-0.81) is highly significant, indicative in this case also of a competitive
growth relationship between the expenditures of this group and those of the public goods group.
4 1 , 3
a
Finally, with respect to the parameters of persistence of the spending , there is a
highly significant value only in the case of social benefits group. The estimated value (0.78) indicates that the spending allocated each year to this group is highly dependent
on the levels of spending of previous years (as measured by the term
4 ,i i a
(
w3/w4)
−1).4. Conclusions
This work is intended to be a one-step ahead to the still sparse literature approaching the analysis of the structure of public spending. The main contribution has been to generalize the median voter model by including dynamic aspects. The new model is capable not only of measuring the impact of the classical determinants (income, relative public service prices, population, total expenditure, etc.), but also of yielding additional relevant information on the trade-offs that exist between the different spending categories.
The model's utility was demonstrated by applying it to the Spanish public sector. Thus, firstly, the results reinforce some already known conclusions on the basic determinants of the different items of expenditure:
-Per capita income was found to be a basic determinant in the distribution of public
spending. Government expenditures in the preferential goods and social benefits groups increase relatively more than proportionately with per capita national income.
-With respect to the public deficit, the empirical evidence shows both the argument for deficit illusion and the influence of this variable on the expenditure composition.
-The population has an impact on the distribution of public spending, with a notably different effect on the allocations to preferential goods and social benefits.
Secondly, the dynamic model adds new evidence to the existing knowledge about the topic of budget expenditure composition:
-In the case of public goods, an increase of the share of the expenditures in preferential goods in the Spanish economy also increases the relative proportion of expenditures on public goods.
-It was found a high level of substitutability between preferential goods expenditure and the public goods. On the contrary, a complementarity relationship between the expenditures in preferential goods and in social benefits was detected.
-A competitive growth relationship between the expenditures in social benefits and those of the public goods group was shown.
-With respect to the parameters of persistence, the spending allocated each year to the group of social benefits is highly dependent on the levels of spending of previous years.
In summary, not only were some of the aforementioned standard control variables found to be significant, but significant interactions were also detected between some of the public services, and these interactions were classified as relationships of complementarity or substitutability.
References
Aitchison J. (1986), The statistical analysis of compositional data, Chapman and Hall, New York.
Agell J., Lindh T. & Ohlsson H. (1997): “Growth and the public sector: A critical review essay”, European Journal of Political Economy, Vol. 13, pp. 33-52.
Agell J., Lindh T. & Ohlsson H. (1999): “Growth and the public sector: A reply”, European Journal of Political Economy, Vol. 15, pp. 359-366.
Alcaide J. (1988): “El gasto público en la democracia española. Los hechos”, Papeles de Economía Española, N. 37, pp. 2-41.
Argimón I., Gómez A.L., Hernández de Cos P. & Martí F. (1999): “El sector de las administraciones públicas en España”, Estudios Económicos, N. 68, Banco de España, Servicio de Estudios.
Ashworth J. (1995): “The empirical relationship between budgetary deficits and government expenditure growth: an examination using cointegration”, Public Finance, Vol. 50, pp. 1-18.
Baqir R. (2002): “Social sector spending in a panel of countries”, IMF Working Paper, N. 02/35.
Barro R. (1990): “Government Spending in a Simple Model of Endogenous Growth”, Journal of Political Economy, Vol. 98, pp. 103-125.
Barro R. (1991): “Economic growth in a cross section of countries”, Quarterly Journal of Economics, Vol. 106, pp. 407-444.
Barro R. & Sala-i-Martin X. (1992): “Public finance in models of economic growth”, Review of Economic Studies, Vol. 59, pp. 645-661.
Bergstrom T. & Goodman R. (1973): “Private demands for public goods”, American Economic Review, Vol. 63, pp. 280-296.
Bleaney M., Gemmell N. & Kneller R. (2001): “Testing the endogenous growth model: public expenditure, taxation and growth over the long-run”, Canadian Journal of Economics, Vol. 34, pp. 36-57.
Borcherding T. & Deacon R. (1972): “The demand for the services of non-federal governments”, American Economic Review, Vol. 62, pp. 891-901.
Cashin P. (1995): “Government spending, taxes and economic growth”, IMF Staff Papers, Vol. 42, pp. 237-269.
Cashin P., Mauro P., Patillo C. & Sahay R. (2001): “Macroeconomic policies and poverty reduction: Stylized facts and an overview of research”, IMF Working Paper, N. 01/135.
Clements B., Rodriguez H. & Schwartz G. (1998): “Economic Determinants of Government Subsidies”, IMF Working Paper, N. 98/166.
Congleton R. & Bennett R. (1995): “On the Political Economy of State Highway Expenditures: Some Evidence of the Relative Performance of Alternative Public Choice Models”, Public Choice, Vol. 84, pp. 1-24.
Coyote P. & Landon S. (1990): “Cost-sharing versus block funding in a federal system: A demand systems approach”, Canadian Journal of Economics, Vol. 23, pp. 817-838.
Deacon R. (1978): “A demand model for the local public sector”, Review of Economics and Statistics, Vol. 60, pp. 180-202.
Dendrinos D.S. & Sonis M. (1990), Chaos and Socio-Spatial Dynamics, Applied Mathematical Sciences 86, Springer-Verlag, New York.
Devarayan S., Swaroop V. & Zou H. (1996): “The composition of public expenditure and economic growth”, Journal of Monetary Economics, Vol. 37, pp. 313-344. Dunne J., Pashardes P. & Smith R. (1984): “Needs, costs and bureaucracy: The
allocation of public consumption in the U.K.”, Economic Journal, Vol. 94, pp. 1-15. Easterly W. & Rebelo S. (1993): “Fiscal policy and economic growth: An empirical
investigation”, Journal of Monetary Economics, Vol. 32 (3), pp. 417-458.
Falch T. & Rattso J. (1997): “Political and economic determinants of school spending in Federal states: theory and time-series evidence”, European Journal of Political Economy, Vol. 13, pp. 299-314.
Fernández R. & Rogerson R. (1997): “The determinants of public education expenditures: Evidence from the States, 1950-1990”, NBER Working Paper, N. 5995.
Fölster S. & Henrekson M. (1999): “Growth and the public sector: a critique of the critics”, European Journal of Political Economy, Vol. 15, pp. 337-358.
Gemmell N., Morrissey O. & Pinar A. (1999): “Fiscal illusion and the demand for government expenditures in the UK”, European Journal of Political Economy, Vol. 15, pp. 687-704.
Gemmell N. & Kneller R. (2002): “Fiscal Policy, Growth and Convergence in Europe”, European Economy Group Working Papers, N. 14, Universidad Complutense de Madrid (Spain).
Gerdtham U.-G., Sogaard J., Jönsson F. & Andersson F. (1992): “An econometric analysis of health care expenditure: a cross-section of OECD countries”, Journal of Health Economics, Vol. 11, pp. 63-84.
Hagemann R.P. & Nicoletti G. (1989): “Ageing population: Economic effects and implications for public finance”, OECD Working Paper, N. 61.
Haynes K. & Grosskopf S. (1984): “The role of functional form in estimating the demand for local public goods”, Review of Economics and Statistics, Vol. 66, pp. 169-173.
Heller P., Hemming R. & Kalvert P. (1986): “Ageing and social policy in the major industrial countries, 1980-2025”, IMF Occasional Paper, N. 47.
Heller P. & Diamond J. (1990), “International Comparisons of Government Expenditure Revisited: The Developing Countries”, IMF Occasional Paper, N. 69.
Hettich W. & Winer S. (1988): “Economic and political foundation of tax structure”, American Economic Review, Vol. 78, pp. 701-712.
Hitiris T. (1999): “Growth and containment of health care expenditure in industrial countries”, Discussion Paper Series, N. 15, Department of Economics and Related Studies, University of York (UK).
Jonakin J. & Stephens M. (1999): “The impact of adjustment and stabilization policies on infrastructure spending in Central America”, North American Journal of Economics and Finance, Vol. 10, pp. 293-308.
King R. & Rebelo S. (1990): “Public policy and economic growth: Developing neoclassical implications”, Journal of Political Economy, Vol. 98, pp. 126-151. Kneller R., Bleaney M. & Gemmell N. (1999): “Fiscal policy and growth: evidence
from OECD countries”, Journal of Public Economics, Vol. 74, pp. 171-190.
Kramer J. (1973): “On a class of equilibrium conditions for majority rule”, Econometrica, Vol. 41, pp. 285-297.
Looney R. (1997): “Excessive Defense Expenditures and Economic Stabilization: The Case of Pakistan”, Journal of Policy Modeling, Vol. 19, N. 4, pp. 381-406.
Lucas R. (1990): “Supply-side economics: an analytical review”, Oxford Economic Papers, Vol. 42, pp. 293-316.
Marquez M., Ramajo J. & Hewings G. (2003): “Regional interconnections and growth dynamics: the Spanish case”, Australasian Journal of Regional Studies, Vol. 9, N. 1, pp. 39-64.
Marlow M. & Shiers A. (1999): “Do Law Enforcement Expenditures Crowd-Out Public Education Expenditures?” Applied Economics, Vol. 31, N. 2, pp. 255-266.
McMillan M. & Amoako-Tuffour J. (1988): “An examination of preferences for local public sector outputs”, Review of Economics and Statistics, Vol. 70, pp. 45-54. Mendoza E., Milesi-Ferretti G. & Asea P. (1997): “On the effectiveness of tax policy in
altering long-run growth: Harberger’s superneutrality conjecture”, Journal of Public Economics, Vol. 66, pp. 99-126.
Mongelli F. (1997): “Effects of the European monetary union on taxation and interest spending on national governments”, IMF Working Paper, N. 97/93.
Phillips P. & Hansen B. (1990): “Statistical inference in instrumental variables regression with I(1) processes”, Review of Economic Studies, Vol. 57, pp. 99-125. Pitarakis J.-Y. & Tridimas G. (1999): “Total expenditure endogeneity in a system of
demand for public consumption expenditures in the UK”, Economic Modelling, Vol. 16, pp. 279-291.
Poterba J. (1997): “Demographic structure and the political economy of public education”, Journal of Public Policy and Management, Vol. 16, pp. 48-66.
Randolph S., Bogetic Z. & Hefley D. (1996): “Determinants of public expenditure on infrastructure, transportation and communication”, Policy Research Working Paper, N. 1661, World Bank.
Riker W & Ordeshook P. (1973), An Introduction to Positive Political Theory, Englewood Cliffs, Prentice-Hall, New Jersey.
Romer T. & Rosenthal H. (1979): “The elusive median voter”, Journal of Public Economics, Vol. 12, pp. 143-170.
Sanz I. & Velázquez F.J. (2001): “The evolution and convergence of the government expenditure composition in the OECD countries: an analysis of the functional distribution”, European Economy Group Working Papers, N. 9, Universidad Complutense de Madrid (Spain).
Sanz I. & Velázquez F.J. (2002): “Determinants of the composition of government expenditure by functions”, European Economy Group Working Papers, N. 13, Universidad Complutense de Madrid (Spain).
Snyder J.M. & Yackovlev I. (2000): “Political and economic determinants of government spending of social protection programs”, Working Paper, Massachusetts Institute of Technology (USA), April-2000.
Tait A.A. & Heller P.S. (1982): “International comparisons of government expenditure”, IMF Occasional Paper, N. 10.
Tanzi V. & Zee H. (1997): “Fiscal policy and long-run growth”, IMF Staff Papers, Vol. 44, pp. 179-209.
Tanzi V. & Schuknecht L. (2000), Public spending in the 20th century: A global perspective, Cambridge: Cambridge University Press.
Tridimas G. (1999): “A demand-theoretic analysis of public consumption priorities in the United Kingdom”, Public Finance Review, Vol. 27, pp. 599-623.
Tridimas G. (2001): “The economics and politics of the structure of public expenditure”, Public Choice, Vol. 106, pp. 299-316.
Turnbull G.K. & Mitias P.M. (1999): “The median voter model across levels of government”, Public Choice, Vol. 99, pp. 119-138.
Valle V. (1996): “La hacienda pública de la democracia española”, Papeles de Economía Española, N. 68, pp. 2-26.
Zagler M. & Durnecker G. (2003): “Fiscal policy and economic growth”, Journal of Economic Surveys, Vol. 17 (3), pp 397-422.
Figure 1: Composition of public spending in Spain, 1970-1997 (as a proportion of total expenditure)
.12 .16 .20 .24 .28 .32 .36 .40 .44
1970 1975 1980 1985 1990 1995
Public goods Social benefits
Preferential goods State intervention
Figure 2: Evolution of specific spending categories (levels and growth rates), 1970-1997
1000 2000 3000 4000 5000
-.10 -.05 .00 .05 .10 .15 .20
1970 1975 1980 1985 1990 1995
Public goods Perc. change (%)
2000 4000 6000 8000 10000 12000
-.05 .00 .05 .10 .15 .20
1970 1975 1980 1985 1990 1995
Social benefits Perc. change (%)
0 2000 4000 6000 8000 10000
-.05 .00 .05 .10 .15 .20
1970 1975 1980 1985 1990 1995
Preferential goods Perc. change (%)
0 2000 4000 6000 8000 10000
-.2 -.1 .0 .1 .2 .3 .4
1970 1975 1980 1985 1990 1995
Table 1: Descriptive statistics of the variables
Variable Mean Std. Dev. Maximum Minimum
w1 0.16 0.02 0.19 0.13
w2 0.36 0.02 0.42 0.33
w3 0.25 0.01 0.28 0.23
w4 0.23 0.03 0.28 0.17
G 20461.70 8839.68 33087.57 7457.06
Ypc 1461.289 254.06 1946.07 1046.05
Pr 0.973935 0.04 1.03 0.86
D 0.95 0.06 1.05 0.85
N 38145.89 1769.52 39853.00 33885.00
PN15 24.36 4.09 29.00 16.90
PN65 12.05 1.85 15.70 9.60
V 0.27 0.03 0.35 0.23
Table 2: SUR estimates of the (extended) complete demand system (4)
Dependent variable / Explanatory variables
Public goods eq.
(
1/ 4)
log w wPreferential goods eq.
(
2/ 4)
log w wSocial spending eq.
(
3/ 4)
logw w
δ -11.98 (26.34)
-46.18 (28.93)
-46.74* (25.49)
pc
Y
log 0.78
(0.53) 1.51
***
(0.58)
1.91*** (0.51)
r P
log 0.07
(0.74)
0.39 (0.81)
0.89 (0.71)
N
log 1.29
(2.57) 4.70
*
(2.83)
4.49* (2.49)
(
1 4)
1logw w − -0.46* (0.27)
-1.06*** (0.29)
-0.81*** (0.26)
(
2 4)
1logw w − 0.52*
(0.30)
0.45 (0.32)
(
3 4)
1logw w − 0.07
(0.30) 0.65
**
(0.33)
0.78*** (0.29)
G
log -0.82* (0.43)
-1.49*** (0.47)
-1.51*** (0.41)
D
log 0.82
(0.51)
-0.25 (0.56)
-0.06 (0.49)
2
R 0.92 0.89 0.89
SSR 0.10 0.13 0.10
Residual covariance matriz
(
1/ 4)
log w w log
(
w1/w4)
log(
w3/w4)
(
1/ 4)
log w w 0.0039 0.0029 0.0032
(
1/ 4)
log w w 0.0029 0.0047 0.0033
(
3/ 4)
logw w 0.0032 0.0033 0.0036
NOTES: Estimated standard errors are given in parentheses; significance levels are represented as *