Presented at the conference on Desalination and the Environment. Sponsored by the European Desalination Society and Center for Research and Technology Hellas (CERTH), Sani Resort, Halkidiki, Greece, April 22–25, 2007.
The sensitivity of SDI analysis: from RO
feed water to raw water
Amandine Mosset
a*, Véronique Bonnelye
a, Marc Petry
a, Miguel Angel Sanz
ba
Degrémont SA, 183 avenue du 18 juin 1940 – 92508 Rueil-Malmaison Cedex, France
b
Degrémont Spain, Ibarrecolanda 19 – 48015 Bilbao, Spain email: [email protected]
Received 17 January 2007; accepted 22 January 2007
Abstract
The water characterisation is generally challenging regarding the pre-treatment operation up-stream reverse osmosis. The classical parameters are not applicable due to analytical limitations, and/or the sensibility of those parameters is too low compared to the water fluctuation behaviour measured on full-scale water treatment plants. The evaluation of the water fouling potential could be a more sensible parameter, supplementing the analytical tools actually used for design purpose.
The silt density index (SDI) is a parameter characterising the fouling potential of water. It is one of the most important parameter for the design and operation of RO membrane process. SDI analytical protocol is standard-ized in the ASTM D 4189-95 (Reapproved 2002). This method evaluates the quantity of matter in water, based on fouling variation of a 0.45-µm membrane during a filtration time. It is typically applied on low fouling potential water such as pre-treated water feeding reverse osmosis or nanofiltration (SDI15 min < 5).
SDI could become a good parameter to appreciate the fouling potential of water with low turbidity and suspended solids. However, there is a high risk for generating some imprecision on the result. As a consequence, this parameter has to be defined more precisely.
The different methods to evaluate the fouling tendency of water are presented. Essentially based on ASTM D 4189-95, SDI standard method can be reviewed regarding the reproducibility and precision taking into account the possible deviations observed on site. The ASTM text is discussed with the presentation of its limits especially for high SDI values.
Different factors, which can interfere on the SDI results are detailed (quality of the 0.45 mm membrane, per-centage of plugging…). Some comparative tests results are presented with data collected from pilot studies and literature. Knowing the field of application and the limits of SDI-ASTM, the method is extended to higher fouling tendency water, based on 75% plugging limit. The SDI75% is then applied to the characterization of surface
sea-water, brackish water and results compared with other more usual parameters such as turbidity, suspended solids,
*Corresponding author.
doi:10.1016/j.desal.2007.01.125
algae, particles count, etc. This characterization is particularly helpful for pre-treatment operation and to detect some failure on its efficiency.
Keywords: SDI; Silt density index; Reverse osmosis; Membrane; Foulant; Raw water; ASTM D 4189-95 (Reapproved 2002)
1. Introduction
To evaluate water’s fouling tendency, which causes serious problems with reverse-osmosis systems, it is important to evaluate water quality by routine analysis: dissolved oxygen, pH, TOC, turbidity, particles, iron… Table 1 summarizes the important parameters related to RO/NF mem-brane fouling.
Silt density index (SDI) is a parameter repre-sentative of the fouling tendency of water toward membranes. The method is based on ASTM D-4189 standard. It is depending on the amount of particles but also representative of other fouling compounds (see Fig. 1). This test consists in filtrat-ing a sample through a 0.45µm membrane at a constant pressure (30 psi). Because the filter is more or less plugging versus time, the rate of plugging (SDI) is more or less important. SDI is then calcu-lated according to the following calculation [6]:
%P30= percent at 207 kPa (30 psi) feed pressure,
T = total elapsed flow time, min (usually 15 min, see Note 9),
ti = initial time required to collect 500 mL of sample s, and
tf = time required to collect 500 mL of sample after test time T (usually 15 min, see Note 9), s
SDI is recognised as the standard test to esti-mate membrane fouling potential [1–4]. Contin-uous particle counting is sometimes presented as an alternative to SDI [5]. However, particles are not the only one parameter detected by SDI measure; organic matter is also influencing SDI result. As a consequence, continuous particle counting is an interesting completing method to evaluate and control fouling potential of water but not a substitute.
This paper, based on literature and experimen-tal trials explains how sensitive SDI measure can be. As there are some difficulties to ensure a good analytical precision for raw water, it is
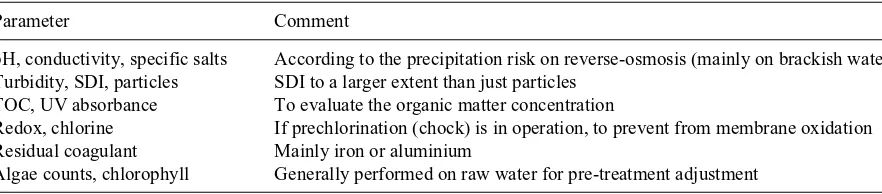
Table 1
Parameter to check to evaluate the fouling tendency of water
Parameter Comment
pH, conductivity, specific salts According to the precipitation risk on reverse-osmosis (mainly on brackish water) Turbidity, SDI, particles SDI to a larger extent than just particles
TOC, UV absorbance To evaluate the organic matter concentration
Redox, chlorine If prechlorination (chock) is in operation, to prevent from membrane oxidation Residual coagulant Mainly iron or aluminium
Algae counts, chlorophyll Generally performed on raw water for pre-treatment adjustment
SDIT %
important to develop a more adapted method especially for surface water, more vulnerable. Degrémont adapted its own method based on the extrapolation SDI to 75% plugging.
2. ASTM and sensitivity of SDI
2.1. ASTM
ASTM D 4189-95 (Reapproved 2002) is the standard test method for silt density index, rec-ognised by membrane suppliers and desalination community to estimate the fouling potential of RO feed water quality and to prevent membranes from fouling.
The text explains that “this test method is not an absolute measurement of the quantity of particulate matter”. Silt density index must be considered as a parameter representative of the fouling potential of water on membrane. This is not only a parameter indicating the quantity of particulate matter in water.
The limit of SDI ASTM method is that “it is not applicable to every kind of water” (Water types I, II and III). It is also limited to water with SDI inferior to 5. (Note 9 [6])
There are also hydraulic differences between this analysis and real RO plant conditions. The test uses dead-end filtration while RO membranes are operated in crossflow filtration mode. As a consequence, behaviour on RO membrane can be different from the test. Biology phenomenon will not happen in 15 min.
However, it is possible to have very good SDI after ultrafiltration and to get very high organic matter contents. For example at Knokke–Heist (Pilot plant of channel water in Belgium) where raw water was directly ultrafiltrated and gave good SDI results (13 mg/L of TOC and a SDI15 min of 2).
It is expected to have important organic fouling. “La Seine River” directly ultrafiltrated SDI15 min
is below 1 while, raw water after coagulation and ultrafiltration gave SDI15 min between 1 and 3.
In the last case, even if SDI15 min is higher, TOC and BDOC have decreased thanks to coagulation.
In this case the risk of organic fouling (and bio-fouling) is decreased with coagulation.
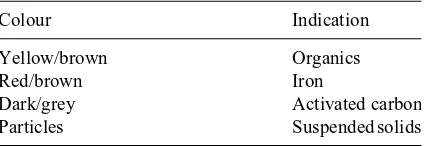
Analysis of the colour of the filter after filtra-tion is also interesting: identificafiltra-tion of sticky or particular deposit. Table 2 gives some examples of the filter appearance and the indications about the possible corresponding fouling origin. This is essential to determine whether only sus-pended solids were in the water or whether it is adsorbed organic matters (dangerous fouling for RO membranes)
2.2. Sensitivity of SDI
SDI is a sensible parameter. It is not a very useful method (necessity of a large quantity of water) and sometimes repeatability can be subject to controversy (particularly due to operator’s technique differences). The main precautions to follow during the SDI preparation are:
• Equipment flushing
• Air purge (to avoid air going at the surface of the membrane)
• Membrane wetting (for a 100% grip of mem-brane to the holder)
• Avoiding contact membrane/hands, especially outside of the joint’s place
ASTM method precises to open the valve and “immediately” use the stopwatch and mea-sure the time to collect 500 mL. However, with the operation difficulties, “immediately” is not always evident.
Table 2
Origin of the fouling compounds according to SDI membrane appearance
Colour Indication
Yellow/brown Organics
Red/brown Iron
Dark/grey Activated carbon
It is also requested to stay at constant pres-sure equal to 30 psi. Prespres-sure during the analysis has been studied to see the impact of a difference between the instruction (30 psi) and real pressure operated (Graph 1). There was no significant SDI variation. However, these results cwere obtained with constant pressure applied during the test. A variation of pressure during the filtration would increase the SDI result.
SDI test can point out a lot of fouling problems. However, some elements, which can have a significant impact on the membrane fouling are not detected by this test.
When there is a pre-treatment with coagula-tion using iron (direct coagulacoagula-tion on filters or clarification) there is a risk of generating dis-solved iron (bad adjustment of treatment rate). This can be at the origin of premature leaning of membranes (increase of pressure…) due to foul-ing. However, dissolved iron will not affect SDI.
For total iron, it can be detected by examining the colour of the filter.
In order to simulate suspended solids, doping tests have been experimented with diatomaceous earth (suspension). As presented in Graph 2, even with high doping rates (0.5/2 mg/L), SDI increase is negligible with a difference inferior to 0.5%.
As a consequence, SDI is not always sufficient to identify every fouling problem.
2.3. SDI of pre-treated water
It has been recognised that fresh surface water SDI and turbidity are correlated [7]. How-ever, it is not always the case and SDI increase
Influence pressure test for SDI measure
0 10 20 30 40
1.95 2.00 2.05 2.10 2.15 2.20 2.25
Pressure (bar)
SDI (
%
/min) Tap water
UF water
Graph 1. Influence of pressure variation during SDI measure.
Graph 2. Results of diatomaceous doping influence on SDI.
SDI and turbidity during sand filter ripening phase
0.0
SDI and turbidity (NTU)
SDI Turbidité (NTU)
Graph 4. Pilot plant, pre-treated water (outlet of filter), ripening phase.
SDI and turbidity of pre-treated water before RO
0.0
28/05/2006 29/05/2006 30/05/2006 31/05/2006 01/06/2006
SDI
SDI Turbidity
may not always be associated with turbidity increase (especially on low turbidity water due to sensitivity of the turbidity measure). Graphs 3 and 4 present pilot plant analysis showing that turbidity was low and remained constant (0.2– 0.3 NTU) while SDI tripled (from 0.6 to 1.8). Then to study the ripening, phase it is more interesting to follow SDI decrease.
As a consequence, SDI could become a good parameter to appreciate the fouling potential of
water with low turbidity. Indeed, SDI is admitted as the most efficient method to follow reverse-osmosis performances.
3. Factors interfering with SDI measures
3.1. pH
Literature developed the influence of several parameters on SDI measure. Firstly, pH influence has been studied by M. Ando and Al [3] showing an increase of SDI values from 4 to 6 when pH is increased from 7 to 8; Graph 5 presents this results. This is mainly due to dissolved sub-stances (Ca, Mg…), which precipitate with a pH increase.
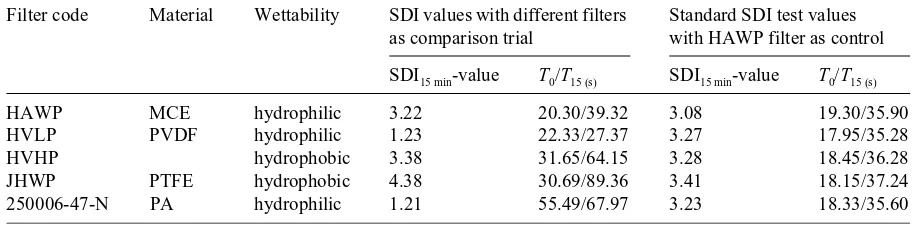
3.2. The membrane
As it is written in the ASTM method, the influence of the choice of the membrane is determinant for SDI values.
Ando et al. [7] have compared the SDI mea-sure with hydrophobic and hydrophilic mem-brane (Table 3). Higher results are obtained for hydrophobic membrane compared to hydro-philic membrane.
It has also been observed differences between 2 batches of membrane, with the same type of membrane and the same manufacturer. As a
Graph 5. SDI values VS pH of UF seawater [7].
Table 3
Comparison of data of 0.45 mm pore size using hydrophilic and hydrophobic MF filters with typical UF filtrate Filter code Material Wettability SDI values with different filters
as comparison trial
Standard SDI test values with HAWP filter as control SDI15 min-value T0/T15 (s) SDI15 min-value T0/T15 (s)
HAWP MCE hydrophilic 3.22 20.30/39.32 3.08 19.30/35.90
HVLP PVDF hydrophilic 1.23 22.33/27.37 3.27 17.95/35.28
HVHP hydrophobic 3.38 31.65/64.15 3.28 18.45/36.28
JHWP PTFE hydrophobic 4.38 30.69/89.36 3.41 18.15/37.24
consequence, a verification of the SDI measure must always be preformed with a new batch of membrane.
4. Presentation of SDI75%
Extrapolation of SDI at 75% is not a new concept; indeed, it is already used on automatic SDI analysers like the Chemetek FPA-3300. The application of this equipment on raw water was found particularly adapted because of the rapidity of plugging filters.
The silt density index 75% (SDI75%) is an index calculated from the rate of plugging of a 0.45µm membrane filter on mild and high fouling water and extrapolated at exactly 75%. The difference between this method and ASTM is that ASTM is calculated at exactly 15, 10 or 5 min while SDI75% is extrapolated at exactly 75% plugging.
The interest of this method is to fix an absolute percentage of fouling increasing the reproducibil-ity. If only instantaneous SDI is taken into account, SDI is overestimated. Another example in Graph 6 presents the results obtained on a
surface seawater, after 5-min filtration, plugging is at 63.3%, calculating SDI on this instantaneous time leads to a SDI value of 12. SDI 75% is at 8. Fixing this absolute percentage is essential to have uniform values. SDI 75% is then applied to the characterization of surface seawater, brackish water.
Graph 7 shows the sensitivity of SDI 75% for raw water compared to turbidity. Indeed, while turbidity stays stable between 0.4 and 0.5 NTU on Arabic Gulf seawater, SDI decreases from 14 to 8.
5. Conclusion
SDI is the essential parameter to control the fouling potential of water. Compared to other parameters like turbidity, it is more sensitive, especially for low RO feed water (low turbidity). However, it does not identify every kind of foul-ing problems (dissolved iron,…), that is why it is interesting to complete SDI by other parame-ters (particle counting for example).
This measure is affected by lots of para-meters (temperature, pH, membrane,…) so it is essential to precise the conditions of the test.
SDI-ASTM has shown some limits and it seemed necessary for Degrémont to develop a method to study raw water SDI. The advantage of SDI 75% is the possibility to homogenise SDI results
compared to SDI-ASTM 5 min and SDI-ASTM 10 min.
References
[1] A. Al-Ahmad, F.A Abdul Aleem, A. Mutiri and A. Ubaisy, Biofouling in RO membrane systems Part 1: Fundamentals and control.
[2] Toray Technical Manual [3] Hydranautics Technical Manual [4] Dow Technical Manual
[5] R.L. Bryant, An alternative to silt density index (SDI) continuous particle counting, Ultrapure, Nov. 2004. [6] Standard Test Method for Silt Density Index
(SDI) of water, D 4189-95 ASTM.
[7] M. Ando, S. Ishiara, H. Iwahori and N. Tada, Peculiar or unexpected behaviour of silt density index of pretreated water for desalination, IDA BAH 03–071.
[8] S. Hong and M. Elimelech, Chemical and physical aspects of natural organic matter (NOM) fouling of nanofiltration membrane, J. Memb. Sci., 132 (1997) 159–181.
SDI and turbidity of pre-treated water before RO
0.0 0.2 0.4 0.6 0.8 1.0 1.2 1.4 1.6 1.8 2.0
28/05/2006 29/05/2006 30/05/2006 31/05/2006 01/06/2006
SDI
SDI Turbidity