382
SPATIAL MODEL OF KOPPEN CLIMATE CLASSIFICATION
USING THIESSEN POLYGON OPTIMIZATION ALGORITHM
1 KRISTOKO DWI HARTOMO, 2SRI YULIANTO, J.P., 3EMMANUEL GUMILANGGENG
1,2,3 Satya Wacana Christian University, Department of Information Technology, Salatiga, Indonesia
E-mail: 1[email protected], 2[email protected], 3[email protected]
ABSTRACT
Global climate change significantly affects global and regional climate conditons. This research aims to predict climate distribution by using thiessen polygon algorithm optimization. Thiessen polygon weighs rainfall and measured surrounding areas to predict locations affected by surrounding climate condition. Our study produces spatial model of climate classification and thematic maps of spatial climate in the forms of types of spatial climates based on Koppen climate classification. The Central Java Province itself has three climate types, namely (af) wet tropical, (am) monsoon tropical, and dry wet tropical or savana tropical (aw). It is expected that our study could be used for reference of disaster impact mitigation, determining agricultural cropping patterns, transport navigation and disaster management.
Keywords : Climate, Koppen, Thiessen Polygon, Spatial Model, Optimization, Algorithm.
1.INTRODUCTION
Climate is a weather condition during a long period that could statistically indicate different statistical values for different conditions [1]. Climate differences between different areas on earth is significantly affected by those areas’ positions toward the sun. As a consequence, there are several climate classifications that are based on earth’s geographical location. In general, climate can be differentiated into tropical climate, subtropical climate, temperate climate, and polar climate [2].
Indonesia has not yet fully utilized climate in numerous sectors. There has been continuing general misconception that perceives that climate is a natural phenomenon that causes disasters and obstructs various activities. This common misconception has to be challenged. The paradigm has to shift from perceiving climate as a cause of disaster to climate utilization to maximize the potentials of natural resources [3]. However, the limited availability of accurate, timely, and easily understandable climate information has been a major obstacle of this effort.
During last years, global climate change has been an increasingly important set of information. This has occurred and will continuously happen in line with increasing human activity [4]. Global
climate change affects climate conditions in Indonesia, especially in the Central Java Province. Changing rainfall and temperature are the most obvious indicators of climate change, especially in the Central Java Province.
Our study aims to classify climates in the Central Java Province from 2007 to 2017 into the appropriate climate groups based on rainfall, temperature, and surface area using the Koppen spatial climate classification model. This method is one of the best method to classify and allocate a particular climate into a certain area. We use Thiessen polygon optimization algorithm to determine climate distribution in the areas based on the surface area and rainfall of these areas.
2.RELATED WORKS
The first study investigates spatial model to produce Voronoi diagrams focusing on points and not on linear or polygon ones. This study integrates the Voronoi diagram model and spatial model using raster-based approach. In developing such approach, this study implements ArcGIS with the
ArcObjects extension. It focuses on methodology,
383 feasible for points, lines, and polygons; (2) capable to produce multiplicative Voronoi diagram in vector format; (3) capable to provide non-spatial input attributes to Voronoi cells through spatial combination, and (4) capable to produce a set of long-distance Euclidean rasters for spatial modelling [5].
The second study uses the determination of the rainfall distribution in a particular area to calculate and predict rainfall in other areas that do not have rainfall data in particular periods using Thiessen polygon method. More specifically, this method estimates the rainfall of neighboring areas that do not have rainfall data by calculating the weighted average of each rain station of the impacted areas based on polygons that describe the axis lines of connecting lines between two neighboring rain station. This method can predict the average rainfall of designated neighboring areas of the rainfall measurement stations [6].
The third study uses Thiessen polygon method to search zones that affect rainfall measurement stations. In this study, Thiessen polygon determines all rainfall measurement stations in the Anantapuram district to estimate all areas affected by these stations [7].
The fourth study compares three empirical methods of rainfall estimation using the ten years rainfall data of Ogun river, Southwestern Nigeria. This study also evaluates the optimal network density to predict rainfall area and reliability to determine water sources. This research analyzes the 10-years average data (2001-2010) using ANOVA. The results exhibit little deviation of rainfall areal visualization between Thiessen polygon and Isohyetal methods. However, comparison between arithmetic mean of these two methods. This study therefore uses both methods to estimate rainfall of Ogun river topography. Further, this study also discusses the reliability of each method in measuring and extrapolating rainfall data [8].
The fifth study related to the rainfall forecasting are needed in order to support the development in different fields including agricultural areas. There is no one model or system integrating climatic classifications and the weather forecasting aiming at determination of the ideal cultivating season. This rainfall forecasting was developed by processing the previous rainfall data using the combination of Z-Score model, transformation function, and the Winters Triple Exponential Smoothing. The data resulted from the forecasting was used to determine the spatialbased climatic classification in Boyolali, Central Java,
Indonesia using Oldeman method. The proposed model is able to predict the weather using climatic classification. The rainfall data resulted from the proposed forecasting model can be used for climatic classification using Oldeman method in the research
area [9].
The sixth study mapping of agro-ecological zone, which is integrated with the suitability of land evaluation, will determine the ideal farming system. The ideal farming system including sustainable land management will support the food security scenario of a region. In this chapter, the implementation of fuzzy logic for mapping the ecological zone is discussed. The agro-ecological zone in Boyolali is used as case study in which the mapping considers its physiographic characteristics and climate. Two physiographic characteristics are involved: slope of the land and elevation. Rainfall is used as representative of climate. The experiment results reveal that simple membership function with the Mamdani inferences system could help decision makers to classify the agricultural land in Boyolali [10].
Previous studies classify climates using Oldeman classification, Schmidt-Fergusson, and standard Thiessen polygon methods The Schmidt-Ferguson comparison based on the comparison of wet and dry months. These three methods’ main weakness is that they ony use rainfall data and only emphasize water intensity. Meanwhile, climate differences are also affected by the hemisphere’s location relative to sun. Further, various temperature in different hemispheres produce different humidity for each area. Consequently, these three methods are less accurate in estimating climate of certain areas. In response to that, we propose the Thiessen polygon optimization method to improve the climate classification accuracy.
3.THEORETICAL BACKGROUND
The climate components that exhibit notable diversity is the basis of climate classification with rainfall data is the commonly used climate element. Climate classification is generally very specific in use such as for agriculture, plantation, aviation, and marine. Specific climate classifications also use climate element data as their basis, but only select related climate element data that directly affect activities or objects in these fields [7].
384 climate change will produce certain patterns or cycles, such as daily, seasonally, annually, or cycles covering several years.
Global climate change has been increasingly important information in recent years. This will likely continue in the future in response of increasing human activity. Added with increasing number of rainfall measurement posts, global climate change likely changes climate types based on Koppen classification. Meanwhile, agricultural decision making highly requires climate information of particular areas. Technological advances enable ones to integrate climate identification process of certain areas with information technology to exhibit zonal climate data in spatial figures in the forms of zones of spatial climate types. This visual figures arguably simplifies the reading and interpretation of the data [8].
3.1.Koppen Climate Classification
Wladimir Koppen classifies global climate based on rainfall, temperature, and humidity. These three climate components significantly affect the earth surface and its inhabitants. Further, Koppen classifies climate into five main climate areas that are coded A, B, C, D, and E, respectively. As a consequence of climate change and rainfall measurement posts, it is likely that climate types based on Koppen classification will be modified.
Koppen classifies global climate based on the average value of monthly and annual rainfall and temperature. He consider native plants to be the best appearance of the real climate condition. Koppen introduces that rainfall’s benefits on plants’ growth and development is not only affected by rainfall volume but also on temperature intensity that causes sufficient amount of water evaporation, both from plants or non-plants. The Koppen methods combine rainfall and temperature data to produce evaporation intensity data. For example, certain rainfall volume in the tropical climate areas or concentrated during summer implies higher evaporation level. On the contrary, same rainfall volume in temperate climate areas likely produce lower evaporation level. Koppen uses certain symbols to identify climate types. Each climate type consists of a combination of letters and each letter represents distinctive meaning. Koppen classifies the hemisphere into five climate groups [11].
3.2.Thiessen Polygon
This method takes surface areas that represent related rain stations into account as
weighting factors in determining average rainfall. This method considers weight of each station that represent surface area of surrounding locations. It is assumed that neighboring areas of a certain rain station exhibit the same rainfall level, implying that rainfall recorded by a certain station represents these areas. When rainfall level is significantly different among areas, it requires at least three rain stations to estimate rainfall data. The affected areas of the three rain station are the basis of calculating the mean value of rainfall data. Thiessen polygon method is commonly used to estimate the average rainfall of certain areas. Thiessen polygon is accommodate distance differences. Affected areas are formed by describing axis line on connecting lines of nearest rain stations. This method assumes that rainfall variation among rain stations are similar and rain station can represent neighboring areas. This method is appropriate when rain stations are not evenly spread and limitedly distributed relative to areas covered. This method calculates the weighting factors or Thiessen coefficients by including the area effect factors that represent rain station. Selection of rain station must consider the related river basins. Formula [13] calculates the Thiessen coefficient.
This method creates polygons that are perpendicular to the middle of the connecting line of two rain stations. Consequently, each rain measurement station Rn will be located on a closed
polygon area of An. By calculating the ratio of
polygon area for each station = An/A where A = basin area or reserving area and multiplying this ratio rainfall Rnt produces Rnt x (An+ A) indicating
weighted rainfall. Average rainfall is generated by adding all weighted rainfall data for each area within reserving areas. If there are n stations in reserving areas and m in neighboring areas that affect reserving areas, then the average rainfall (Rave) in equations 1, 2, and 3 will be :
Rave=
(1)
Rave=
385
Rave = + + … +
(3) where :
Rave = average rainfall (mm)
R1…R2…Rn = average rainfall of each station
(mm)
W1…W2...Wn = weighting factor of each area
Figure 1. Thiessen Polygon
3.3.Thematic Map
A thematic map (statistical map or specific-objectives map) exhibits spatial usage pattern of a particular area according to a specific theme. Its main objective is to specifically communicate concepts and data. The following are the examples of thematic maps that are commonly used in planning: kadastral map (ownership borders), zonal map (map of legal plan of land use), land use map, population density map, slope map, geology map, rainfall map, climate map, and agricultural productivity map. The objective of thematic map and terrain conditions determine data collected. Different from a referential map that exhibits geographical specialization (forests, roads, administrative borders, and climate), a thematic map tend to focus on the variation of spatial use instead of the amount of geographical distribution. This distribution refers to physical phenomena such as population density or health problems [14].
A thematic map is a map that exhibits a certain theme and for certain interests (e.g. land status, population, and transportation) by using simplified topographical map as the basis to locate thematic information [15].
4.RESEARCH METHOD
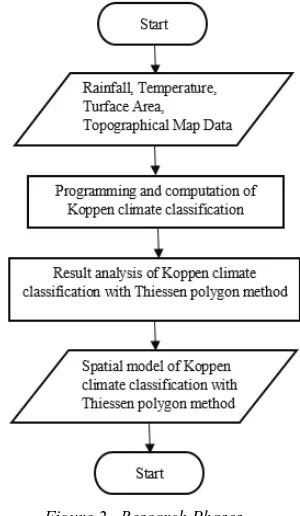
This study consists of five phases. The first step defines our research problems. Data collection follows. Thirdly, we input and analyze our data. The fourth step runs the computational process and algorithm optimization. Lastly, we implement and analyze our results. Figure 2 below exhibits our research phases.
Based on Figure 2, we derive our research problems from the answers of the following questions: 1) how to generate climate categories from Koppen climate classification based on rainfall, temperature, and width, and surface area; 2) how to categorize climate in each regency in the Central Java Province from 2007-2016 into climate that fits the categories of Koppen climate classification using the Thiessen Polygon method.
Figure 2. Research Phases
We collect our data from Jawa Tengah dalam Angka book (Central Java in Numbers)
published by Central Statisical Agency (BPS – Badan Pusat Statistik) of the Central Java Province.
Our data consists of monthly and annual rainfall, temperature, and surface areas of related regencies.
We then process the BPS raw data to generate 2007-2016 monthly minimum rainfall, 2007-2016 average temperature, and surface area of each regency/ city variables that are important for Koppen climate classification and Thiessen Polygon method. We input the processed data in excel file formatted as .csv as the database for R program in table format.
386 programming and analysis of climate classification based on Thiessen polygon method.
Our next stage analyzes model needs. This stage identifies and evaluates the existing problems in order to match the model developed with expected criteria. Our expected model requires the following inputs: regencies’ area, rainfall, temperature, and the 2007-2016 Central Java in Number data. Our model must satisfy the following needs:
- Providing information on the results of climate analysis for each regency in the Central Java Province for 2007 – 2016
- Identifying influential indicators and the magnitude of the effects
- Describing the effects of existing climate distribution on neighboring areas’ climate and identifying the distribution of its classification - Displaying the results of climate classification
of each regency; which regencies in the province exhibit Af, Am, or Aw climate from 2007 to 2016.
Next, the following are the details of process flows of the proposed model:
- Inputting rainfall, temperature, and area data into excel file formatted in .csv as our database - Inputting annual average temperature to identify
regencies’ climate classification type (A, B, C, D, or E climate classification). This variable identifies main type of climate of each regency in the Central Java Province according to annual average temperature. The monthly minimum rainfall of each regency in the province determines f, m, or w classification or the effect of rainfall on main climate. If the monthly minimum rainfall is large, regencies will be classified as Af regencies. If the monthly minimum rainfall is larger than the existing precipitation, regencies will be classified as Am regencies. If the monthly minimum rainfall is small, regencies will be classified as Aw regencies. Next, we compare each regency´s area data with its intersecting regencies´ areas. If the intersecting regencies exhibit larger effects on particular regencies, these particular regencies will exhibit changing climate. The change will be displayed in a table.
- Inputting table data into functions that will be computed by R program. These functions can identify Thiessen polygon function, neighbor list, functions to determine Koppen climate, functions to generate the effect of neighboring regencies´ climate on a particular regency´s climate, and other supporting climate such as
correlation level between variables, and functions to identify actual classification.
System implementation and computational results are computational and visualization processes of our method that will generate the results. We define codes and functions to compute Koppen climate and Thiessen polygon method. Firstly, we defined package that will be used to call and process data, to calculate and display data. The following are packages used in this phase :
- Clasint Package, class, e1071 is a package that will be used in the interval development or classification that have been calculated before and will be used in the displayed map.
- gWidgets, gWidgetsRgtk2, and cairoDevice
packages are packages to develop and display GUI (Graphical User Interface) and create menus in the system interfaces.
- Maptools package is a package to recall and and text (coordinates(Jateng)) are commands to call spatial maps and data. Figure 3 shows the map of the Central Java Province that will be used to complement Koppen climate map and map of Koppen climate that affects neighboring areas with Thiessen polygon method.
Figure 3. Map Of The Central Java Province
387 months determines the climate main types and the amount of dry months determines climate sub type.
Figure 4. Comparison Of Our Proposed Study With Previous Studies
Meanwhile, Koppen classification with Thiessen polygon method uses temperature variable as the climate main type, rainfall as climate sub type, and compares the results with surface area to determine Af, Am, and Aw climate types.
5.EXPERIMENTAL RESULTS
5.1.Thiessen Algorithm Optimization
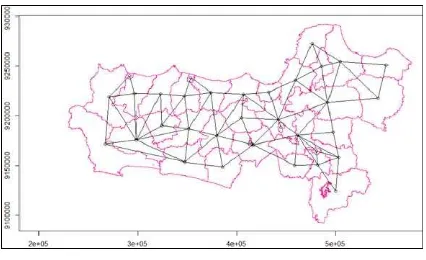
Figure 5 displays Thiessen polygon optimization algorithm for computational process in determining the average rainfall in the polygon area. The algorithm exhibits points that connect each rain station point using nearest neighbor search, where each point will be connected with the central point of each rain station. We implement the Thiessen polygon algorithm optimization to map the Koppen climate classification based on the rainfall data.
Input :
Find next c then set next t cons.stasion[N]
Else if polygon thiessen = False then Select [x + n]
Else if add t n to dummy points then do find next c n then set next t n
cons.stasion N
Else If polygon thiessen TRUE then do
End if End For
Figure 5. Thiessen Polygon Optimization Algorithm
5.2.Model Implementation and Computational Results
Figure 6 visualizes spatial model design and the implementation of Thiessen polygon algorithm.
Figure 6. The Rainfall Thematic Map Of The Central Java Province
Figure 6 shows the rainfall thematic map of the Central Java Province. Regencies with light blue color have rainfall less than 100mm. The rainfall of regencies with blue color is between 100mm and 200mm. Meanwhile, the dark blue color indicates rainfall level above 300mm.
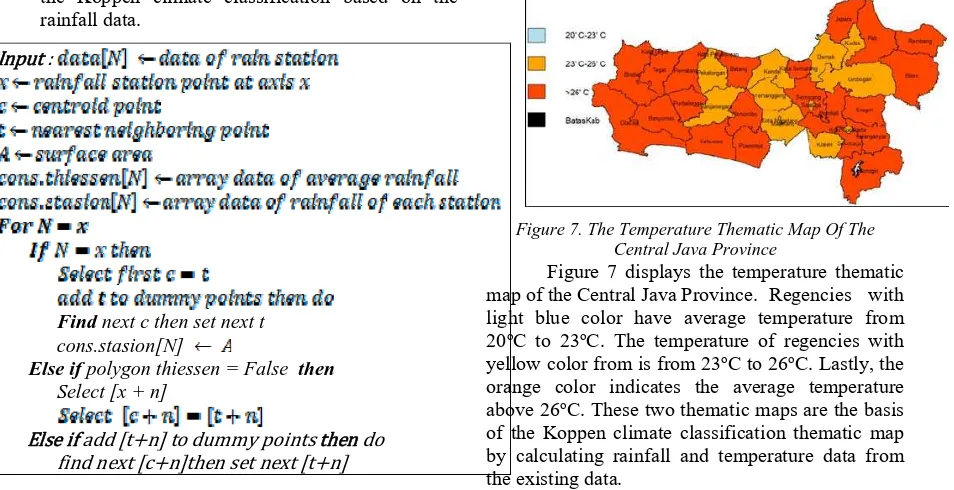
Figure 7. The Temperature Thematic Map Of The Central Java Province
Figure 7 displays the temperature thematic map of the Central Java Province. Regencies with light blue color have average temperature from 20oC to 23oC. The temperature of regencies with
yellow color from is from 23oC to 26oC. Lastly, the
orange color indicates the average temperature above 26oC. These two thematic maps are the basis
388
Figure 8. The Spatial Model Of Koppen Climate Classification Of The Central Java Province
Figure 8 displays the Koppen climate classification thematic map of the Central Java Province. Areas with light blue color are those with Aw climate type. Areas with blue color are those with Am climate type. Meanwhile, dark blue color represents areas with Af climate type. The red borderlines indicate regency borders while black borderlines represent polygon borders of each regency/ city. We calculate the Koppen climate classification based on the following formula :
r1 = 2t + 14
p1 = 10 -
p3 = 60
Af = p2 > p3
Am = p2 > p1
Aw = p2 < p1
where :
r1= temperature coefficient of Koppen climate to
determine p1
p1 = the interval border to determine Am and Aw
p2 = minimum rainfall of each area
p3 = koppen’s interval border of rainfall (60 mm)
Af = wet tropical climate according to Koppen with
rainfall > 60 mm
Am = monsoon tropical climate according to
Koppen with rainfall > p1
Aw = monsoon tropical climate according to
Koppen with rainfall < p1
Figure 9. Relation Between Areas
Figure 9 displays the relation of each regency in the Central Java Province. Number of regions refers to our research areas (35 regencies), number of nonzero links is the number of relation of
each research area (148), percentage nonzero weights is the percentage of average relation
distribution of each area (12.08%). On average, each regency intersects with other 4.23 regencies. The latest data indicates that row.names number
exhibits different relation for intersecting regions for each regency. Karanganyar Regency and Pekalongan City with ID 11 and 13 exhibit fewest relation (1), whie Blora and Rembang regencies with ID 4 and 28 exhibit the most relations with their surrounding areas (8 relations).
Figure 10. Results Of Inter-Regency Relation Network Mapping
389
Figure 11. Scatter Plot
Figure 11 exhibits scatter plot of inter-regency relationship. More specifically, this figure shows :
- Raw Scatter Plot is the raw data of rainfall
computation relative to surface area.
- expCount Scatter Plot is the expected
computational data of cases with global level assumption .
- relRisk Scatter Plot is the interconnected risk
data from observational data and expected data multiplied by 100.
- pmap Scatter Plot is probability data of
generating extreme values (max and min).
Scatter Plot at Figure 11 shows relations
between regency groups with Af, Am, and Aw. A certain variable affects existing climate change. The light blue color indicates regencies with Aw climate. The blue color represents regencies with Am climate. Clustered data implies less inter-variable value variability between different groups. Unclustered and separated data indicates that variables are well separated among groups. From this scatterplot, we develop spatial model of Koppen climate classification using Thiessen polygon method.
Figure 12. Spatial Model Of Koppen Climate Classification With Thiessen Polygon Method
where:
Aw = Dry Wet Tropical or Savanna Tropical Am = Monsoon Tropical
Af = Wet Tropical
Figure 12 exhibits the results of spatial model from the Koppen climate classification map at Figure 7 and the computation of the relations of each regency in the Central Java Province as shown by Figure 8, relational network of each regency of the Central Java Province as displayed in Figure 9, and pmap scatter plot as shown by Figure 10. The Koppen climate classification using the Thiessen polygon method indicates that for regencies in the Central Java Province, areas with light blue color exhibit Aw climate type (wet dry tropical or savanna tropical), regencies with blue color have Am climate type (monsoon tropical), and areas with dark blue color exhibit Af climate type (wet tropical). Meanwhile, the red borderlines represent borders between regencies/ cities and black lines are polygon borders for each regency/ city.
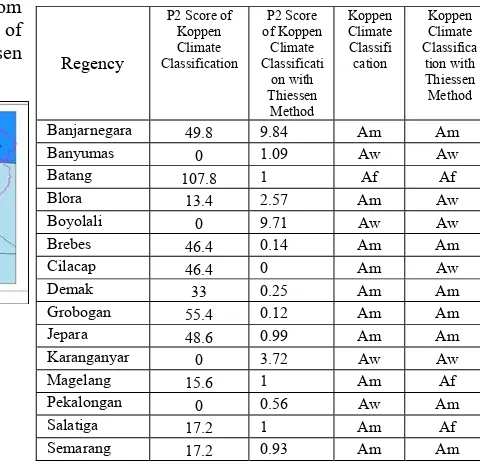
Table 1 compares the results of Koppen climate classification and Koppen climate classification using Thiessen polygon method, and Thiessen polygon method using Koppen climate classification as the reference. The Koppen climate classification p2 value refers to temperature and minimum rainfall data for five years periods. As explained before, if p2 < p1, the climate type is Aw, the climate type is Am if p2 > p1 and the climate type is Af if p2 > p3. Meanwhile, the p2 score of Koppen climate classification with Thiessen polygon method is the ratio of surface area with minimum rainfall data for five years period. If p2 < 0.1, the climate type is Aw. If p2 > 0.1, the climate type is Am, and the climate type Af when p2 ≥ 1.
Table 1 Comparisons Of Climate Classification Methods
390
6.CONCLUSION AND FUTURE WORK
Based on the system development, it can be concluded that Koppen climate classification can be used to classify climate in Indonesia, especially in the Central Java Province. We use BPS data, namely rainfall, temperature, and surface area to determine each polygon of each regency in the province. From 35 regencies in the Central Java Province, 20 regencies exhibit Am climate, 13 regencies have Aw climate and 2 regencies with Af climate. We also find that the application of Thiessen Polygon method on Koppen climate classification generates different results from the Koppen climate classification itself. More specifically, 18 regencies have Aw climate, 13 regencies with Am climate, and 4 regencies with Af climate.
Our study can be used for informational reference for provincial or municipal agencies dealing with agricultural, transportation, and other fields that are related to the use of Koppen climate classification. It is expected that the availability of visual information will enable visual climate information searching process better and more accurately and optimize the natural resource potentials.
ACKNOWLEDGMENTS
This work was supported excellent research College skim by RISTEKDIKTI Indonesia with contract number 042/SPK-PUPT/PR V/4/2017.
REFERENCES
[1] Anonimus (1), 2012. Climate and Climate Change Explained, http://iklim.dirgantara- lapan.or.id/
index.php?option=com_content&view=article &id=79. Accessed on November 17 2012. [2] Anonimus (2). 2012, Climate,
http://id.wikipedia.org /wiki/Iklim. Accessed on November 17, 2012.
[3] Sudrajat, A., 2010. Mapping of Oldeman and Schmidt-Ferguson Climate Classification as an Effort to Utilize Climate Resources in Managing Natural Resources in North Sumatera,
repository.usu.ac.id/bitstream/.../1/10E00148. pdf, accessed on November 17, 2012.
[4] Susandi, A. and R. S. J. tol, 2002. Impact of International Climate Policy on Indonesia, Pacific and Asian Journal of Energy 12 (2): 111-121.
[5] Dong, P., 2008. Generating And Updating Multiplicatively Weighted Voronoi Diagrams For Point, Line And Polygon Features In GIS. Computers & Geosciences Journal Available online at www.tjeas.com [6] Ningsih, D. H. U., 2012. Thiessen Polygon
Method to Forecast Rainfall Distribution of Certain Periods for Areas with No Hydrologic Rainfall Data. Jurnal Teknologi Informasi DINAMIK Vol. 17, No. 2 : 154-163, Yogyakarta.
[7] Bhavani, R., 2013. Construction of Theissen Polygons for Rain Gauge Stations in Anantapuram District. International Journal of Computational Engineering Research Vol:03 Issue:6.
[8] Eruola, A. O., 2015. Determination Of Areal Rainfall Using Estimation Methods In A Tropical Wet And Dry Climate. Merit Research Journal of Environmental Science and Toxicology (ISSN: 2350-2266) Vol. 3(7) pp. 079-082.
391 [10] Simanjuntak , B. H. et al, 2015. Application
of Fuzzy Logic for Mapping the Agro-Ecological Zones,Handbook of Research on Artificial Intelligence Techniques and Algorithms, Page : 27, IGI Global, DOI: 10.4018/978-1-4666-7258-1.ch011. [11] Winarso, P. A., 2003. Climate or Season
Variability/ Deviation in Indonesia and Its Development. Paper presented at National Seminar Soil Science. KMIT Department of Soil Science, Faculty of Agriculture UGM. Yogyakarta. http://lib.ugm.ac.id/digitasi/ index.php?module=cari_hasil_full&idbuku=1 316. Accessed on December 17 2010.
[12] Rafi’i, S., 1995. Meteorology and Climatology. Angkasa. Bandung.
[13] Lakitan, B., 2002. Principles of Climatology, 2nd ed). Raja Grafindo Persada. Jakarta. [14] Susandi, A. and R. S. J. tol, 2002. Impact of
International Climate Policy on Indonesia, Pacific and Asian Journal of Energy 12 (2): 111-121.
[15] Wisnubroto S., Aminah. L. S., Mulyono, N., 1983. Principles of Agricultural Meteorology, Jakarta Timur : Yudhistira.
[16] Triatmodjo, B., 2008. Applied Hydrology. Beta Offset, Yogyakarta.
[17] Soemarto, C. D., 1999. Technical Hydrology, Penerbit Erlangga, Jakarta.
[18] Harto, S., 1993. Hydrological Analysis. Gramedia Pustaka Utama, Jakarta.
[19] Suripin, 2004. Sustainable Urban Drainage, ANDI OFFSET, Yogyakarta.
[20] Anonimus (3), 2012. Thematic Map, http://id.wikipedia.org/wiki/Peta_tematik. Accessed on November 17 2012.