Comparison between Image Correlation and Projection
Correlation in CT Image Reconstruction with Limited
Data
Rena Widita
Department of Physics, Faculty of Mathematics and Natural Sciences Institut Teknologi Bandung
KEYWORDS
ABSTRACT
image reconstruction; image correlation; projection correlation; simulated annealing
Since the improvement in radiotherapy impacts on cancers at their most curable stages, radiotherapy-related research has a high strategic priority and a great capacity for improving the overall cure rates of the disease. However, some of the treatments involve the delivery of relatively high radiation dose to patients. Thus, it is important to be able to verify the success of the treatment by determining the dose deposited in the patient at each fraction. One possibility to achieve this would be to obtain an image while the patient is on the treatment couch. The aim of this study was to develop an image reconstruction algorithm by collecting limited information while the patient is on the treatment couch. Two methods, image correlation and projection correlation, were developed and compared here. The effectiveness and practicality of each of these methods were compared. The results showed that the projection correlation presents several advantages. It can be applied without any interations, and it produces a fast algorithm. With more advanced image reconstruction software, this method could potentially be used in a clinical environment.
A common factor in all advances in treatment planning techniques is that they help to achieve the primary objective of radiotherapy, which is to deliver a sufficiently high and as homogeneous a dose as possible to the planning target volume (PTV), at the same time diminishing the chances for complications in surrounding tissue to the lowest possible level. Yet treatment planning can be very complex. The presence of organs-at-risk (OARs), critical structures located very close to the target, is the major problem in planning. Overdosing with radiation within the critical structure may lead to medical complications. Another challenge would be that tumors often have irregular shapes. Additionally, the target volume and the OARs may move within the patient relative to the bony structures and/or change their shape. When organ motion is considered,
the margins are often quite large to ensure sufficient dose coverage of the tumour, resulting in higher doses delivered to the
normal tissues. Improvement in
radiotherapy treatments may be achieved by reducing the set-up uncertainty and thus treatment margins allowing a higher dose to be delivered to the target volume. As the margins around the tumour are reduced, it becomes more important to be able to verify the success of the treatment by determining the dose deposited in the patient.
The deposited dose can be determined by using the energy fluence in conjunction with CT image in the treatment
Correspondence:
position. This image must be obtained for every fraction. Previous research has invest-tigated the possibility of obtaining images and determining deposited dose during treatment using specialized equipment (Kapatoes et al., 1999, Kapatoes et al., 2001). The major obstacle in applying this method is the limitation of the standard radiotherapy equipment in most hospitals. This standard equipment does not have built-in imaging devices. The patient has to be moved to the imaging devices (such as CT scanning) to obtain the daily image, which is not so practical.
The purpose of this study was to develop an image reconstruction algorithm by collecting limited information while the patient is on the treatment couch. In this work, two methods, i.e. image correlation and projection correlation, were developed and compared. The effectiveness and practicality of these methods were then compared.
Image Reconstruction
Image reconstruction is the process of converting the transmission data for individual views into a digital image of the body section. Generally, one of two methods is used in reconstructing images: analytical or iterative methods. In this study, the algebraic reconstruction technique (ART) was used due to its superiority in the situation where only a small number of projections can be produced (Kak, 1999). Even though this method lacks the accuracy and the speed of implementation for medical applications, it can be more amenable to the situation where the projections are not uniformly distributed over 180o or 360o, or where it is not possible to measure a large number of projections (Kak, 1999).
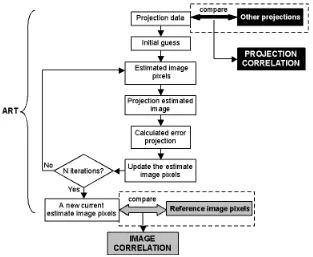
The iterative process repeats a series of updates (iterations) to the reconstructed image. The basic ART algorithm is referred to as weighted ART and is discussed in detail by Herman (1980) and Kak (1999). In this study, the reconstruction area is a square space of 100x100 small pixels. The concept of image reconstruction by the ART can be seen in figure 1. The unshaded flow chart represents the ART algorithm.
Objective Function
The reconstructed images using a few beam angles yield a low quality image. An objective function to rank the image quality is required to automate the decision process in determining the optimum angles. Two objective functions based on correlation, image correlation and projection correlation, were developed and compared. Each of these allows the images produced from a limited number of angles to be ranked. Both algorithms used here are geometry-free algorithms and thus do not require particular source-detector geometry such as in parallel-beam or fan beam CT. These algorithms are described as follows.
Image Correlation. Image correlation, in
this instance, is a measure of resemblance between two images of the same size, the original (reference) image and the reconstructed image, and then finding those portions that match according to the measure of correlation. It measures how strongly the variables are related, or change, with each other. In our case the variables are the pixel values.
In this method, a set of angles has to be determined at the beginning and then the reconstruction technique (ART) must be applied to obtain a reconstructed image. The reconstructed image is then compared to the reference image to obtain the image correlation value. The process of determining image correlation can be seen in figure 1 (the gray boxes).
For this investigation the reference image is a CT image which has been obtained with a significant number of beam angles, for instance the initial planning CT image. Suppose a is the matrix of the reference image and a' is the matrix of the reconstructed image as follows,
' two-dimensional image correlation value
between the reference image a and the reconstructed image a'.
N good images and low for bad images.
error projection calculation for each iteration, and image pixels update. Because of the massive number of iterations needed, this algorithm is very time consuming. Thus, another method as described below was proposed to reduce the computational cost.
Projection Correlation. The steps required
in the image correlation algorithm, as mentioned above result in this algorithm having a very high computational cost. The goal of this method was to process data at a reasonable computational cost while still achieving acceptable results. This concept assesses the image information before the reconstruction is undertaken thus saving the time required to reconstruct the images to be compared (see the black boxes in Figure 1). The relationship (correlation) among a group of projections to obtain an
image was investigated. The objective is to simplify its mathematical formulation and to process data in a reasonable amount of time.
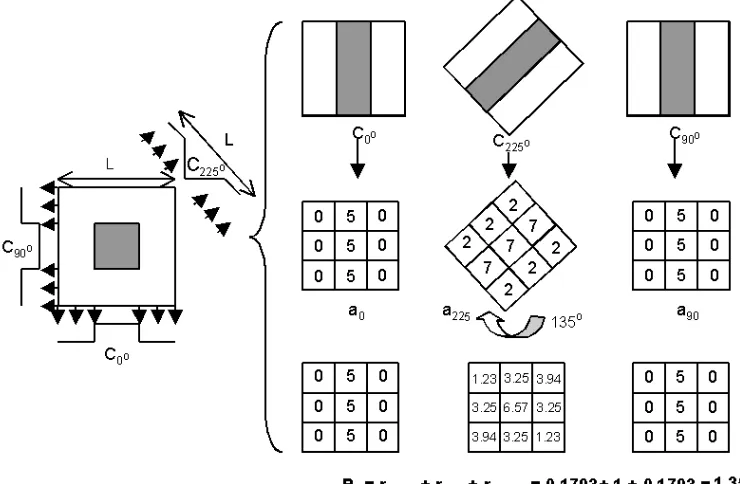
Projection correlation is a method of estimating the degree to which a group of projections are correlated. Before calculating the correlation, the image matrixes representing the initial pixel values are set. These values come from the projection data used. The projection correlation then considers the correlation between the initial pixel values. The concept of the projection correlation can be seen in Figure 2.
The computational procedure starts with an initial guess. Suppose Cθ is the
projection data from the CT at angle θ, then
Cjθ is the projection for column j at angle θ,
the pixel values for matrix aθ can then be determined as defined below
the matrix. These pixel values are needed to
fill up a matrix. Hence, the matrix can be
projections, the projection correlation Pr is defined as
and the jthprojection (see eq.2). In projection
correlation, in contrast with image correla-tion, it is expected that the correlation would be low for good images. This is because a set of projections which contain dissimilar information (uncorrelated) to each other would give a superior result compared with those containing similar information to each other (correlated) for
the final image. Thus by minimizing the projection correlation, the reconstructed image will converge toward the sought-after original image.
calculate both values for all possible combinations in a reasonable time, small numbers of angles were chosen. The image correlation and projection correlation values have been calculated for all combinations of
7 and 9 angles selected from 12 and 15 angles equally spaced at 30o and 24o angular increments respectively (in brief this will be referred to as 7-12, 9-12, 7-15, and 9-15 for the remainder of the paper).
Figure 2. The concept of projection correlation
Investigations
Before the image correlation algorithm was run, the number of iterations used for the ART had to be decided. The images achieved with various iteration numbers using various numbers of projection data were then compared to determine the number of iterations. For all cases, 3 iterations were chosen because more than 3 iterations gave no significant improvement. Using this number of iterations, the image correlation values have been calculated for all combinations of 7-12, 7-15, 9-12 and 9-15 angles. The image correlation was used as a gold standard.
The projection correlation values were also calculated for the same combinations. The image correlation values were ranked and compared to the
projection correlation values with the same combination to see the relationship between both values. This comparison was aimed to decide whether or not the projection correlation algorithm was an acceptable objective function. Once this method was assessed, more projection data could be applied to determine the optimum angles.
The image reconstruction investiga-tions are presented for a CT image of brain (Figure 3a.). Figure 3 shows the reconstruction image using the ART
algorithm for using 72 beams and 12 beams equally spaced at 5o and 30o angular increments, respectively. As expected, the more beams used, the better the results.
Figure 3. The reconstruction image using ART for brain (a) The original image (b) 72 beams with 3 iterations (c) 12 beams with 3 iterations
DISCUSSION
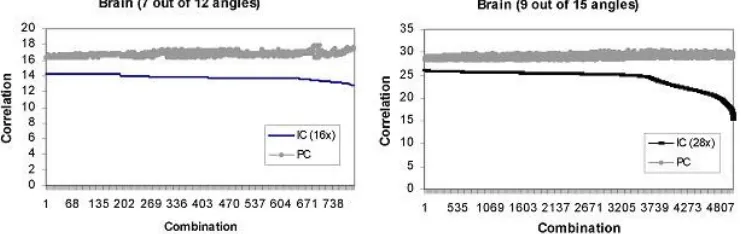
The relationship between image correlation and projection correlation values can be seen in Figure 4. As expected, it shows that the projection correlation value is low for good images, while for the image correlation the value is high for good images. Although there is some noise in the projection correlation values the relative increase and decrease when comparing the projection and image correlation shows the clear relationship between the two objective functions. When the image correlation value is high, projection correlation value is low. 85% of the best 30% of projection correlation results are within the best 32% of image
correlation results, so although not exactly correlated it is expected that they will produce acceptable results. The primary practical difference between these algorithms is the time requirement. Projection correlation can be applied without any iterations and it produces a fast algorithm. It is approximately 25 times faster than the image correlation algorithm and it is easy to implement. When reconstruction time is an important determinant, the projection correlation can be applied successfully. Thus, by minimizing the projection correlation value, the reconstructed image will converge toward the sought-after original image.
The best areas for projection correlation are seen in the same areas as that for image correlation, as are the worst areas, with the noise significantly reduced from the 7-12 and the 9-15 selections. These
results indicate that the projection correlation will work very well when fewer angles are selected from a particular number of angles. For example, the results of 7-12 are superior to those of 9-12.
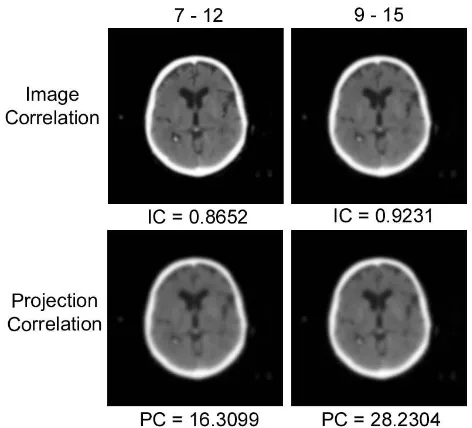
Figure 5. The best reconstruction of brain
The best reconstruction using both algorithms is illustrated in figure 5. It agrees that the average correlation value has no significant difference; there are also no major differences in terms of quality between the results from the image and projection correlation algorithms. The major difference between these algorithms is time required. The image correlation algorithm is very time consuming, especially when it is applied to the stochastic optimization. Based on these results above, the projection correlation algorithm gives similar quality images to the image correlation algorithm. Moreover the projection correlation algorithm is about 25 times faster than the image correlation.
As predicted, as more angles are used, the results improve. The results of 7-12, 7-15, and 9-12 angles have a very similar quality thus here figure 5 only shows the image of 7-12 and 9-15.
CONCLUSION
Two methods, image correlation and projection correlation, were developed and compared to investigate the determination of optimal angles to be used to reconstruct an image for anatomical and dose verifica-tion. All methods considered improved the image quality for a given number of angles by selecting optimal angles. The primary difference between them is the time requirement. Projection correlation is easy to implement. It can also be applied without any iterations which produces a fast algorithm. It is approximately 25 times faster than the image correlation. Thus the projection correlation algorithm offers several advantages.
optimum angles for individual treatment plans. It works most effectively when fewer angles are selected from a particular number of angles, thus more variations are possible. Together with more advanced image reconstruction software these algorithms could potentially be used in a clinical environment where selecting relatively few angles for a large initial number will be the likely scenario.
Herman GT 1980. Image Reconstruction From Projection: The Fundamental of Computerized Projections, Academic Press.
Kak AC, & Slaney M 1999. Principles of computerized tomographic imaging, IEEE Press.
Kapatoes JM, Olivera GH, Reckwerdt PJ, Fitchard EE, Schloesser EA, & Mackie TR 1999. Delivery verification in sequential and helical tomotherapy.
Physics in Medicine and Biology, 44, 1815-1841.
Kapatoes JM, Olivera GH, Balog JP, Keller H, Reckwerdt PJ, & Mackie TR 2001. On the accuracy and effectiveness of dose reconstruction for
tomotherapy. Physics in Medicine and Biology, 46,