* Corresponding author. e-mail: [email protected]
Non Paramectric Stability Analysis for Yield of Hybrid Chili Pepper (Capsicum annuum L.) Across Six Different Environments
Muhamad Syukur1*, Sriani Sujiprihati1, Rahmi Yunianti1, and Darmawan Asta Kusumah2
1Department of Agronomy and Horticulture, Faculty of Agriculture, Bogor Agricultural University
Jl. Meranti, Kampus IPB Darmaga, Bogor 16680, Indonesia
2PT. Esa Sampoerna, Gd. Esa Sampoerna Lt 7 Jl. Dr. Ir. H. Soekarno No. 198
Surabaya, Jawa Timur 60177, Indonesia
Received 6 May 2013/Accepted 10 September 2013
ABSTRACT
The objectives of this study were to evaluate several chili pepper hybrids whith high yielding character and stable at six environments based on some parametric stability analyses, and to study the correlation among the stability of non-parametric methods. The hybrid of chili pepper (7 candidates varieties and 5 commercial hybrid cultivars) were grown in a randomized complete block design with 3 replications in 6 different environments. Ten nonparametric stability methods were used to identify the stable genotypes. According to the SI(3), RS, NPi(1), NPi(2), NPi(3) and NPi(4) stability parameters, Imperial was the most stable hybrid. According to the SI(1), SI(2) and TOP stability parameters and yield, IPB CH3 was the most stable hybrid. In this study, the high TOP values were associated with the yield. Nonetheless, the results of the other non parametric (SI(6), NPi(3) and NPi(4)) were negatively correlated to the yield. The results also revealed that based on the non parametric stability test, the results could be classified into 2 groups, according to the agronomic and biological stabilities.
Keywords: chili pepper, environment, non-parametric stability, yield
ABSTRAK
Penelitian ini bertujuan untuk mengevaluasi stabilitas hasil berbagai hibrida cabai yang berdaya hasil tinggi di enam lingkungan berdasarkan analisis stabilitas non parametric, dan mempelajari korelasi antar metode stabilitas non parametrik. Dua belas hibrida cabai (7 kandidat varietas dan 5 varietas komersial) ditanam dengan rancangan kelompok lengkap teracak menggunakan tiga ulangan pada enam lingkungan berbeda. Sepuluh metode stabilitas non parametrik digunakan untuk mengidentifikasi genotipe yang stabil. Menurut parameter stabiltas SI(3), RS, NPi(1), NPi(2), NPi(3) dan NPi(4), hibrida yang paling stabil adalah Imperial. Menurut parameter stabilitas SI(1), SI(2), TOP dan hasil, IPB CH3 adalah hibrida yang paling stabil. Pada penelitian ini, nilai TOP yang tinggi berhubungan dengan hasil. Namun demikian, parameter stabilitas SI(6), NPi(3) dan NPi(4) berkorelasi negatif terhadap hasil. Hasil penelitian juga mengungkapkan bahwa berdasarkan analisis stabilitas non parametrik, hibrida-hibrida yang diuji diklasifikasikan menjadi 2 kelompok yaitu stabil agronomis (dinamis) dan stabil biologis (statis).
Kata kunci: cabai, hasil, lingkungan, stabilitas non parametrik
INTRODUCTION
Chili pepper is one of the essential commodities and vegetables with a high economic value in Indonesia. This plant is well developed in the lowlands as well as in the highlands. According to Badan Pusat Statistik (2011), the productivity of the national chili pepper Indonesia in 2010 was 5.6 ton ha-1. However, the productivity of chili
peper is still very low compared to its production potential. According to Syukur et al. (2010) the potential produktivity of national chili may reach 22 ton ha-1.
To meet the high demand, various efforts for improving the productivity of chili pepper is needed. Seed quality of
improved cultivars are one of the factors that influence the success of the production in agriculture. One alternative to increase chili pepper productivity is cultivar improvement, including hybrid cultivars. The productivity of hybrid cultivars is higher than the open pollinated variety (OPV). Improved results of chili pepper hybrids can achieve 61% higher than that of their parents (Syukur et al., 2012).
contrary if a small interaction of genotype x environment is observed, then the cultivar can be developed in to widely adapted cultivars (Syukur et al., 2012).
The stability of a genotype (entry) is the genotype ability to live in several different environments, so that the phenotype does not undergo much change in each environment. The stability analysis has been developed by researchers to help breeders to analyze the genotype x environment interaction, yield stability, and relevance of the yield stability with the interaction of environment (Akcura et al., 2006).
There are two approaches for studying the stability of a genotype, namely the parametric and non-parametric approach. Parametric approach based on the assumption that genotype, environment and GEI have normal distribution. The non-parametric approach is an approach that links of the environment and phenotype, relative to environmental factors are biotic or abiotic without making the assumption of specific models. In practice, the breeding program combines these two approaches. The parametric approach is the best used if the assumption of the normal error distribution and interaction effect can be fulfilled. However, this assumption is very sensitive to not satisfied (violated), therefore it needs to find another alternative which is a non-parametric approach (Sabaghnia et al., 2006).
Several methods for non parametric stability analysis were used by Sabaghnia et al. (2006), Mohammadi et al. (2007), Solomon et al. (2007), Yaghotipoor and Farshadfar (2007), Mut et al., (2009), Shah et al. (2009), Balalic et al. (2011), Zali et al. (2011), Farshadfar et al. (2012) and Mahtabi et al. (2013). The non-parametric procedure is based on the position of genotypes in each environment. The genotypes are in the position (ranking) which is the same in each environment are classified as stable. Four measurements of non parametric phenotypic stability according to Nassar and Huehn (Nassar and Huehn, 1987) are the SI(1), SI(2), SI(3)
and SI(6). SI(1) is the mean of the difference in the absolute
position of a genotype in n environments. SI(2) is the
variance among the rranks over the n environments. SI(3) is
the sum of the absolute deviation. SI(6) is the sum of square
of the ranking for each genotype relatively the mean of the rankings. The non-parametric stability according to Kang (1988) is the rank of sum (RS). The Kang method combines the yield value and variant of the Shukla stability. The highest mean of yield and the lowest variant are given first ranking, respectively. The sum of the two ranks produced the final index. Genotype which has the lowest index is the most stable. Estimation of the non-parametric stability according to the Fox Method (Fox et al., 1990) is a rank for each genotype for each environment which are classified into three parts, namely Top, Mid and Low. Genotype that is always on the Top is the most adaptive. Thennarasu (1995) gives estimates of stability of non parametric (NPi(1), NPi(2),
NPi(3) and NPi(4)) based on the ranks of adjusted means of
the genotypes in each environment. The genotype is stable if its position is always fixed on the test environment.
In previous studies the parametric stability analysis of yield of chili pepper has been presented. IPB CH28, IPB stability analysis of yield of open pollinated chili pepper has been presented (Rahadi et al., 2013).
This study aims (i) to evaluate several genotypes of chili pepper hybrids which is the high yielding and stable based on some non-parametric stability analysis, (ii) to study the correlation among the stability of non-parametric methods.
MATERIALS AND METHODS
This study was conducted at Ciherang, Tajur and Leuwikopo (Bogor District, West Java; ± 190 m above sea level (asl)), Subang (Subang District, West Java; ± 47 m asl), Rembang (Rembang District, Central Java, ± 47 m asl;) and Boyolali (Boyolali District, Central Java ± 104 m asl). The research was conducted from November 2006 to May 2007 (at Ciherang, Leuwikopo and Tajur) and from January to June 2008 (at Subang, Rembang and Boyolali).
The materials used were 12 genotypes including seven genotypes of IPB’s hybrid chili pepper genotypes i.e. IPB CH1, IPB CH2 IPB CH3, IPB CH5, IPB CH25, IPB CH28, IPB CH50 and five commercial varieties i.e. Adipati, Gada, Biola, Hot Beauty and Imperial.
The experiment was arranged in randomized complete block design with two factors and three replications nested in environment. Each experimental unit consisted of 20 plants. A combined analysis of variance was performed across six environments, to study the genotype influence, environment effects and GEI. Barlett’s test for the analysis of variance was performed before the data were combined analyzed. The combined analysis of variance for several environments was conducted according to Syukur et al. (2012).
The cultivation techniques used in the six environments was a standard technique in chili pepper cultivation. One unit of the experiment consisted of 20 plants that were planted in beds measuring 1 m x 5 m covered with silver black plastic mulch, planting distance of 50 cm x 50 cm. Seedlings were transferred to the field after 4-6 leaves appeared (± 5 weeks old). Fertilization should be done every week, in the form of a solution of 10 g NPK Mutiara per liter of water, with a dose of 250 mL plant-1. Fertilizer of Gandasil D and B
(2 g L-1 for each) were gives at vegetative and generative
phase, respectively, and sprayed together with insecticides and fungicides treatment. Observed variable was yield (g plant-1)
n is the number of environments, rij is the rank of the ith the median rank all environments. In addition the approach also used the Kang method (Kang, 1988) and Fox method (Fox et al., 1990). Data analysis used SAS software version 9 and excel 2003.
RESULTS AND DISCUSSION
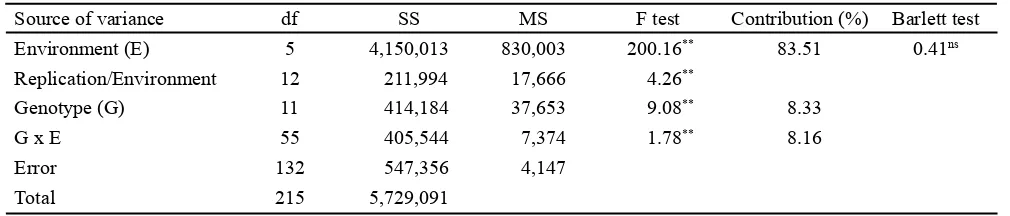
Based on the Barlett’s test, the data obtained were homogenous for all study environments (p = 0.41). Therefore, the data analysis was continued to combine variance analysis. The combined variance analysis showed that genotypes, environment and GEI significantly influenced the yield. Sum square of environments contributes 83.51%, genotypes 8.33% and GEI 8.16% (Table 1). Thus, chili production will depend on the environmental conditions and the genotype.
The estimation of SI(1) is based on the mean of absolute
rank differences of a genotype over the n environments and SI(2) is the variance among the ranks over the n environments
(Nassar and Huehn, 1987). Both of these stability parameters result in similarity genotypes rank (Sabaghnia et al., 2006; Mut et al., 2009). For example, based on both these genotypes in each environment (Nassar and Huehn, 1987). The lowest value of the parameter indicates the most stable
genotype (Sabaghnia et al., 2006). Imperial, IPB CH3 and IPB CH5 were ranked 1, 2 and 3 based on the parameters of SI(3), respectively. IPB CH50 was the most unstable
genotype. Based on the parameters SI(6), the three most stable
genotype was the IPB CH5, Imperial and Adipati. The IPB CH50 was the most unstable genotype (Table 2 and 3).
The parameter rank-sum (RS) uses the variance of stability and yield (Kang, 1988). Genotypes with the lowest value of RS are the most desirable genotypes (Sabaghnia et al., 2006; Mut et al., 2009). According to the parameters of the RS, Gada and IPB CH28 were the most stable genotype followed by Biola and IPB CH1. IPB CH5 was the most unstable genotype (Table 2 and 3).
Non-parametric stability parameter Fox et al. (1990) divides each genotype into the top, medium and low based on the percentage of all test environments. The genotype on the top can adapt and stable in a test environment, relatively. Based on these parameters, IPB CH3 was the most stable, followed by the IPB CH25 and IPB CH1. Biola, Gada, Hot Beauty, Imperial and IPB CH5 were not stable (Tables 2 and 3).
Genotypes that have the lowest value of NPi(1), Ni(2),
NPi(3) and NPi(4) was the most stable (Mut et al., 2009).
Based on these parameters, Imperial was the most stable genotype, followed by Hot Beauty and Gada. IPB CH3 was the most unstable genotype (Tables 2 and 3).
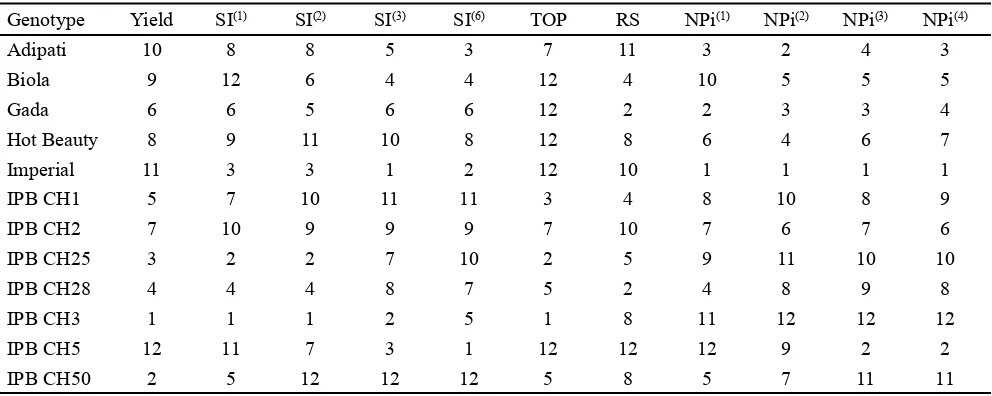
Based on yield, IPB CH3 was ranked as the highest followed by IPB CH50, IPB CH25 and IPB CH28. The yield of IPB CH3 was higher than the other genotypes. IPB CH3 was the first rank based on non parametric stability parameter SI(1), SI(2), TOP and yield, while Imperial was the
first rank based on the SI(3), RS, NPi(1), NPi(2), NPi(3) and
NPi(4) (Table 3).
Based on cluster analysis using the yield and 10 non-parametric stability parameters, genotypes clustered in four groups at 90% similarity level. The genotypes were in the same group has a similarity level of stability. Hot Beauty, IPB CH2, IPB CH1, IPB CH50 were in the same group (group 1). IPB CH25, IPB CH28 and IPB CH3 were in group 2, while Biola and IPB CH5 were in group 3, and Adipati, Imperial and Gada were in group 4 (Figure 1).
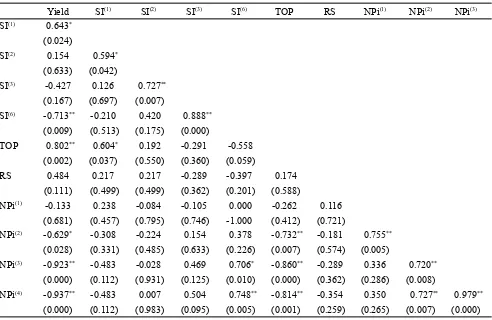
Each non-parametric stability methods result a unique ranking of genotype (Table 3). Yield correlated significantly (P <0.05) and positively to the SI(1) and NPi(2) parameters. In
addition, the yield correlated highly significant (P <0.01) and
.
Source of variance df SS MS F test Contribution (%) Barlett test
Environment (E) 5 4,150,013 830,003 200.16** 83.51 0.41ns
Replication/Environment 12 211,994 17,666 4.26**
Genotype (G) 11 414,184 37,653 9.08** 8.33
G x E 55 405,544 7,374 1.78** 8.16
Error 132 547,356 4,147
Total 215 5,729,091
Tabel 1. Analysis of variance for yield of 12 chili pepper hybrids at 6 environments
positive to TOP parameters, and negatively correlated to the SI(6), NPi(3) and NPi(4) parameters. SI(1) parameters positively
correlated to SI(2) and TOP; SI(2) parameters positively
correlated to the SI(3); SI(3) parameters positively correlated
to the SI(4); and SI(6) parameters positively correlated to the
NPi(4), and NPi(3).
TOP parameters had highly significant negative correlation to the NPi(2), NPi(3) and NPi(4). NPi(1) parameter
had highly significant positive correlation to the NPi(2); NPi(2)
parameter had highly significant positive correlation to the NPi(3) and NPi(4); NPi(3) parameter had highly significant
positive correlation to the NPi(4) (Table 4). Similar results
were also found in the writings of Sabaghnia et al. (2006).
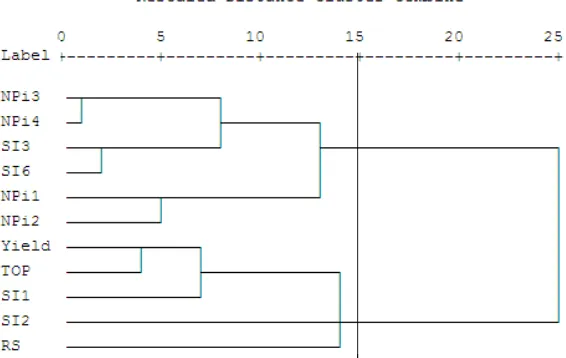
Based on cluster analysis using the variable stability, yield and 10 methods of stability were clustered into 2 groups (at 85% similarity level). NPi(1) and NPi(2), NPi(3), NPi(4),
SI(3) and SI(6) Parameters were in the same group (group 1).
Parameters TOP, yield, SI(1), SI(2) and RS were in group 2
(Figure 2). According to Solomon et al. (2007), TOP, yield and RS parameters were on the same group, while SI(1) and
SI(2) were in different groups.
Sabaghnia et al. (2006) and Mut et al. (2009) stated that TOP, yield and RS belong to the dynamic stability (agronomic stability), while eight other parameters include to the static stability. Dynamic stability is the stability associated with the yield response, in parallel with an
Genotype Yield
(g plant-1) SI
(1) SI(2) SI(3) SI(6) TOP MID LOW RS NPi(1) NPi(2) NPi(3) NPi(4)
Adipati 344.44 6.80 11.00 5.50 1.30 5.56 5.56 88.89 17 2.17 0.27 0.57 0.34
Biola 348.84 7.07 9.20 5.11 1.78 0.00 5.56 94.44 11 3.50 0.32 0.58 0.47
Gada 375.31 5.47 7.00 5.83 2.17 0.00 11.11 88.89 7 1.83 0.31 0.41 0.46
Hot Beauty 362.52 6.80 12.60 7.88 2.38 0.00 11.11 88.89 13 3.17 0.32 0.75 0.56
Imperial 344.04 4.53 4.60 2.09 1.00 0.00 16.67 83.33 15 0.83 0.07 0.23 0.12
IPB CH1 414.12 5.73 11.20 11.20 3.60 16.67 5.56 77.78 11 3.17 1.06 0.92 0.85 IPB CH2 372.44 6.93 11.00 7.86 2.43 5.56 16.67 77.78 15 3.17 0.35 0.91 0.49 IPB CH25 430.65 3.87 4.60 7.67 3.00 27.78 11.11 61.11 12 3.17 1.58 1.68 1.27
IPB CH28 418.07 4.53 6.20 7.75 2.25 11.11 11.11 77.78 7 2.50 0.63 1.48 0.83
IPB CH3 555.51 1.20 0.80 4.00 2.00 55.56 22.22 22.22 13 3.50 3.50 5.43 5.20 IPB CH5 256.64 6.93 10.40 4.33 0.83 0.00 5.56 94.44 22 4.50 0.64 0.40 0.44
IPB CH50 436.88 5.33 17.40 43.50 8.50 11.11 11.11 77.78 13 2.83 0.57 1.77 1.73
Table 2. The yield and non-parametric stability parameters of 12 chili pepper hybrids at 6 environments
Note: SI(1), SI(2), SI(3), SI(6) were based on the parameters Nassar and Huehn (1987); TOP, MID, and LOW were parameters based on Fox et
al. (1990); RS was based on the parameters Kang (1988); NPi(1), NPi(2), NPi(3) and NPi(4) were parameters based Thennarasu (1995)
Genotype Yield SI(1) SI(2) SI(3) SI(6) TOP RS NPi(1) NPi(2) NPi(3) NPi(4)
Adipati 10 8 8 5 3 7 11 3 2 4 3
Biola 9 12 6 4 4 12 4 10 5 5 5
Gada 6 6 5 6 6 12 2 2 3 3 4
Hot Beauty 8 9 11 10 8 12 8 6 4 6 7
Imperial 11 3 3 1 2 12 10 1 1 1 1
IPB CH1 5 7 10 11 11 3 4 8 10 8 9
IPB CH2 7 10 9 9 9 7 10 7 6 7 6
IPB CH25 3 2 2 7 10 2 5 9 11 10 10
IPB CH28 4 4 4 8 7 5 2 4 8 9 8
IPB CH3 1 1 1 2 5 1 8 11 12 12 12
IPB CH5 12 11 7 3 1 12 12 12 9 2 2
IPB CH50 2 5 12 12 12 5 8 5 7 11 11
Table 3. Rangking of 12 chili pepper hybrids based on 10 non parametric stability analysis and yield
Note: SI(1), SI(2), SI(3), SI(6) were based on the parameters Nassar and Huehn (1987); TOP, MID, and LOW were parameters based on Fox et
average response of genotype testing. The stability of a genotype depends on the contribution of other genotypes. Static stability is also called a biological stability. The
biologically stable genotypes tend to have a fixed level of productivity in all environments. The stability of a genotype is independent to the other genotypes.
Figure 1. Dendogram of 12 chili pepper hybrids based on 10 non parametric stability analysis and yield
Yield SI(1) SI(2) SI(3) SI(6) TOP RS NPi(1) NPi(2) NPi(3)
SI(1) 0.643*
(0.024)
SI(2) 0.154 0.594*
(0.633) (0.042)
SI(3) -0.427 0.126 0.727**
(0.167) (0.697) (0.007)
SI(6) -0.713** -0.210 0.420 0.888**
(0.009) (0.513) (0.175) (0.000)
TOP 0.802** 0.604* 0.192 -0.291 -0.558
(0.002) (0.037) (0.550) (0.360) (0.059)
RS 0.484 0.217 0.217 -0.289 -0.397 0.174
(0.111) (0.499) (0.499) (0.362) (0.201) (0.588)
NPi(1) -0.133 0.238 -0.084 -0.105 0.000 -0.262 0.116
(0.681) (0.457) (0.795) (0.746) -1.000 (0.412) (0.721)
NPi(2) -0.629* -0.308 -0.224 0.154 0.378 -0.732** -0.181 0.755**
(0.028) (0.331) (0.485) (0.633) (0.226) (0.007) (0.574) (0.005)
NPi(3) -0.923** -0.483 -0.028 0.469 0.706* -0.860** -0.289 0.336 0.720**
(0.000) (0.112) (0.931) (0.125) (0.010) (0.000) (0.362) (0.286) (0.008)
NPi(4) -0.937** -0.483 0.007 0.504 0.748** -0.814** -0.354 0.350 0.727** 0.979**
(0.000) (0.112) (0.983) (0.095) (0.005) (0.001) (0.259) (0.265) (0.007) (0.000) Table 4. Spearman correlation coefficient between the parameters of non parametric stability and yield
CONCLUSION
Imperial was the most stable genotype based on the stability of 5 non parametric methods, i.e SI(3), RS, NPi(1),
NPi(2), NPi(3) and NPi(4). IPB CH3 was the stable genotype
based on three non-parametric stability parameters, namely SI(1), SI(2) and TOP, however, yield of this genotype was
higher than other genotypes. Yield was had highly significant positive correlation with parameters of TOP, and negatively correlated to the SI(6), NPi(3) and NPi(4) parameters. NPi(1) and
NPi(2), NPi(3), NPi(4), SI(3) and SI(6) parameters were in the
same group (group 1), while the TOP, yield, SI(1), SI(2) and
RS were in group 2. Based on the non parametric stability test, the results could be classified into 2 groups, according to the agronomic and biological concepts of stability.
ACKNOWLEDGMENTS
The authors would like to thank: (1) LPPM IPB who has funded this study through: (a) Strategic research based on umbrella of IPB 2008, (b) Cooperation of LPPM IPB with PT. Heinz ABC Indonesia 2006, (c) Excellent research of IPB (RUI) 2005; (2) Habib, Teddy, Madhumita, Wahyu, Dimas and Sinta who had helped us in conducting the field experiments.
REFERENCES
Akcura, M., Y. Kaya, S. Taner, R. Ayranci. 2006. Parametric stability analyses for grain yield of durum wheat. Plant Soil Environ. 6:254-261.
Badan Pusat Statistik. 2011. Luas panen, produksi dan produktivitas cabai tahun 2010. http://www.bps. go.id. html [11 September 2011].
Balalic, I., M. Zoric, V. Miklic, N. Dusanic, S. Terzic, V. Radic. 2011. Non-parametric stability analysis of sunflower oil yield trials. HELIA 34:67-78.
Farshadfar, E., S.H. Sabaghpour, H. Zali. 2012. Comparison of parametric and non-parametric stability statistics for selecting stable chickpea (Cicer arietinum L.) genotypes under diverse environments. AJCS 6:514-524.
Fox, P.N., B. Skovmand, B.K. Thompson, H.J. Braun, R. Cormier. 1990. Yield and adaptation of hexaploid spring triticale. Euphytica 47:57-64.
Kang, M.S. 1988. A rank-sum method for selecting high-yielding, stable corn genotypes. Cereal Res. Comm. 16:113-115.
Mahtabi, E., E. Farshadfar, and M.M.Jowkar. 2013. Non parametric estimation of phenotypic stability in Chickpea (Cicer arietinum L.). Intl. J. Agri. Crop Sci. 5:888-895.
Mohammadi, R., A. Abdulahi, R. Haghparast, M. Aghaee, M. Rostaee. 2007. Nonparametric methods for evaluating of winter wheat genotypes in multi-environment trials. World J. Agric. Sci. 3:237-242.
Mut, Z., N. Aydin, H.O. Bayramoğlu, H. Özcan. 2009.
Interpreting genotype × environment interaction in bread wheat (Triticum aestivum L.) genotypes using nonparametric measures. Turk J. Agric. For. 33:127-137.
Nassar, R., M. Huehn. 1987. Studies on estimation of phenotypic stability: Tests of significance for non-parametric measures of phenotypic stability. Biometrics 43:45-53.
Rahadi, V.P., M. Syukur, S. Sujiprihati, R. Yunianti. 2013. Nonparametric stability analysis of yield for nine chili pepper (Capsicum annuum L.) genotypes in eight environments. Agrivita 35:193-200.
Sabaghnia, N., H. Dehghani, S.H. Sabaghpour. 2006. Nonparametric methods for interpreting genotype x environment interaction of lentil genotypes. Crop. Sci. 46:1100-1106.
Shah, S.H., S.M. Shah, M.I. Khan, M. Ahmed, I. Hussain, K.M. Eskridge. 2009. Nonparametric methods in combined heteroscedastic experiments for assessing stability of wheat genotypes in Pakistan. Pak. J. Bot. 41:711-730.
Solomon, K.F., H.A. Smit, E. Malan, W.J. Du Toit. 2007. Comparison study using rank based nonparametric stability statistics of durum wheat. World J. Agric. Sci., 3:444-450.
Syukur, M., S. Sujiprihati, R.Yunianti, D.A. Kusumah. 2010. Yield evaluation of pepper hybrids and their adaptation at four locations in two years. J. Agron. Indonesia 38:43-51.
Syukur, M., S. Sujiprihati, R. Yunianti, D.A. Kusumah. 2011. Parametric stability analysis for yield of chili pepper (Capsicum annuum L.). J. Agron. Indonesia 39:31-37.
Syukur, M., S. Sujiprihati, R. Yunianti. 2012. Teknik Pemuliaan Tanaman. Penebar Swadaya, Jakarta.
Thennarasu, K. 1995. On certain non-parametric procedures for studying genotype–environment interactions and yield stability. Ph.D. thesis. P.J. School, IARI, New Delhi, India.
Yaghotipoor, A., E. Farshadfar. 2007. Non-parametric estimation and component analysis of phenotypic stability in chickpea (Cicer arietinum L.). Pak. J. Biol. Sci. 10:2646-2652.