Full Terms & Conditions of access and use can be found at
http://www.tandfonline.com/action/journalInformation?journalCode=tjit20
Journal of Information and Telecommunication
ISSN: 2475-1839 (Print) 2475-1847 (Online) Journal homepage: http://www.tandfonline.com/loi/tjit20
A Hounsfield value-based approach for automatic
recognition of brain haemorrhage
Anh-Cang Phan, Van-Quyen Vo & Thuong-Cang Phan
To cite this article: Anh-Cang Phan, Van-Quyen Vo & Thuong-Cang Phan (2018): A Hounsfield value-based approach for automatic recognition of brain haemorrhage, Journal of Information and Telecommunication, DOI: 10.1080/24751839.2018.1547951
To link to this article: https://doi.org/10.1080/24751839.2018.1547951
© 2018 The Author(s). Published by Informa UK Limited, trading as Taylor & Francis Group
Published online: 28 Nov 2018.
Submit your article to this journal
Article views: 69
A Houns
fi
eld value-based approach for automatic recognition
of brain haemorrhage
Anh-Cang Phan a, Van-Quyen Vo band Thuong-Cang Phan c
a
Faculty of Information Technology, Vinh Long University of Technology Education, Vinh Long, Viet Nam; b
Center of Information Technology, Can Tho University of Medicine and Pharmacy, Can Tho, Viet Nam; c
Faculty of Information Technology, Can Tho University, Can Tho, Viet Nam
ABSTRACT
Brain haemorrhage is a critical problem with the high mortality rate that is typically diagnosed based on MRI/CT images. A lot of research is gaining attention recently for its high performance in image recognition of brain haemorrhage. In this paper, we propose a new approach, which can automatically detect, diagnose and classify of brain haemorrhages. Our proposed method focuses on analysing brain haemorrhage regions from images of brain haemorrhage. We rely on HU values to detect haemorrhage regions and determine the bleeding time of brain haemorrhages. It is useful for supporting doctors in timely treatment. Our experimental results show that the accuracy of detection of brain haemorrhages is 100% and the classification of brain haemorrhages achieves the accuracy of 93.33%.
ARTICLE HISTORY
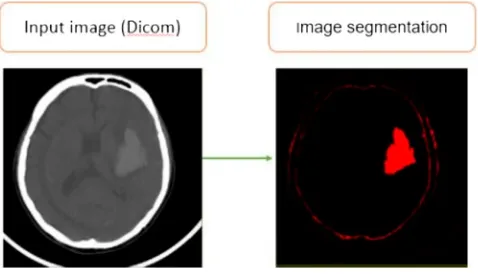
In recent years, there are many researchers in Vietnam and other countries in the world related to the medicalfield, particularly in detecting, diagnosing and classifying disease in humans. During treatment, subclinical results outcome is very important for doctors to detect, diagnose and treat, especially related to the brain haemorrhage. The techniques of computed tomography (CT) (Mayo Clinic,2016), magnetic resonance imaging (MRI), and digital subtraction angiography (DSA) are very helpful in supporting to detect the brain haemorrhage regions. However, there are about some hundred slices (images) for each case of CT/MRI scan depending on the scan region and the thickness of the slices. Hence, the doctors spend a lot of time looking at all images and finding abnormalities in each CT/MRI image to provide the best diagnosis and treatment. To improve this problem, Bhavna Sharma and K. Venugopalan proposed an automatic segmentation of brain CT scan image to identify haemorrhages. Their method was comprised of three stages: pre-processing performed on the brain CT images, the histogram based centroids initialization, and finally the K-means clustering algorithm was applied on the resultant image to segment the image in different clusters based on the intensity values of pixels (shown inFigure 1).
© 2018 The Author(s). Published by Informa UK Limited, trading as Taylor & Francis Group
This is an Open Access article distributed under the terms of the Creative Commons Attribution License (http://creativecommons.org/ licenses/by/4.0/), which permits unrestricted use, distribution, and reproduction in any medium, provided the original work is properly cited.
Another method is introduced by Sumijan, Harlan, and Wibowo (2017) using the Hybrids Otsu method for feature region and mathematical morphology to calculate volume Haemorrhage Brain on CT-scan image and 3D reconstruction. In this research, the authors extracted the bleeding areas of the brain based on a hybrid of the Otsu algor-ithm, morphological features algorithm. The 3D reconstruction of the bleeding area from a 2D slice is implemented by a linear interpolation approach (Figure 2).
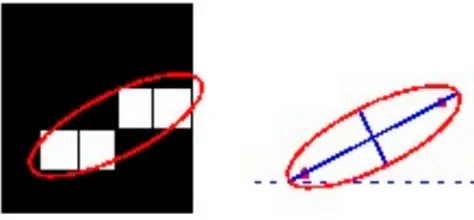
Al-Ayyoub, Alawad, Al-Darabsah, and Aljarrah (2013) proposed another method of the classification of brain haemorrhages. The authors likewise succeeded with automatically detecting and classification of brain haemorrhages. The implemented system consists of several stages including image pre-processing, image segmentation, feature extraction, and classification. However, the authors used the Ostu method (Otsu, 1975) to detect brain haemorrhage regions. Besides, the classification of brain haemorrhages is based on a number of features such as the haemorrhage dimension (in pixels), the focal point, the area and shape of the haemorrhage region (Figure 3).
From the above methods, we can see that their methods are still limited in the refer-ence of the experirefer-enced doctors and medical imaging specialists to determine the dur-ation of bleeding. In additions, their methods are used to the Otsu method, which is a well-known and widely method. However, this method depends on a threshold of the greyscale. To determine this threshold, the authors often convert the CT/MRI images to greyscale images leading to affect image quality and threshold value. Besides, the Figure 1.Thresholds of histogram and segmented image (Sharma & Venugopalan,2012).
image is corrupted by additive noise or the sharp valley of the greyscale histogram is degraded leading to a segmentation error. Moreover, the limitation of the Otsu method is its assumption of binary classes. It partitions the greyscale histogram to two classes. If we consider images having more than two classes of segmentation, the Otsu method will not be appropriate.
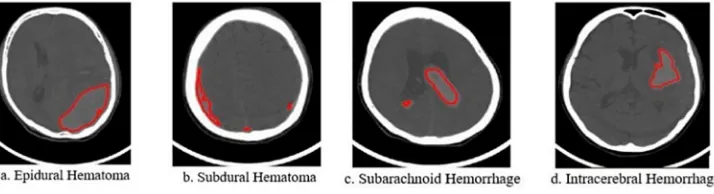
In order to overcome these limitations, we propose a system that can automatically detect, diagnose and classify brain haemorrhages in patients from CT/MRI medical images. Our method implements a haemorrhaging segmentation based on Hounsfield Unit (HU) (Hounsfield,1980) without performing image pre-processing. HU is computed easily and quickly from the values of Rescale Intercept and Rescale Slope available in medical imagefiles of DICOM format (Clunie,2014; Mustra, Delac, & Grgic,2008). This is also a new contribution to our research. Additionally, the using of HU values is well suited for medical professionals in medical imaging. Furthermore, our method can accu-rately determine whether there is the brain haemorrhage. In particular, we determine the duration of the brain haemorrhage, which is critical to doctors’decision-making for a patient’s treatment. This is a new idea of our approach compared to preceding research. There are many types of brain haemorrhage such as epidural, subdural, subarachnoid, cerebral, and intraparenchymal haemorrhage…In this work, due to limitations in dataset collection, we focus on the four types of brain haemorrhages namely epidural haematoma, subdural haematoma, subarachnoid haemorrhage and intracerebral haemorrhage (Johnson, 2006; Ngoc Hoa & Van Phuoc, 2010; Josephson, White, Krishan, & Al-Shahi Salman, 2014) as shown in Figure 4. These considered haemorrhage types have many differences in aspects of visual features such as the size of the haemorrhage region, its Figure 3.The result of segmentation of brain haemorrhages (Al-Ayyoub et al.,2013).
shape, and its location within the skull…We also collect opinions from experienced doctors and specialists in thefield of medical imaging in CanTho Medicine University Hos-pital to help us identify and distinguish the four popular types of brain haemorrhages from our data sets.
2. Proposed methodology
We used the interactive learning machine to create a training dataset with the help of doctors in classifying of the brain haemorrhages from a set of MRI images with DICOM format. We collect a dataset consisting of MRI images of patients involved in one of the four types of brain haemorrhage. These images are classified and labeled as one of the different types of the brain haemorrhage by experts or specialist doctors from the Cantho Medicine University Hospital in CanTho, VietNam. The set of features extracted from these images together with the labels assigned to them are stored in a training database. From experimental results with the testing dataset, our method can identify and classify the area of the brain haemorrhages. It also determines the bleeding timing of brain haemorrhages. The KNN classifier (Altman, 1992) is applied in the pro-posed method. Our method is summarized as follows: we first compute HU values to have image segmentation and determine areas of brain haemorrhages. We then extract and save features in the training dataset. Our method was described inFigure 5including the following stages:
. Stage 1: The determination of the HU value: The most valuable feature of the DICOM image data is ability to store a lot of the necessary information for the computation of the HU values. The HU value is computed by Equation (1).
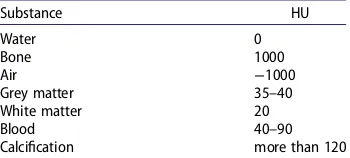
. Stage 2: Image segmentation: after computing the HU values of image points, we detect areas of brain haemorrhages by image segmentation based on HU values, which are in the range from 40 to 90 as shown inTable 1.
. Stage 3: Determination of brain haemorrhage regions: we remove un-related regions and image regions due to some effects of CT technique such as the cortex.
. Stage 4: Feature extraction: we extract the important features from the areas of brain haemorrhages as shown in Section 2.4. These features consist of HU, the smallest, great-est and average of HU, the centre of the brain haemorrhage, and the size of the brain haemorrhage.
. Stage 5: Classification of brain haemorrhages: from the extracted features, we apply the KNN algorithm using the Euclidean distance to identify brain haemorrhages (Figure 10).
. Stage 6: Determination of timing of haemorrhage: the bleeding timing was considered to support doctors making timely treatment for patients. Based on the HU values, we estimate the bleeding timing as presented in Section 2.6.
The following is the related work used in our proposed method.
2.1. Determination of the Hounsfield values (HU)
Our method directly processes the source data on medical images formatted according to the Dicom standard (Mustra et al., 2008) without transforming into JPG, BMP, PNG, etc. Therefore, we do not need to consider pre-processing these images. It aims at saving useful information from the DICOM images. Therefore, our method can save the useful information to determine the HU for the detection of the brain haemorrhage and bleeding timing. This is a new idea and a contribution to our approach. To compute the HU, we apply a linear transformation by the following equation (Fanning, 2006):
HU = Pixel value∗Rescale slope + Rescale intercept, (1)
where Pixel_value is the value of each image point, the Rescale_slope and Rescale_in-tercept are the parameter values provided in DICOM images. We used the dicominfo() function in MATLAB (Ferreira,2009; Smith,2009) to access these values (Figure 6).
2.2. The image segmentation for detecting a brain haemorrhage regions
After computing HU, we make an image segmentation based onTable 1. The result of the image segmentation based on HU to detect a brain haemorrhage region as shown in Figure 7. The Hounsfield values are in the range of 40–90 (Buzug, 2008; Heymsfield, 2005; Prokop,2003) to coincide with the Hounsfield values of brain haemorrhages.
Table 1.The Hounsfield value (HU) of common substances (Wolfgang,2010).
2.3. Brain haemorrhage region extraction
After the image segmentation, some extracted features are close to the cortex since they are mapped by X-rays. Therefore, we removed these features such as the cortex and other features outside the brain haemorrhage area as shown inFigure 8. The Hounsfield values are chosen in the range of 40–50 (Gong et al., 2007) that coincide with HU of haemorrhages.
2.4. Feature extraction
In this Section, we extract the features for identification of brain haemorrhages. These fea-tures include:
. The image points with HU in the range of 40–90 as represented inTable 1. Figure 6.The information for the computation of HU in CT image by DICOM standard.
. The smallest, greatest and average of HU in the haemorrhage region. These values are very important for the determination of the bleeding timing. The determination of the bleeding timing contributes to assisting doctors and medical experts in choosing the proper and timely treatment for patients.
. The centre of the brain haemorrhage: the determination of the centre of the haemor-rhage region helps to detect the brain haemorhaemor-rhage position in the cortex. This makes the classification more accurate.
. The size of the brain haemorrhage (computed by pixel): the size of the brain haemor-rhage region is also important since it helps tofigure out the size and the seriousness of the brain haemorrhage.
We extract some important features from the regions of the brain haemorrhages and using the Regionprops tool in MATLAB as shown inFigure 9.
2.5. Detection and classification of the brain haemorrhages
After extracting and storing the features from medical images, we compared these fea-tures with the feafea-tures in our training database set. We used KNN algorithm (Deza & Deza,2009; Altman,1992) for the classification of brain haemorrhages since it is one of the most widely used classification algorithms. This algorithm is simple and easy to implement. Moreover, it is a supervised learning algorithm and perceived as a simple Figure 8.A brain haemorrhage region is determined applying HU-based segmentation.
but powerful classification, even for complex applications, capable of yielding high-per-formance results (Dzuida, 2010). In this research, the various k-values in KNN classifier are used and compared with each other. Experimental results of accuracy show that the value of K = 3 gives the best classification accuracy (Figure 10).
In literature, there are several other types of distance functions, such as cosine similarity measure, Minkowsky, correlation,…However, there is no a comparative study of examin-ing the distance function effect on the performance of k-NN classifier for the datasets of medical domain. We use the Euclidean distance measurement since it is based on measur-ing the distances between the test data and each of the trainmeasur-ing data to decide thefinal classification output. The distance between two data points is decided by a similarity measure (or distance function) where the Euclidean distance is the most widely used dis-tance function. The Euclidean disdis-tance is computed by Equation (2) (Deza & Deza,2009):
d(p,q)=
(p1−q1)2+(p2−q2)2+ · · · +(pn−qn)2
=
n
i=1
(pi−qi)2
, (2)
wherepandqare the two typical vectors;piandqiare their elements (i= 1,…,n).
The results are represented as inFigure 11.
2.6. Determination of timing of the brain haemorrhages
The determination of the bleeding timing plays a vital role in deciding the proper thera-peutics for the treatment. In this research, we estimate the bleeding timing based on the average Hounsfield value of the brain haemorrhage region. The bleeding timing of the brain haemorrhage is divided into three levels (Brant & Helms,2007; Thust, Burke, & Sid-diqui,2014):
. Hyperacute: the most recognizable hyper attenuating phenomenon (within 3 days) with HU in the range of 50–70 compared to the normal brain’s Hounsfield values (HU in the range of 18–30).
. Acute: the dark level is relatively reduced from day 3 to day 14 with HU less than 40. . Chronic: homogeneity on the region of haemorrhage from the day of 14 to 21 makes
the injured region of brain difficult to distinguish due to Hounsfield is a half of the normal region of the brain (HU from 18 to 30).
The bleeding timing was considered to support doctors making timely treatment like surgery, cerebrovascular intervention, or conservative treatment. It is very significant to determine the stage of cerebral palsy such as acute, subacute or chronic stages as described above. This is a new idea of our approach compared to preceding research.
3. Experimental results
Our proposed method is experimented on a system that automatically detects, diagnoses, and classifies brain haemorrhages. We collected 500 CT scanner images by DICOM stan-dard from the patients’ skull in CanTho Medicine University Hospital. The training and testing data sets are selected at a 7:3 ratio (Al-Ayyoub et al.,2013). It means that the train-ing set of 350 CT images is classified into four types of brain haemorrhages based on the experience of doctors and specialists of CanTho Medicine University Hospital. This data set includes 95 CT images of Epidural Haematoma, 85 CT images of Subdural Haematoma, 80 CT images of Subarachnoid Haemorrhage, and 90 CT images of Intracerebral Haemor-rhage. Thefiles of the training set are 179 Mb. The testing set of 150 images is classified into types of brain haemorrhages and normal brain (no bleeding), which includes 45 normal brain images, 25 images of Epidural Haematoma, 20 images of Subdural Haema-toma, 30 images of Subarachnoid Haemorrhage, and 30 images of Intracerebral Haemorrhage.
Our system was installed on MATLAB version R2015a using a computer with CPU i7, 16 Gb RAM, SSD 256 Gb, HDD 500 Gb, Windows 10 Pro 64 bit. The systematic interface for detecting and classifying brain haemorrhages automatically based on the HU is shown inFigure 12.
3.1. Identification and classification of the brain haemorrhages
In order to evaluate the accuracy of our proposed method, we test on a data set of 150 images using the KNN algorithm with the parameter values of K in the range of 1–10. As a result, our method provides the best classification with K = 3. The results are presented in the confusion matrix inTable 2. From the confusion matrix, we can see that in 25 testing images of the Epidural Haematoma, 24 images are correctly identified (96%) and one image is incorrectly identified as Subdural Haematoma (5%). Similarly, in the case of testing 30 images of Subarachnoid Haemorrhage, 27 images are correctly identified (90.00%), one image of the Subdural Haematoma (3.33%) and two images of Intracranial Haemorrhage (6.67%). From the confusion matrix shown inTable 2, the average accuracy is computed
24 +19 + 27 + 28
105 ∗100%=93.33%. (3)
The accuracy from our method achieves 100% based on HU in identifying the presence of brain haemorrhage regions and 93.33% in classifying four types of brain haemorrhages. It gives more accurate identification results than some other research as in (Al-Ayyoub
et al.,2013) with the accuracy of 92%. Their method performs well only on three of four types of lesions of brain haemorrhages. Additionally, our method also determines the bleeding timing of brain haemorrhages to help doctors making timely treatment like surgery, cerebrovascular intervention, or conservative treatment. It is very significant to determine the stage of cerebral palsy such as acute, subacute or chronic stages as described in Section 2.6. This also helps doctors making decisions faster and easier. More-over, in preceding research, the presence of brain haemorrhage is detected achieving 100% using the Otsu algorithm (Otsu,1975). Our method uses some available information stored in the DICOM images to determine the Hounsfield values which help us identify the brain haemorrhage regions quickly and accurately. They are our contributions to this research.
3.2. Determination of timing of the brain haemorrhages
After identification and classification of the brain haemorrhages, our proposed method determines the bleeding time of brain to support doctors finding timely and effective treatments. We make a comparison between our method and the Fast Bounding Box method (Fazli & Nadirkhanlou, 2013). The results of this method are represented in Figure 14.
The Fast Bounding Box method applied the Deep Learning technology. The results of the segmentation of brain haemorrhages are not accurate compared to our method. In Figure 14, the Fast Bounding Box method determines the haemorrhage regions by the Table 2.Table of the confusion matrix.
4 types of brain
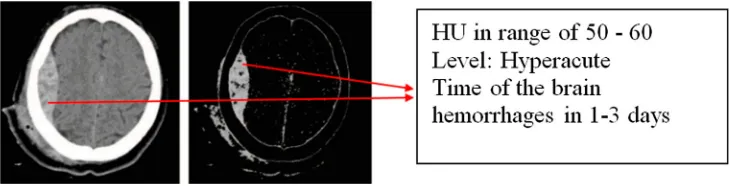
box shapes while our method accurately determines the regions of brain haemorrhages as shown inFigure 13. These regions have HU values of 40–90. Moreover, HU values are also used to determine the duration of haemorrhage in our proposed method.Figure 15shows the time of the brain haemorrhage in 1–3 days because HU values are from 50 to 60.
4. Conclusion
There were various techniques developed for effectively detecting the haemorrhage in the brain. A method of automatically classifying brain haemorrhages is proposed in our research based on the Hounsfield Unit. Our proposed method identifies areas of brain haemorrhage better than some well-known image segmentation methods. It also improves the classification accuracy compared to these methods. In this paper, we present a truly automatic image segmentation method because it does not require a user to determine image-specific parameters such as thresholds or regions of interest. The use of the HU analysis leads to an important improvement in the determination of the regions and the bleeding timing of brain haemorrhages to support doctors making timely treatment. Our system can assist doctors in detecting and classifying the brain haemorrhages through medical images (CT/MRI) with DICOM standard, especially the bleeding timing. The four types of brain haemorrhages namely epidural haematoma, sub-dural haematoma, subarachnoid haemorrhage and intracerebral haemorrhage are con-sidered in this paper.
Disclosure statement
No potential conflict of interest was reported by the authors.
Notes on contributors
Anh-Cang Phanlecturer in Faculty of Information Technology at VinhLong University of Technology Education. B.S. from CanTho University in 1998, and M.S. from the Science University, Vietnam in 2005. Ph.D. in Informatics in 2013 from Aix-Marseille University, France. Research interests include Data science, Big data, Machine Learning, (Medical) Image Processing, Wavelet, 3D modeling, Recog-nition and Classification. Email: [email protected], Phone: +84918204917.
Van-Quyen VoLecturer of Can Tho University of medicine and pharmacy. 179 nguyen van cu street, An khanh ward, Ninh Kieu district, Can Tho city. Email: [email protected], Phone number: +84918710280.
Thuong-Cang Phanlecturer in the Department of network and communication, College of infor-mation and communication technology at CanTho University. B.S. from CanTho University in 1998, and M.S. from the Asian Institute of Technology, Bangkok, Thailand in 2006. Ph.D. in Infor-matics in 2014 from Blaise Pascal University, Clermont-Ferrand, France. A postdoctoral fellow-ship at LARIDEPED, Université du Québec à Trois-Rivières, Canada in 2015. Research interests include Data science, Big data, Big data-based knowledge management systems, Big joins, Large-scale recursive queries, Cloud computing, SOA. Email: [email protected], Phone: +84939003365.
Al-Ayyoub, M., Alawad, D., Al-Darabsah, K., & Aljarrah, I. (2013). Automatic detection and classification of brain hemorrhages.WSEAS Transactions on Computers,12(10), 395–405.
Altman, N. S. (1992). An introduction to kernel and nearest-neighbor nonparametric regression.The American Statistician,46(3), 175–185.
Brant, W. E., & Helms, C. A. (2007).Fundamentals of diagnostic radiology. Philadelphia, PA: Lippincott Williams & Wilkins.
Buzug, T. M. (2008).Computed tomography from photon statistics to modern cone-beam CT. New york, NY: Springer.
Clunie, D. Cordonnier. (2014). Digital Imaging and Communications in Medicine (DICOM). Application/DICOM MIME Sub-type Registration.
Deza, E., & Deza, M. M. (2009).Encyclopedia of distances(pp. 94–104). New York, NY: Springer. Dzuida, D. M. (2010).Data mining for genomics and proteomics: Analysis of gene and protein expression
data. New York, NY: Wiley. ISBN: 9780470593400, page 328.
Fanning, D. W. (2006). Converting CT Data to Hounsfield Units.Guide to IDL Programming. Retrieved fromhttp://www.idlcoyote.com/fileio_tips/hounsfield.html
Fazli, S., & Nadirkhanlou, P. (2013). A novel method for automatic segmentation of brain tumors in MRI images.Journal of CoRR, Computer Vision and Pattern Recognition,1312, 1–6.
Ferreira, A. J. M. (2009).MATLAB codes forfinite element analysis. New York, NY: Springer.
Gong, T., Liu, R., Tan, C. L., Farzad, N., Lee, C. K., Pang, B. C.,…Zhang, Z. (2007). Classification of CT brain images of head trauma. Proceedings of the 2nd IAPR International Conference on Pattern Recognition in Bioinformatics, 401–408. ISBN 978-3-540-75286-8.
Heymsfield, S. (2005).Human body composition(Vol. 82). Oxford: Oxford University Press. Hounsfield, G.N. (1980). Computed medical imaging.Medical Physics,7, 283–290.
Johnson, S. (2006). Stephen Johnson on digital photography, O’Reilly, O’Reilly Media, California, USA. ISBN 9780596523701.
Josephson, C. B., White, P. M., Krishan, A., & Al-Shahi Salman, R. (2014). Computed tomography angio-graphy or magnetic resonance angioangio-graphy for detection of intracranial vascular malformations in patients with intracerebral haemorrhage. The Cochrane Library, 10. doi:10.1002/14651858. CD009372
Mayo Clinic. (2016). CT scan. Retrieved fromhttp://mayoclinic.org
Mustra, M., Delac, K., & Grgic, M. (2008). Overview of the DICOM Standard (PDF). ELMAR, 2008, 50th International Symposium. Zadar, Croatia, 39–44.
Ngoc Hoa, P., & Van Phuoc, L. (2010).CT head injury. Medical Publishing House, branch of Ho Chi Minh city.
Prokop, M. (2003). Spiral and Multislice Computed Tomography of the Body. Thieme publisher, New York, USA. ISBN 9783131164810.
Sharma, B., & Venugopalan, K. (2012). Automatic segmentation of brain CT scan image to identify hemorrhages.International Journal of Computer Applications (0975–8887),40(10), 1–4.
Smith, S. T. (2009).MATLAB advanced GUI development. Michigan: Dog Ear Publishing.
Sumijan, S. M., Harlan, J., & Wibowo, E. P. (2017). Hybrids Otsu method, feature region and mathemat-ical morphology for calculating volume hemorrhage brain on CT-scan image and 3D reconstruc-tion.TELKOMNIKA,15(1), 283–291. ISSN: 1693-6930, accredited A by DIKTI
Thust, S. C., Burke, C., & Siddiqui, A. (2014). Neuroimagingfindings in sickle cell disease.The British Journal of Radiology,87(1040), 1–8.