Site this Article As ………. Paper Accepted : June, 9th 2017
Paper Published : August, 11th 2017 27
PERFORMANCE EVALUATION OF BRAN SUPPLIERS WITH ANP
AND OMAX METHODS
Rahmi Yuniarti 1), Ihwan Hamdala 2), Rangga Damar Bagaskara 3)
Department of Industrial Engineering, Universitas Brawijaya Mayjen Haryono St. 167, Malang 65145, Indonesia
Abstract
PT ASIMAS is an enterprise that cultivates and sells oyster mushrooms. One of the most crucial materials in the production of oyster mushrooms is bran. PT ASIMAS is currently facing several difficulties in performance evaluation of bran suppliers, such as no clear standards in the performance evaluation process of suppliers and late shipment of bran. The objectives of this research are determining the proper criteria and subcriteria and providing improvement recommendation for the enterprise and bran suppliers. This research determined the weights of criteria and subcriteria using Analytic Network Process (ANP). After that, the performance of bran suppliers were assessed through Scoring System with OMAX. This research eventually resulted in 8 criteria and 14 subcriteria. The results of performance evaluation are as follows: Mr. H (4.9699), Mr. Z (4.3622), and Mr. N (4.0869). This research result also provides 14 improvement recommendations: 7 for the enterprise and 7 for suppliers.Keywords: performance evaluation of bran suppliers, ANP, scoring system, OMAX, TLS
1. Introduction
PT Agaricus Sido Makmur Sentosa known as PT ASIMAS, is a business enterprise that cultivates and sells oyster mushrooms. In the cultivation of oyster mushrooms, bran is one of the most crucial raw material because it produces nutrients needed for the growth of mushrooms, furthermore, bran also has a brief lifetime. PT ASIMAS has several bran suppliers, they are Mr. H, Mr. Z, and Mr. N. From those bran suppliers, only one supplier with lowest price yet highest bran quality selected to fulfill the enterprise’s needs of bran.
There are several problems regarding supplier performance evaluation that the enterprise is constantly dealing with, such as no clear standards of performance evaluation process that is based on the proper criteria and subcriteria. Besides, there is also a late shipment of bran that occurs frequently. The data regarding late shipment of bran can be seen in Table 1.
Recently, PT ASIMAS has already maitained a cooperative relationship with bran suppliers, however, they still don’t have a structured performance evaluation methods
* Corresponding author. Email : [email protected] Published online at http://Jemis.ub.ac.id
Copyright ©2017 JTI UB Publishing. All Rights Reserved
which are based on required criteria and subcriteria. Thus, performance evaluation of suppliers is necessary to be implemented because the result of performance evaluation would be used as evaluation materials to improve the performance and also as consideration for the enterprise in maintaining long-term and medium-term cooperations with its suppliers. Analytic Network Process (ANP) and Scoring System with Objective Matrix
(OMAX) method and Traffic Light Systemare
feasible tools to measure the performance achievement of suppliers.
Table 1. Late Shipment of Bran
Bran Supplier Sep’15 Oct’15PeriodNov’15 Dec’15
Mr. H 0 day 0 day 2 days 1 day
Mr. Z 2 days 0 day 0 day 0 day
Mr. N 1 day 1 day 0 day 0 day
Site this Article As ………. Paper Accepted : June, 9th 2017
Paper Published : August, 11th 2017 28
was first introduced in the US and it relates directly to all conditions to measure its work performance [3]. OMAX is used to evaluate the performance of suppliers, so the supplier with
the highest performance achievement can be known. Traffic Light System acts as the sign [5]. Traffic Light System (TLS) is used to find
out if bran supplier has achieved the target set by the enterprise and also to evaluate which performance indicator needs to be improved.
The use of ANP, OMAX and TLS methods are determining the necessary criteria and subcriteria, evaluating bran suppliers’s performance and providing some improvement recommendations for the enterprise and bran suppliers.
2. Research Methods
This research employs descriptive and quantitative approaches. This research report were arranged in four stages: introduction, data collection and processing, analysis and discussion, and conclusion and suggestion.
2.1 Data Collection and Processing Stage
The data was obtained through interviews, questionnaire, and related enterprise documents. The documents consist of primary data and secondary data. Primary data which are the data on suppliers’ performance evaluation criteria and subcriteria, level of necessity of each criteria and subcriteria, and the performance evaluation of suppliers. Secondary data is data regarding company profile, mushroom production process, and suppliers’ performance achievements.
The procedures of data processing in this research were started with developing linkage models through ANP. The criteria and subcriteria is determined as well as the linkage among criteria and subcriteria that will be used in modelling ANP. Secondly, establishing a paired comparison matrix. Then it followed by calculating the elements’ weight which are obtained by normalizing paired comparison matrix and counting up (sum) the elements in one column. After knowing the value of elements’s weight, continued to calculate consistency ratio. The next step is developing supermatrix that consists of three stages such as unweighted supermatrix, weighted supermatrix, and limiting supermatrix. Then, Scoring System with OMAX method was evaluating bran suppliers’s performance by using TLS. TLS were used to find out whether the performance
indicator needs improvement or not.
2.2 Analysis and Discussion Stage
This stage would consist of analysis and discussion of data processing results. The analysis is conducted at the necessity level of supplier performance evaluation criteria and subcriteria and also the improvement recommendations for the enterprise and suppliers.
2.3 Conclusion and Suggestion Stage
The conclusion and suggestion stage consist of the research conclusions obtained from the result of data collection and processing, result analysis and discussion in response to the determined research objectives.
3. Literature Reviews
This chapter is the elaboration of literature review used in this research.
3.1 Analytic Network Process (ANP)
The procedures of decision-making
through ANP are set as follows [6]:
1. Arrange problem structures and develop
linkage models.This procedure states the objectives set to achieve. If there are equivalent elements, they will be grouped into the same component.
2. Develop a paired comparison matrix. The
paired comparison matrix is conducted by using ANP scale which is from 1 to 9. This comparisons determine the priorities of the choosen elements. The paired comparison would be then transformed into a matrix [7].
Site this Article As ……….
f (x)= geometrical mean
xn = value given by respondents
qn = respondent’s weight
3. Calculate elements’ weights. Elements’
weights are obtained by normalizing paired comparison matrix and sum those elements into one column.
𝑍𝑗= ∑𝑛𝑖=1𝑎𝑖𝑗, for j = 1, ..., n
4. Calculate consistency ratio. Consistency ratio is used to examine the consistency of assessment given by expertise.
𝐶𝐼 = 𝜆𝑚𝑎𝑘𝑠−𝑛
𝑛−1
(5) Where:
CI = Consistency Index
𝜆𝑚𝑎𝑘𝑠= The greatest eigen value
n = Amount of elements
𝐶𝑅 = 𝐶𝐼𝑅𝐼
(6) Where:
CR = Consistency Ratio
CI = Consistency Index
RI = Random Index
5. Develop supermatrix. Supermatrix
consists of three stages which are Unweighted Supermatrix, Weighted Supermatrix, and Limiting Supermatrix.
3.2 Objective Matrix (OMAX)
The procedures in arranging Objective Matrix (OMAX) are as follows [8]:
1. Identification of major criteria and
measurement models suitable for the criteria.
2. The level of performance before the
research conducted is set on level 3 and level 10 is the target the enterprise wants to achieve.
3. The performance objectives of each
criteria are determined based on the enterprise’s target.
4. By using linear scale, the levels of
achievements would be determined and filled between level 3 and level 10. ∆𝑋𝐿−𝐻=𝑋𝑌𝐻𝐻−𝑌−𝑋𝐿𝐿 (eq.7)
parameter with the amount of 1.
6. The actual result for each criteria or parameter is calculated and set on the
“performance” row.
7. The level row is filled with association result of “performance” with level from 0 - 10.
8. Each level is multiplied by the criteria weight to obtain the value for “value”. 9. The sum of all “value” is performance
index.
Table 2. Criteria and Subcriteria of Suppliers’
No. Criteria Subcriteria
1. Cost Raw materials offering price
2. Raw materials negotiation price
3. Quality Raw materials quality
4. Delivery Punctuality of raw materials shipment
5. Accuracy of raw materials shipped
6. Responsiveness and Flexibility Flexibility of changes in raw materials shipment
7. Responsiveness and Flexibility Flexibility of changes in raw materials delivery time
8. Speed of needs fulfillment
9. Technical Capability Ability to provide raw materials
10. Prosedural Compliance Accessibility to complain
11. Complaints responsiveness
12. Communication System Intensity of information exchanges
13. Accessibility of communication
Site this Article As ………. Paper Accepted : June, 9th 2017
Paper Published : August, 11th 2017 30
4. Result And Discussion
This chapter elaborates the result and discussion of this research.
4.1 Criteria and Subcriteria Identification
Criteria and subcriteria identification process is performed through interview and questionnaires. The criteria and subcriteria of suppliers’ performance evaluation can be seen in Table 2.
4.2 Computation with Analytic Network
Process (ANP) Method
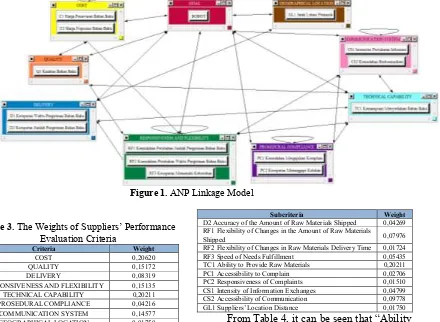
The computation procedures with ANP method is aimed to determine the ANP linkage model by determining the causal relationship between the criteria. The decision of a causal relationship is conducted by distributing questionnaires regarding causal relationship
among subcriteria. The ANP linkage model can be seen in Figure 1.
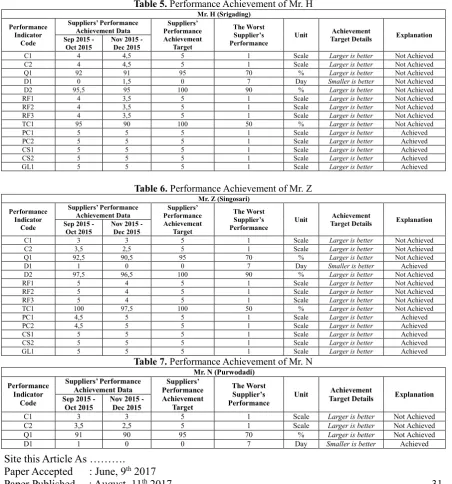
The weight value normalized by the cluster is used to find out local weight of each subcriteria, while limiting value is used to find out the global weight of each subcriteria. From those two weights, global weight from limiting value is the one used to compute suppliers’ performance value. The weighting result from each criteria can be seen in Table 4 while the weighting result of each subcriteria can be seen in Table 5.
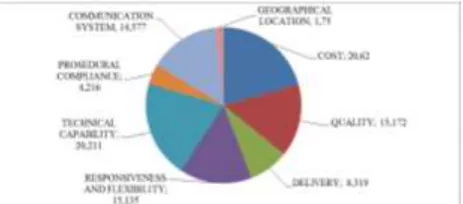
From Table 3, it can be seen that Cost has the greatest weight with 0.20620. It means that cost is the most important criteria. Geographical Location has the smallest weight with 0.01750 which means that it is the least prioritized criteria in the performance evaluation of bran suppliers.
Figure 1. ANP Linkage Model
Table 3. The Weights of Suppliers’ Performance Evaluation Criteria
Criteria Weight
COST 0,20620 QUALITY 0,15172 DELIVERY 0,08319 RESPONSIVENESS AND FLEXIBILITY 0,15135 TECHNICAL CAPABILITY 0,20211 PROSEDURAL COMPLIANCE 0,04216 COMMUNICATION SYSTEM 0,14577 GEOGRAPHICAL LOCATION 0,01750
Table 4. The Weights of Suppliers’ Performance Evaluation Subcriteria
Subcriteria Weight
C1 Raw Materials Offering Price 0,07459 C2 Raw Materials Negotiation Price 0,13161 Q1 Raw Materials Quality 0,15172 D1 Punctuality of raw Materials Shipment 0,04050
Subcriteria Weight
D2 Accuracy of the Amount of Raw Materials Shipped 0,04269 RF1 Flexibility of Changes in the Amount of Raw Materials
Shipped 0,07976
RF2 Flexibility of Changes in Raw Materials Delivery Time 0,01724 RF3 Speed of Needs Fulfillment 0,05435 TC1 Ability to Provide Raw Materials 0,20211 PC1 Accessibility to Complain 0,02706 PC2 Responsiveness of Complaints 0,01510 CS1 Intensity of Information Exchanges 0,04799 CS2 Accessibility of Communication 0,09778 GL1 Suppliers’ Location Distance 0,01750
From Table 4, it can be seen that “Ability to Provide Raw Materials” subcriteria has the greatest weight with 0.20211 which means that it is the most prioritized subcriteria.
Site this Article As ………. Paper Accepted : June, 9th 2017
Paper Published : August, 11th 2017 31
Objective Matrix (OMAX)
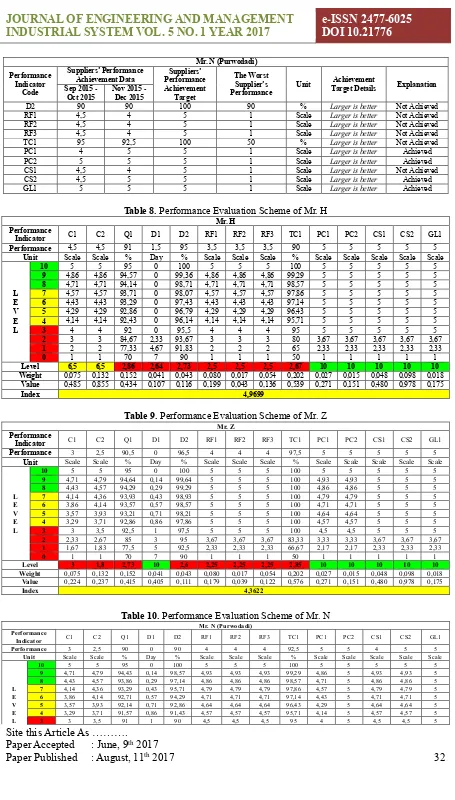
In the computation of OMAX, suppliers’ performance evaluation subcriteria is used as the performance indicators and classified into two types which are quantitative and qualitative indicators. The qualitative indicator is assessed in accordance with supplier performance achievement data obtained from the enterprise, while the qualitative indicator is based on the
questionnaire data regarding supplier
performance evaluation with Likert scale (1-5) as set by the enterprise. Suppliers’ performance achievement data is the result of the average of suppliers’ performance achievement during two periods which are September - October 2015
and November - December 2015. The
performance achievement of Mr. H, Mr. Z, and Mr. N can be seen in Table 5, Table 6, and Table 7.
The computation procedure with OMAX is to calculate the interval value from the highest, medium, and lowest level with scale linear. The computation is performed for all performance indicators before calculating the value of level, weight, value and index which are the sum of all values from each performance indicator which is then inserted into OMAX matrix. The performance evaluation scheme of Mr. H, Mr. Z, and Mr. N can be seen in Table 8, Table 9, and Table 10.
Table 5. Performance Achievement of Mr. H
Mr. H (Srigading) Performance
Indicator Code
Suppliers’ Performance
Achievement Data Performance Suppliers’
Achievement
C1 4 4,5 5 1 Scale Larger is better Not Achieved C2 4 4,5 5 1 Scale Larger is better Not Achieved
Q1 92 91 95 70 % Larger is better Not Achieved
D1 0 1,5 0 7 Day Smaller is better Not Achieved
D2 95,5 95 100 90 % Larger is better Not Achieved
RF1 4 3,5 5 1 Scale Larger is better Not Achieved RF2 4 3,5 5 1 Scale Larger is better Not Achieved RF3 4 3,5 5 1 Scale Larger is better Not Achieved
TC1 95 90 100 50 % Larger is better Not Achieved
PC1 5 5 5 1 Scale Larger is better Achieved PC2 5 5 5 1 Scale Larger is better Achieved CS1 5 5 5 1 Scale Larger is better Achieved CS2 5 5 5 1 Scale Larger is better Achieved GL1 5 5 5 1 Scale Larger is better Achieved
Table 6. Performance Achievement of Mr. Z
Mr. Z (Singosari) Performance
Indicator Code
Suppliers’ Performance
Achievement Data Performance Suppliers’
Achievement
C1 3 3 5 1 Scale Larger is better Not Achieved C2 3,5 2,5 5 1 Scale Larger is better Not Achieved
Q1 92,5 90,5 95 70 % Larger is better Not Achieved
D1 1 0 0 7 Day Smaller is better Achieved
D2 97,5 96,5 100 90 % Larger is better Not Achieved
RF1 5 4 5 1 Scale Larger is better Not Achieved RF2 5 4 5 1 Scale Larger is better Not Achieved RF3 5 4 5 1 Scale Larger is better Not Achieved
TC1 100 97,5 100 50 % Larger is better Not Achieved
PC1 4,5 5 5 1 Scale Larger is better Achieved PC2 4,5 5 5 1 Scale Larger is better Achieved CS1 5 5 5 1 Scale Larger is better Achieved CS2 5 5 5 1 Scale Larger is better Achieved GL1 5 5 5 1 Scale Larger is better Achieved
Table 7. Performance Achievement of Mr. N
Mr. N (Purwodadi) Performance
Indicator Code
Suppliers’ Performance
Achievement Data Performance Suppliers’ Achievement
C1 3 3 5 1 Scale Larger is better Not Achieved
C2 3,5 2,5 5 1 Scale Larger is better Not Achieved
Q1 91 90 95 70 % Larger is better Not Achieved
Site this Article As ………. Paper Accepted : June, 9th 2017
Paper Published : August, 11th 2017 32
Mr. N (Purwodadi) Performance
Indicator Code
Suppliers’ Performance
Achievement Data Performance Suppliers’ Achievement
Target
The Worst Supplier’s
Performance Unit
Achievement
Target Details Explanation Sep 2015
-Oct 2015 Nov 2015 -Dec 2015
D2 90 90 100 90 % Larger is better Not Achieved
RF1 4,5 4 5 1 Scale Larger is better Not Achieved
RF2 4,5 4 5 1 Scale Larger is better Not Achieved
RF3 4,5 4 5 1 Scale Larger is better Not Achieved
TC1 95 92,5 100 50 % Larger is better Not Achieved
PC1 4 5 5 1 Scale Larger is better Achieved
PC2 5 5 5 1 Scale Larger is better Achieved
CS1 4,5 4 5 1 Scale Larger is better Not Achieved
CS2 4,5 5 5 1 Scale Larger is better Achieved
GL1 5 5 5 1 Scale Larger is better Achieved
Table 8. Performance Evaluation Scheme of Mr. H
Mr. H Performance
Indicator C1 C2 Q1 D1 D2 RF1 RF2 RF3 TC1 PC1 PC2 CS1 CS2 GL1
Performance 4,5 4,5 91 1,5 95 3,5 3,5 3,5 90 5 5 5 5 5
Unit Scale Scale % Day % Scale Scale Scale % Scale Scale Scale Scale Scale
10 5 5 95 0 100 5 5 5 100 5 5 5 5 5
9 4,86 4,86 94,57 0 99,36 4,86 4,86 4,86 99,29 5 5 5 5 5
8 4,71 4,71 94,14 0 98,71 4,71 4,71 4,71 98,57 5 5 5 5 5
L 7 4,57 4,57 93,71 0 98,07 4,57 4,57 4,57 97,86 5 5 5 5 5
E 6 4,43 4,43 93,29 0 97,43 4,43 4,43 4,43 97,14 5 5 5 5 5
V 5 4,29 4,29 92,86 0 96,79 4,29 4,29 4,29 96,43 5 5 5 5 5
E 4 4,14 4,14 92,43 0 96,14 4,14 4,14 4,14 95,71 5 5 5 5 5
L 3 4 4 92 0 95,5 4 4 4 95 5 5 5 5 5
2 3 3 84,67 2,33 93,67 3 3 3 80 3,67 3,67 3,67 3,67 3,67
1 2 2 77,33 4,67 91,83 2 2 2 65 2,33 2,33 2,33 2,33 2,33
0 1 1 70 7 90 1 1 1 50 1 1 1 1 1
Level 6,5 6,5 2,86 2,64 2,73 2,5 2,5 2,5 2,67 10 10 10 10 10
Weight 0,075 0,132 0,152 0,041 0,043 0,080 0,017 0,054 0,202 0,027 0,015 0,048 0,098 0,018
Value 0,485 0,855 0,434 0,107 0,116 0,199 0,043 0,136 0,539 0,271 0,151 0,480 0,978 0,175
Index 4,9699
Table 9. Performance Evaluation Scheme of Mr. Z
Mr. Z
Performance
Indicator C1 C2 Q1 D1 D2 RF1 RF2 RF3 TC1 PC1 PC2 CS1 CS2 GL1
Performance 3 2,5 90,5 0 96,5 4 4 4 97,5 5 5 5 5 5
Unit Scale Scale % Day % Scale Scale Scale % Scale Scale Scale Scale Scale
10 5 5 95 0 100 5 5 5 100 5 5 5 5 5
9 4,71 4,79 94,64 0,14 99,64 5 5 5 100 4,93 4,93 5 5 5
8 4,43 4,57 94,29 0,29 99,29 5 5 5 100 4,86 4,86 5 5 5
L 7 4,14 4,36 93,93 0,43 98,93 5 5 5 100 4,79 4,79 5 5 5
E 6 3,86 4,14 93,57 0,57 98,57 5 5 5 100 4,71 4,71 5 5 5
V 5 3,57 3,93 93,21 0,71 98,21 5 5 5 100 4,64 4,64 5 5 5
E 4 3,29 3,71 92,86 0,86 97,86 5 5 5 100 4,57 4,57 5 5 5
L 3 3 3,5 92,5 1 97,5 5 5 5 100 4,5 4,5 5 5 5
2 2,33 2,67 85 3 95 3,67 3,67 3,67 83,33 3,33 3,33 3,67 3,67 3,67
1 1,67 1,83 77,5 5 92,5 2,33 2,33 2,33 66,67 2,17 2,17 2,33 2,33 2,33
0 1 1 70 7 90 1 1 1 50 1 1 1 1 1
Level 3 1,8 2,73 10 2,6 2,25 2,25 2,25 2,85 10 10 10 10 10
Weight 0,075 0,132 0,152 0,041 0,043 0,080 0,017 0,054 0,202 0,027 0,015 0,048 0,098 0,018
Value 0,224 0,237 0,415 0,405 0,111 0,179 0,039 0,122 0,576 0,271 0,151 0,480 0,978 0,175
Index 4,3622
Table 10. Performance Evaluation Scheme of Mr. N
Mr. N (Purwodadi) Performance
Indicator C1 C2 Q1 D1 D2 RF1 RF2 RF3 TC1 PC1 PC2 CS1 CS2 GL1
Performance 3 2,5 90 0 90 4 4 4 92,5 5 5 4 5 5
Unit Scale Scale % Day % Scale Scale Scale % Scale Scale Scale Scale Scale
10 5 5 95 0 100 5 5 5 100 5 5 5 5 5
9 4,71 4,79 94,43 0,14 98,57 4,93 4,93 4,93 99,29 4,86 5 4,93 4,93 5
8 4,43 4,57 93,86 0,29 97,14 4,86 4,86 4,86 98,57 4,71 5 4,86 4,86 5
L 7 4,14 4,36 93,29 0,43 95,71 4,79 4,79 4,79 97,86 4,57 5 4,79 4,79 5
E 6 3,86 4,14 92,71 0,57 94,29 4,71 4,71 4,71 97,14 4,43 5 4,71 4,71 5
V 5 3,57 3,93 92,14 0,71 92,86 4,64 4,64 4,64 96,43 4,29 5 4,64 4,64 5
E 4 3,29 3,71 91,57 0,86 91,43 4,57 4,57 4,57 95,71 4,14 5 4,57 4,57 5
Site this Article As ………. Paper Accepted : June, 9th 2017
Paper Published : August, 11th 2017 33
Mr. N (Purwodadi) Performance
Indicator C1 C2 Q1 D1 D2 RF1 RF2 RF3 TC1 PC1 PC2 CS1 CS2 GL1
Performance 3 2,5 90 0 90 4 4 4 92,5 5 5 4 5 5
Unit Scale Scale % Day % Scale Scale Scale % Scale Scale Scale Scale Scale
2 2,33 2,67 84 3 90 3,33 3,33 3,33 80 3 3,67 3,33 3,33 3,67
1 1,67 1,83 77 5 90 2,17 2,17 2,17 65 2 2,33 2,17 2,17 2,33
0 1 1 70 7 90 1 1 1 50 1 1 1 1 1
Level 3 1,8 2,86 10 3 2,57 2,57 2,57 2,83 10 10 2,57 10 10
Weight 0,075 0,132 0,152 0,04 0,044 0,080 0,017 0,054 0,202 0,027 0,015 0,048 0,098 0,018
Value 0,224 0,237 0,433 0,41 0,128 0,205 0,044 0,140 0,573 0,271 0,151 0,123 0,978 0,175
Index 4,0869
4.4 Suppliers’ Performance Evaluation
with Traffic Light System
Traffic Light System would mark whether a performance indicator needs improvement or not. Performance indicator of Mr. H, Mr. Z, and Mr. N based on Traffic Light System can be seen in Table 11, Table 12, and Table 13.
Table 11. Performance Indicator of Mr. H Based on TLS
Code Performance Indicator
PC1 Accessibility to Complain
PC2 Responsiveness to Complaints
CS1 Intensity of Information Exchanges
CS2 Accessibility of Communication
GL1 Suppliers’ Location Distance
C1 Raw Materials Offering Price
C2 Raw Materials Negotiation Price
Q1 Raw Materials Quality
D1 Punctuality of Raw Materials Shipment
D2 Accuracy of Raw Materials Amount Shipped
RF1 Flexibility in Changes of Raw Materials Amount Shipped
RF2 Flexibility in Changes of Raw Materials Shipment Time
RF3 Speed of Needs Fulfillment
TC1 Ability to Provide Raw Materials
Table 12. Performance Indicator of Mr. Z Based on TLS
Code Performance Indicator
D1 Punctuality of Raw Materials Shipment
PC1 Accessibility to Complain
PC2 Responsiveness to Complaints
CS1 Intensity of Information Exchanges
CS2 Accessibility of Communication
GL1 Suppliers’ Location Distance
C1 Raw Materials Offering Price
C2 Raw Materials Negotiation Price
Q1 Raw Materials Quality
D2 Accuracy of Raw Materials Amount Shipped
RF1 Flexibility in Changes of Raw Materials Amount Shipped
RF2 Flexibility in Changes of Raw Materials Shipment Time
RF3 Speed of Needs Fulfillment
TC1 Ability to Provide Raw Materials
Table 13. Performance Indicator of Mr. N Based on TLS
Code Performance Indicator
D1 Punctuality of Raw Materials Shipment
PC1 Accessibility to Complain
PC2 Responsiveness to Complaints
CS2 Accessibility of Communication
GL1 Suppliers’ Location Distance
C1 Raw Materials Offering Price
C2 Raw Materials Negotiation Price
Q1 Raw Materials Quality
Code Performance Indicator
D2 Accuracy of Raw Materials Amount Shipped
RF1 Flexibility in Changes of Raw Materials Amount Shipped
RF2 Flexibility in Changes of Raw Materials Shipment Time
RF3 Speed of Needs Fulfillment
TC1 Ability to Provide Raw Materials
CS1 Intensity of Information Exchanges
Table 11 above shows five green, two yellow, and seven red performance indicators for supplier Mr. H. Table 12 above shows six green and eight red performance indicators for supplier Mr. Z. Table 13 above shows five green and nine red performance indicators for supplier Mr. N.
4.5 Analysis of Criteria Weights
Figure 2 shows that Cost and Technical Capability have relatively equal weights, which are 0.2062 and 0.20211. Those two criteria are considered crucial because the enterprise always wants to minimize the purchasing price of bran and consider the capability of suppliers in providing bran itself.
Figure 2. Criteria Weights Comparison of Suppliers’ Performance Evaluation
4.6 Analysis of Subcriteria Weights
Site this Article As ………. Paper Accepted : June, 9th 2017
Paper Published : August, 11th 2017 34
of Raw Materials Shipment Time” from criteria of Responsiveness and Flexibility doesn’t affect other subcriteria. However, in the criteria weight assessment, criteria of Responsiveness and Flexibility is one of the most crucial criteria in evaluating the performance of suppliers.
Table 14. The Order of Suppliers’ Performance Evaluation Subcriteria
No. Subcriteria Subcriteria Weights
1. Ability to Provide Raw Materials 0,20211 2. Raw Materials Quality 0,15172 3. Raw Materials Negotiation Price 0,13161 4. Accessibility of Communication 0,09778 5. Flexibility in Changes of Raw Materials Amount Shipped 0,07976 6. Raw Materials Offering Price 0,07459 7. Speed of Needs Fulfillment 0,05435 8. Intensity of Information Exchanges 0,04799 9. Accuracy of Raw Materials Amount Shipped 0,04269 10. Punctuality of Raw Materials Shipment 0,04050 11. Accessibility to Complain 0,02706 12. Suppliers’ Location Distance 0,01750 13. Flexibility in Changes of Raw Materials Shipment Time 0,01724 14. Responsiveness to Complaints 0,01510
4.7 Improvement Recommendation
The red and yellow performance indicators in TLS need to be analyzed with Fishbone diagram in order to find out the causes of the unachieved performance target by referring to the ANP linkage model, so the performance indicator could affect the other indicators. This improvement recommendation
is expected to be the evaluation materials for the bran suppliers in order to improve their performance, and for the enterprise as the consideration material in maintaining medium and long-term cooperation with the suppliers. The result of performance achievement of each supplier can be seen in Figure 3.
Figure 3 shows that the performance of bran suppliers, who are Mr. H, Mr. Z, and Mr. N are yellow-colored which means that the performances of those suppliers are relatively good but they haven’t met the predetermined target. Suppliers should improve their performance and prepare themselves for any possibility that could hinder their performance.
Figure 3. The Performance Achievement Result of Each Bran Supplier
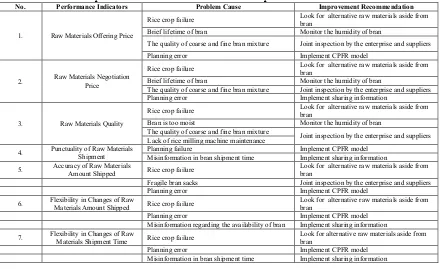
Table 15. Improvement Recommendation for the Enterprise for Performance Indicators
No. Performance Indicators Problem Cause Improvement Recommendation
1. Raw Materials Offering Price
Rice crop failure Look for alternative raw materials aside from bran Brief lifetime of bran Monitor the humidity of bran
The quality of coarse and fine bran mixture Joint inspection by the enterprise and suppliers Planning error Implement CPFR model
2. Raw Materials Negotiation Price
Rice crop failure Look for alternative raw materials aside from bran Brief lifetime of bran Monitor the humidity of bran
The quality of coarse and fine bran mixture Joint inspection by the enterprise and suppliers Planning error Implement sharing information
3. Raw Materials Quality
Rice crop failure Look for alternative raw materials aside from bran Bran is too moist Monitor the humidity of bran
The quality of coarse and fine bran mixture Joint inspection by the enterprise and suppliers Lack of rice milling machine maintenance
4. Punctuality of Raw Materials Shipment Planning failureMisinformation in bran shipment time Implement CPFR modelImplement sharing information
5. Accuracy of Raw Materials Amount Shipped Rice crop failure Look for alternative raw materials aside from bran Fragile bran sacks Joint inspection by the enterprise and suppliers Planning error Implement CPFR model
6. Flexibility in Changes of Raw Materials Amount Shipped Rice crop failure Look for alternative raw materials aside from bran Planning error Implement CPFR model
Misinformation regarding the availability of bran Implement sharing information
7. Flexibility in Changes of Raw Materials Shipment Time Rice crop failure Look for alternative raw materials aside from bran Planning error Implement CPFR model
Misinformation in bran shipment time Implement sharing information
Site this Article As ………. Paper Accepted : June, 9th 2017
Paper Published : August, 11th 2017 35
No. Performance Indicators Problem Cause Improvement Recommendation
8. Speed of Needs Fulfillment Rice crop failure Look for alternative raw materials aside from bran Planning error Implement CPFR model
Misinformation in bran shipment time Implement sharing information
9. Ability to Provide Raw Materials Rice crop failure Look for alternative raw materials aside from bran bekatul The quality of coarse and fine bran mixture Joint inspection by the enterprise and suppliers Planning error Implement CPFR model
Misinformation in bran shipment time Implement sharing information
10. Intensity of Information Exchanges Rice crop failure Look for alternative raw materials aside from bran Planning error Implement CPFR model
Misinformation regarding the availability of bran Implement sharing information
4.7.1 Improvement Recommendations for
the Enterprise
Improvement recommendation for the enterprise is based on performance indicators in the TLS evaluation. It can be seen in Table 15.
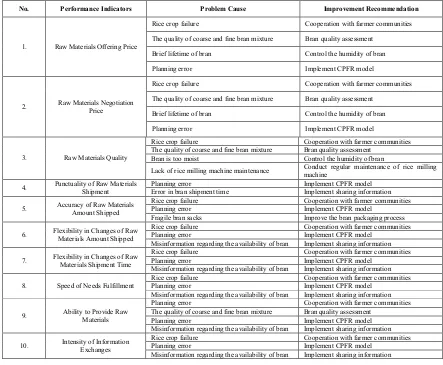
4.7.2 Improvement Recommendation for
Bran Suppliers
Improvement recommendations for bran suppliers are based on performance indicators in the evaluation by using TLS. It can be seen in Table 16.
Table 16. Improvement Recommendation for Bran Suppliers for Performance Indicators
No. Performance Indicators Problem Cause Improvement Recommendation
1. Raw Materials Offering Price
Rice crop failure Cooperation with farmer communities The quality of coarse and fine bran mixture Bran quality assessment
Brief lifetime of bran Control the humidity of bran Planning error Implement CPFR model
2. Raw Materials Negotiation Price
Rice crop failure Cooperation with farmer communities The quality of coarse and fine bran mixture Bran quality assessment
Brief lifetime of bran Control the humidity of bran Planning error Implement CPFR model
3. Raw Materials Quality
Rice crop failure Cooperation with farmer communities The quality of coarse and fine bran mixture Bran quality assessment
Bran is too moist Control the humidity of bran
Lack of rice milling machine maintenance Conduct regular maintenance of rice milling machine
4. Punctuality of Raw Materials Shipment Planning errorError in bran shipment time Implement CPFR modelImplement sharing information
5. Accuracy of Raw Materials Amount Shipped Rice crop failurePlanning error Cooperation with farmer communitiesImplement CPFR model Fragile bran sacks Improve the bran packaging process
6. Flexibility in Changes of Raw Materials Amount Shipped Rice crop failurePlanning error Cooperation with farmer communitiesImplement CPFR model Misinformation regarding the availability of bran Implement sharing information
7. Flexibility in Changes of Raw Materials Shipment Time Rice crop failurePlanning error Cooperation with farmer communitiesImplement CPFR model Misinformation regarding the availability of bran Implement sharing information
8. Speed of Needs Fulfillment Rice crop failurePlanning error Cooperation with farmer communitiesImplement CPFR model Misinformation regarding the availability of bran Implement sharing information
9. Ability to Provide Raw Materials
Planning error Cooperation with farmer communities The quality of coarse and fine bran mixture Bran quality assessment
Planning error Implement CPFR model Misinformation regarding the availability of bran Implement sharing information
10. Intensity of Information Exchanges Rice crop failurePlanning error Cooperation with farmer communitiesImplement CPFR model Misinformation regarding the availability of bran Implement sharing information
5. Conclusion
Based on the research conducted, the conclusions are as follows:
Site this Article As ………. Paper Accepted : June, 9th 2017
Paper Published : August, 11th 2017 36
(0,0175). The weight result of each subcriteria with the highest result is Ability to Provide Raw Materials (0,20211) while the lowest result is Responsiveness to Complaints (0,01510).
2. The result of suppliers’ performance
evaluation by using Scoring System dengan Objective Matrix (OMAX) and Traffic Light System is: Mr. H (4,9699), Mr. Z (4,3622), and Mr. N (4,0869).
3. Improvement recommendations for the
enterprise are as follows: search for alternative raw materials aside from bran as the mushroom cultivation medium, control the bran humidity, conduct joint inspection with suppliers, apply CPFR
(collaborative planning, forecasting, and
replenishment) model, apply sharing
information, maintain cooperation
contract with bran suppliers in accordance with the performance achievement, and apply Risk-Hedging Supply Chain strategy. While the improvement recommendations for bran suppliers are as follows: build cooperation with farmer communities, assess the bran quality, control the bran humidity, regularly maintain the
machine, implement CPFR
(collaborative planning, forecasting, and
replenishment) model, implement sharing
information, and improve the bran packaging process.
REFERENCES
[1] Ozden B. Use of Analytic Network
Process in Vendor Selection Decisions, Benchmarking: An International Journal. 2006; 13(5): 566-579.
[2] James LR. Production System: Planning,
Analysis, and Control. Illinois: Waveland
Press Inc; 2007.
[3] MPN Pharne, GN Kande. Application of
Benchmarking Method in the
Construction Project to Improve Productivity, International Journal of Technical Research and Applications. 2016;4(3): 394-398.
[4] Bernard M. Key Performance Indicators
for Dummies. West Sussex: John Wiley & Sons; 2015.
[5] Ahmad M. Development of Sustainable
Performance Measurement for Electronic and Plastic Industrial Cluster Based Industrial Symbiosis Scenario in the Industrial Estate. Proceeding of the 2016 International Conference on Industrial Engineering and Operations Management Kuala Lumpur, Malaysia : IEOM Society International. 2016; 1122-1128
[6] Thomas LS, Luis GV. Decision Making
with the Analytic Network Process, 2nd
Ed. Pittsburgh: Springer; 2016.
[7] Keith C, Joseph S. An Application of the
Analytic Network Process to the Advertising Media Budget Allocation Decision. The International Journal on Media Management. 2008;8(4): 164-172.
[8] William CF, Carl GT. Handbook for
Productivity Measurement and
Improvement. 2nd edition. Portland: Productivity Press; 2003.
[9] Salvatore G, Matthias E, Jose RF.