1
Food Security and Climate Change in Developing Economies:
Evidences and Policy Responses
Mad Nasir Shamsudin
11
Faculty of Agriculture, Universiti Putra Malaysia
1. Introduction
The challenge of food security is to assure that all people have access to enough food to lead productive lives. Food production, however, is vulnerable to climate change. The general consensus is that changes in temperature and precipitation will directly result in changes in land and water regimes that will subsequently affect agricultural productivity. It also indirectly impacts on human development, economic growth, and trade flows. The impact of climate change on food security is therefore a vital challenge and a particularly critical one for vulnerable regions such as tropical developing countries. This paper elucidates some evidences of the impacts of climate change on food production, and hence food security and policy responses to minimise its impacts.
2. Food Security Issues in Developing Economies
The food security agenda in the twenty-first century faces a totally new set of challenges. Domestically, the competition for resources (land, labour and capital) continues to intensify as urbanisation and industrialisation grow rapidly. Lack of innovations and technology in food production merely depletes food
sector‘s ability to compete. Limited investment in food and agriculture have made this sector lagged on all fronts; productivity, efficiency and development. The effect of climate change is showing, aggravated further by unsustainable practices such as overuse of chemical fertilisers, and poor water management. The international market also poses the bigger challenge to developing countries‘ food security in particular
―extreme volatility‖. The trajectory of the global food system is no longer in the main determined by the
resolution of demand and supply fundamentals. External shocks are emerging from a complexity of sources and are having a profound influence in causing vulnerability in food systems. The detrimental impact of volatility is further magnified by structural problems such as: poor infrastructure, poor supply response, inefficient market, and susceptibility to climactic disturbances.
The conventional fundamental framework is still applicable as demand is chasing over stressed supply due to serious resource constraints. The awakening of the populous Indian and Chinese economies has put pressures on food supply of the world. The volatility of the crude oil prices, for instance, as well as its increasing trend has increased the demand for biofuel feedstock which leads to lesser resources for food production and competition for land. Lurking actively is the climatic changes which are affecting the four dimensions of food security include: food availability, stability of food supplies, access to food, and food utilisation.
3. Evidences of Climate Change Impacts
Climate change poses challenges for all sectors of the economy, but particularly those sectors dependent on natural resources such as agriculture. Despite technological advances in biotechnology, climate is still a key factor in determining agricultural productivity and hence food security and agricultural economy. The impacts of climate change on food security may be felt primarily through changes in crop yields, water availability, pests and diseases, animal health and other biophysical factors. Such biophysical changes propagate through a number of components of the socio-economic system and ultimately, impact the livelihoods of people in a variety of ways.
2 will increase poverty and reduce the ability of households to invest for a better future. At the national level, climate change will cut revenues and raise spending needs, worsening public finance.
There is a general agreement that the long-term effects on agriculture are negative. If climate change effects are not abated, agricultural production in the mid- and high-latitudes is likely to decline in the long term (approximately by the end of 21st century). They are due primarily to detrimental effects of heat and water stress on crop growth as temperatures rise.
4. Policy Responses
3
Economic Impact of Climate Change on Rice Production
Negin Vaghefi
11
Faculty of Agriculture Mazandaran University Iran
1.
Introduction
There are serious concerns about the impact of climate change and its variability on agricultural production throughout the world. First, food security issues are considered significant in the list of human
activities, and ecosystem services are under threat of dangerous anthropogenic interference on earth‘s
climate. Second, each country is naturally concerned with potential damages and benefits that may arise over the coming decades from climate change impact on its area as well as globally, since these will affect domestic and international policies, trading patterns, resource use, regional planning and eventually the
people‘s welfare. Since global demand for food increasing steadily, particularly in Asian markets, any
permanent reductions in output of key agricultural commodities resulting from climate change is likely to drive average food prices higher as consumers compete for limited supplies. Thus, attention to climate change issue is urgent, as it poses a significant threat to food supplies and security.
2.
Effect of Climate Change on Potential Production of Rice
After wheat, rice is the most important crop in the world, and the dominant staple food crop in Asia with more than 90% of the rice produced and consumed. However, due to rapidly expanding population, increasing in rice production is required. The impact of climate change on rice production may add to an already complex problem. The major climatic variables that effect the rice production are temperature, rainfall, solar radiation, and atmospheric CO2. Hence, any changes in these variables may have a significant
impact on rice productivity. Since rice is a highly water demanded plant, unpredicted climatic changes like extreme weather are expected to influence its water use required.
Previous studies have shown that increased air temperature adversely affect rice yield and its grain quality. High temperature increases the transpiration rate, reduces the photosynthesis, and shortens the growth duration of rice plant. However, more solar radiation has beneficial effect on rice grain yield. It controls photosynthesis and biological process of plant. Furthermore, increased atmospheric Carbon Dioxide (CO2) concentration increases growth and development of rice plant and consequently rice yield. However,
the rice yield is more strongly influenced by temperature than by CO2. The elevated CO2 may positively
increase the number of panicles; however filled grain per panicle may sharply decline with increasing temperature. Among these factors, temperature therefore has a major influence on rice growth and yield.
3.
Economic Impact of Climate Change
There is a general agreement that potential changes in climate may reduce productivity and output in agricultural industries. Since climate continuously changes and affects the agriculture in various ways, good measurement of its impacts on sustainable agriculture is required.
Since global demand for food is steadily increasing, especially in Asian markets, any long term reductions in production of key agricultural commodities, arising from climate change, is probable to drive average food prices higher as consumers compete for limited supplies. In fact, crops that decline in supply will rise in price. Higher prices reduce consumption level and adversely affect on consumer welfare. It may increase the fears over food security and more hunger people due to rising population.
4
Innovation to address the Potential Impacts of Climate Change on
Agriculture in Indonesia: Research Needs
+Perdinan
1,2and Rizaldi Boer
1,21
CCROM-SEAP, Bogor Agricultural University, Bogor, Indonesia
2
Perhimpunan Agrometeorology Indonesia (PERHIMPI)
email: [email protected], [email protected]
1. Introduction
Agricultural industry has been identified as one of vulnerable sectors to the impacts of climate change. The impacts raise awareness many countries around the world specifically to address the potential adverse impacts of climate change that may threaten food security (Schmidhuber and Tubiello 2007). A global study conducted by Cline (2007) estimated that the economic loss due to global warming (worse scenarios) on agriculture sector in 2080 would be equivalent to about 6.33 billion USD (without CO2 fertilization) and
1.967 billion USD (with CO2 fertilization). Interestingly, the potential impacts are distributed unevenly
across the globe with potential adverse impacts felt by developing countries located near the equator. Inline
with the Cline‘s report, study on the impacts of climate change on ASEAN countries reported that in a few
last decades, ASEAN countries have been exposed to increasing trends of extreme climate hazards which has been considered due to global warming and climate change (ADB 2009).
Indonesia as one of ASEAN countries located near equator is considered vulnerable to climate change. This is expected as agricultural production is highly influenced by climate variability. In the context of climate variability, climate extreme events in Indonesia are frequently associated with the ENSO (El Nino and Southern Oscillation) events. For example, the El Nino events are often associated with drought condition that eventually may decrease crop production in many parts of Indonesian regions such as Jawa Barat, Lampung dan Sumatra Selatan dan Sulawesi Selatan (Boer et al. 2009). As the frequency of ENSO events are expected to increase in the future due to global warming (Timmermann et al. 1999), it is anticipated that the frequency of climate extreme events may also increase in the future. In short, global climate change may decrease crop production in Indonesia due to increasing frequency of climate extremes. This climate exposure may exacerbate the decrease in crop production due to exposure from agricultural land conversion. A study conducted by Boer et al. (2009) suggested that paddy production in Java was estimated to decrease by 5 million tonnage in 2025 and 10 million tonnage in 2050 due to agricultural land conversion (with an assumption of 30 thousand hectare per year) and global climate change. Other works that evaluated the impacts of climate change in Indonesia can be seen in the country report published by Ministry of Environment that summarize current states of the climate change impacts and vulnerability in Indonesia (MoE 2007).
The vulnerability of agricultural Industry in Indonesia may happen because of many drawbacks in various aspects, namely: Research, Policies and Integrated Programs on Climate Change Adaptation & Climate Change Mitigation, Infrastructure & Spatial Plan, Poverty, Institutions, Climate Information Services, and Technologies (Boer et al. 2011). As a consequence, adaptation programs to alleviate the potential negative impacts of climate change should be planned and implemented. Early Action is important as late action to address the potential adverse impacts of climate change will lead to more severe impact and the adaptation will be very costly and may be impossible to be handled (ADB 2009). Understanding, the implementation of climate change adaptation will incur costs so that plausible adaptation should be selected. Perdinan and Winkler (2013) proposed a guidance to conduct adaptation assessment. The assessment integrates the ―top-down‖ and the ―bottom-up‖ approach that combines the application of modeling
approaches and local knowledge (i.e., stakeholders‘ experience).
+
5 This paper attempts to identify potential innovations to address the impacts of climate change on agriculture that also can be potential adaptation options. The innovations are proposed based on our understanding on current states of knowledge on the climate change impacts, vulnerability and adaptation. We specifically emphasize research needs so that an innovation can be discovered and implemented in Indonesia. Generally, the subjects of innovation for climate change adaptation are in the field of climate information, information technology, and agricultural technology (Figure 1).
Fig. 1: Subjects of innovation needed for climate change adaptation
2. Proposed Innovations: Research Needs
Climate change adaptation is designed to minimize the adverse impacts of climate change and to maximize its benefits. By this definition, we identify innovations that are required to support the implementation of climate change adaptation or can be chosen as an adaptation option. The innovations are derived based on current knowledge on critical issues of climate change assessments, the needs for the development and application of climate models, the advancement in the application of information technology, and the employment of agro-meteorology models for agricultural technology application. Details for each innovation are described.
2.1. Climate Information
Research needs for climate information is proposed concerning the availability and accessibility of climate data/information. The concern on data availability rises because climate stations are often limited or a specific climate variable (e.g., solar radiation) may not be available. Currently, there are some alternatives that can be employed to estimate values of a climate variable such as daily radiation. The methods are
categorized into two broad terms: ‗traditional approaches‘ and ‗modern approaches‘ (Perdinan, Winkler, and Andresen 2013). The traditional approaches that are frequently applied to estimate values for a point or location include empirical equation, mechanistic models, and stochastic generation. The modern approaches are those that are employed gridded datasets such as satellite observations, regional climate models (RCMs) and reanalysis data. In developed, world such as the United States, the gridded datasets are readily available. For example, NASA POWER Database (satellite) (NASA 2011), North American Regional Climate Change Adaptation Project (RCMs) (Mearns et al. 2012), and North American Regional Reanalysis (reanalysis) (Mesinger et al. 2006). The main benefit of grid datasets is ‗continuous‘ surface that means values are available for all grids covering a region. Considering this understanding, research needs for climate information associated with data availability in Indonesia should be addressed to answer below questions:
How to develop the estimated values for a climate variable for a particular region in Indonesia?
6 Fig. 2: Example format of grids of NASA-POWER, RCMs (NARCCAP) and Reanalysis (NARR). Image source: NASA POWER: http://earth-www.larc.nasa.gov/, NARCCAP: http://www.narccap.ucar.edu/ and
NARR: http://www.ncl.ucar.edu/
The next issue associated with climate information is the accessibility of climate data/observations that are ready to use. It is recommended to conduct quality check following homogenization procedure to control data quality. Adjustments should be made to correct for data errors. In addition, climate impact, vulnerability and adaptation assessments are also need climate projections. Such projections are usually constructed from outputs of global climate models or regional climate models. Downscaling techniques may also be applied to project future climates. We propose the utilization of web-based system to ease the access of climate data/information. The supply of climate information should also be tailored with user needs. An example of this web-based information of climate projections is pileus project (Winkler et al. 2012). A website,
www.pileus.msu.edu, is designed to allow users to obtain climate projections for a specific location. User inputs have also been considered when selecting climate variables that are published in the website.
2.2. Climate Forecast Application
The advancement in computer power contributes significantly to weather forecast. As computer power increases, forecast skill increases (Shuman, F. G.(1989) and Kalnay, et al. (1998)). This better skill is because higher computer power is required to solve the complex equations that are formulated for the weather forecast. Global teleconnection can now also be studied as computer power becomes higher and affordable. Studies have found that global forcing factors influence regional climate variations (Lee and Robertson 2011). Considering this advancement, below ideas are proposed to take advantage of current knowledge on global teleconnection and computer power for agricultural production.
Development of methods to predict the onset dates of the rainy season based on global forcing factors (e.g., MJO, IOD, SST, SOI). The prediction of rainy onset is important as rainfall is a critical factor that determines farming activity in Indonesia.
Evaluation of the skill of forecast for Indonesia.
Development of dynamic cropping calendar based on the global forcing factors so that climate extreme events associated with climate dissaster such as flood and drought can be anticipated.
2.3. Precision Agriculture
7 Fig. 3: Diagram steps in precision agriculture. Source: Boer and Zaini (2012)
2.4. Crop Cultivar Adaptive to Climate Change
Understanding the impacts of climate change on crop production, crop cultivars that are resilience to drought or flood are explored and developed. This action is considered as a plausible adaptation option as increasing crop productivity in the recent decades is significantly influenced by the advancement in agricultural technology particularly the invention of crop cultivars (Egli 2008). As summarized by Boer (2013), crop cultivars that are resilience to drought, flood and salinity have been invented. Now, the question is to explore potential areas to plant the new cultivars in Indonesia.
8 Fig. 4: An example of the application of a crop model and GIS to map vulnerable areas to climate change.
The case is for citarum watershed. Source: prepared by Perdinan and Febriyanti (2013)
2.5 . Climate Index Insurance
Climate index insurance is proposed considering the failure of the implementation of crop insurance in Indonesia as discussed by Boer (2012). Philosophy of the insurance is payment will be made on the basis of unexpected climate condition regardless of crop loss/failure. This approach will simplify the complexity of
crop insurance that requires ‗field‘ checking to evaluate crop losses due to climate extremes. Boer (2012) explains that an index derived based on climatic condition such as rainfall amount during growing season that can cause crop failure (i.e., a climate threshold) is used to determine whether farmers can claim the
2040
2070
Ir iga te d + F er til iz er Ir iga te d + N o n Fe rti li ze r N on I ri ga te d + Fe rti li ze r N on I ri ga te d + N on F er ti liz er Yield (t/ha) NA <1.50 1.50 - 3.00 3.00 - 4.50 4.50 - 6.00 6.00 - 7.50 7.50 - 9.00 >9.00Change (%)
9 payment. For example, the amount of rainfall about 75 mm during growing season is used as a threshold for a location, which means farmers can claim the payment when the amount of rainfall during the season is less than 75 mm, regardless of crop failure or losses. Initially, the climate index insurance has been developed in developing countries, i.e., Africa, India, and the Phillipines as summarized by Boer (2012). The major challenge in the insurance system is to determine the climate threshold (i.e., index) for a location as climatic condition is location specific (i.e., development of climate index). Detail policy on payment and claim of the insurance system for Indonesia is also still being investigated. Further research is still needed including how to include the climate index into farming management in Indonesia as an adaptation option.
Fig. 5: Illustration of rainfall index and percentage of payment of insurance claim (Source: translated from Boer, 2012)
2.6. Management of Pest Infestations
Future warming condition is expected to influence the frequency of pest infestations. Many works have alarmed about the potential increase in pest infestations under climate change (e.g., Diffenbaugh et al. 2008; Luck et al. 2011). Changing climate pattern over the globe may also cause an invasion of pest and disease to a new region. Therefore, it is recommended to develop climate-pest/disease models to estimate pest
infestations under the ‗new‘ climate regime. Taking an advantage of climate index insurance, a development
of climate index insurance for pest infestations is also recommended.
3. Summary
Climate change is already occurring and expected to continue in the future. Consequently, adaptation programs to anticipate the potential impacts of climate change should be planed and implemented. This
paper elaborates potential ‗innovations‘ in the field of climate information, information technology, and
agricultural technology to support farming activities that also can be seen as plausible adaptation options. We believe to materialize the proposed innovations coordination and collaboration among stakeholders in agricultural sector is critical in order to maintain food security. Therefore, the important questions are 1) how can we work together in synergy?, 2) how to bring together high potential leaders from business, government and civil society to jointly develop the required capabilities for leading profound innovation and organizational transformation in the context of climate change?. International collaboration to strengthen the implementation of adaptation options is also recommended (Perdinan 2010) considering different adaptive capacity from country to country around the world. We do hope this paper can provide valuable information as an attempt to response to those questions.
4. References
10
[2] Boer, R., A. Buono, Sumaryanto, E. Surmaini, W. Estiningtyas, M. A. Rataq, Perdinan, A. Pramudia, A. Rakhman, K. Kartikasari, and Fitriyani. 2009. Pengembangan sistem prediksi perubahan iklim untuk ketahanan pangan. Laporan Penelitian Konsorsium Peneliti Keragaman dan Perubahan Iklim. Bogor: Departemen Pertanian.
[3] Boer, Rizaldi. 2012. Asuransi Iklim Sebagai jaminan Perlindungan Ketahanan Petani Terhadap Perubahan Iklim. Paper read at Prosiding Widyakarya Nasional Pangan dan Gizi 10: Pemantapan Ketahanan Pangan dan perbaikan Gizi Berbasis Kemandirian dan Kearifan Lokal, 20-21 November 2012. LIPI, Jakarta.
[4] ———. 2013. State of the Arts Riset Agroklimat untuk Strategi dan Adaptasi Pertanian terhadap Perubahan Iklim 2013 [cited October 24 2013]. Available from repository.ipb.ac.id.
[5] Cline, W.R. 2007. Global Warming and Agriculture: Impact Estimates by Country. Washington D.C.: Centre for Global Development.
[6] Diffenbaugh, N. S., C. H. Krupke, M. A. White, and C. E. Alexander. 2008. "Global warming presents new challenges for maize pest management." Environmental Research Letters no. 3 (4):44007.
[7] Egli, D. B. 2008. "Comparison of corn and soybean yields in the United States: historical trends and future prospects." Agronomy Journal no. 100 (3, Supplement):S-79-S-88. doi: 10.2134/agronj2006.0286c.
[8] Jones, J. W., G. Hoogenboom, C. H. Porter, K. J. Boote, W. D. Batchelor, L. A. Hunt, P. W. Wilkens, U. Singh, A. J. Gijsman, and J. T. Ritchie. 2003. "The DSSAT cropping system model." European Journal of Agronomy no. 18 (3-4):235-265.
[9] Kalnay, E., S. J. Lord, and R. D. McPherson. 1998. "Maturity of operational numerical weather prediction: Medium range." Bulletin of the American Meteorological Society no. 79:2753-2769.
[10] Lee, D.E., and A.W. Robertson. 2011. Enhancing forecast skill of the Indonesian rainfall onset using
[11] MJO updates. In Progress Report to NOAA 2011 NA10OAR4310210: July 2010 - March 2011. New York: The International Research Institute for Climate and Society, Columbia University.
[12] Luck, J., M. Spackman, A. Freeman, P. Trebicki, W. Griffiths, K. Finlay, and S. Chakraborty. 2011. "Climate change and diseases of food crops." Plant Pathology no. 60 (1):113-121. doi: 10.1111/j.1365-3059.2010.02414.x. [13] Mearns, Linda O., Ray Arritt, Sébastien Biner, Melissa S. Bukovsky, Seth McGinnis, Stephan Sain, Daniel Caya,
James Correia, Dave Flory, William Gutowski, Eugene S. Takle, Richard Jones, Ruby Leung, Wilfran Moufouma-Okia, Larry McDaniel, Ana M. B. Nunes, Yun Qian, John Roads, Lisa Sloan, and Mark Snyder. 2012. "The North American Regional Climate Change Assessment Program: Overview of Phase I Results." Bulletin of the American Meteorological Society no. 93 1337-1362.
[14] Mesinger, F., G. DiMego, E. Kalnay, K. Mitchell, P. C. Shafran, W. Ebisuzaki, D. Jovic, J. Woollen, E. Rogers, E. H. Berbery, M. B. Ek, Y. Fan, R. Grumbine, W. Higgins, H. Li, Y. Lin, G. Manikin, D. Parrish, and W. Shi. 2006. "North American Regional Reanalysis." Bulletin of the American Meteorological Society no. 87 (3):343-360. doi: 10.1175/bams-87-3-343.
[15] MoE. 2007. Indonesia Country Report: Climate Variability and Climate Change, and their Implication. Jakarta: Ministry of Environment, Republic of Indonesia.
[16] NASA. 2011. "Surface meteorology and Solar Energy (SSE) Release 6.0 Methodology. Available at http://power.larc.nasa.gov/common/MethodologySSE6/POWER_Methodology_Content.html (verified September 06 2011)." In. http://power.larc.nasa.gov/common/MethodologySSE6/POWER_Methodology_Content.html. [17] Perdinan. 2010. "A Rationale for International Cooperation in Implementing Adaptation Strategies to Climate
Change in the Face of Global Inequality." Journal of Asian Society for International Relations and Public Affairs no. 1:1-8.
[18] Perdinan, Julie Winkler, and Jeffry Andresen. 2013. Traditional versus Modern Approaches of Estimating Daily Solar Radiation for Input to Crop Process Models. Chapter 3 in a dissertation "Crop Production and Future Climate Change in A High Latitude Region: a Case Study for the Upper Great Lakes Region of The United States" Geography, Michigan State University, East Lansing.
11
[20] Schmidhuber, J., and F. N. Tubiello. 2007. "Global food security under climate change." Proceedings of the National Academy of Sciences of the United States of America no. 104 (50):19703-19708. doi: 10.1073/pnas.0701976104.
[21] Shuman, F. G. 1989. "History of Numerical Weather Prediction at the National Meteorological Center." Weather and Forecasting no. 4:286-296.
[22] Timmermann, A., J. Oberhuber, A. Bacher, M. Esch, M. Latif, and E. Roeckner. 1999. "Increased El Nino frequency in a climate model forced by future greenhouse warming." Nature no. 398 (6729):694-697.
12
13
Pro-Poor Technology in Small Scale Farming
For Adaptation to Weather Anomalies
Maman Rahmansyah
1, and Arwan Sugiharto
1, I Made Sudiana
11
Research Center for Biology, Indonesian Institute of Sciences, Cibinong Science Center
Abstract. The objective of study was to assess the role of local biodiversity resources and pro-poor
technology input on the ability of local community (community resilience) to face the impact of weather or climate anomalies. Local resources of floral feed have a significance sense to farmer community resilience faced climate anomalies impact, particularly in some certain local farmer in the dry land of northern and eastern small island of Bali, Indonesia. Forage availability was influenced by on water shortage. Climate anomaly impact to perceive rainfall shifting, even to the dry season period began. In Bali, peak of dry climate crisis in 2004 led to feed even to food scarcity. Those above problems should be anticipated by enthusiasm of local farmer communities. Due to this obscurity, studies had been summarized on the potential of floral forage resources. This study examines in attempt to identify local forage sources utilized as feed and silage during the transition and along the dry season. Results of the current assessment concluded that silage fermentation was acceptable for the forage preservation in effort to maintain feed availability as livestock favor. Main study was verifying the role of fermentative and hydrolyzing microbes, particularly Lactobacillus plantarum. The output of the representation work could become a reference in addressing for adaptation response through the application of functional microbial technology involvement in the small local cattle management activities, in particular for silage handling to keep the feed quality and its continuity of the supply.Keywords: local-resources, anomalies-impact, silage, microbial-technology
1.
Background
Case study was executed in the dry land exotic island of Bali. The programs focused on farming resilience to weather anomalies for adaptation. Related work was designated to small scale livestock throughout microbial fungsional applications. Climate change is a real issue, and some certain action is needed to be established. Weather anomalies influenced farm planning and its utilities. At the same time, technology utilities appear to have beneficial from their various efforts to understand their potential vulnerabilities and to evaluate long term planning options. Despite of the uncertainty, small scale farming is reasonable and has prudent steps taking the ordinary technology to better understand and manage the farm within cope the risk required to support rural livelihood. In the contrary, strengthening of feed intake often missed by farmer particularly to the small scale cattle activities. In the other hand, the presence of small cattle by farmers in Indonesia which are relatively large; empowered of its potential and might become a national oblige to contribute for self-sufficing of meat provision (Pusat Penelitian dan Pengembangan Petemakan, 2010).
Forage sources can be obtained from the forest and the gardens, or cultivated within agroforestry farming. Agricultural waste used as feed source being consumable directly to livestock, subsequent to ensilage process. At the ensilage technology, there were recognized through biological (silage) and chemical processing (ammonium hydrolysis). The biological process normally used anaerobic microbes as inoculant. Silage can maximize the uptake of feed and gain the weight more rapidly. Forage portion preparation using as the main ingredient, then fitted with supplements, additives such as probiotics and pro-vitamin, will ensure adequate nutrition for livestock (Rook et al, 2004).
Forage availability derived from natural habitats and as well as cultivated ones, must be influenced by climatic conditions. In the rainy season forage availability is often abundant, while in the dry season becomes less. In the normal climatic conditions, the rhythmic of supply and demand might tend to be balanced in nature. Climate change due to weather anomalies was affecting floral growth performance
14 producing forages. Strategies were needed to improve adaptability of each component to their respective life communities. Part of basic concept of integrated farming system would keep resulting for vegetation mixtures that combine grasses, legumes, trees, palms, shrubs and edible weeds, vegetable, fruits etc., and will contribute to increase photosynthesis, improve nutrient recycling, recover soil biota and fertility, and enhance biodiversity (Bellefontaine et al., 2002). Unavailability of feed stock in the sufficient quantities as due to land restriction in some certain places must be solved together to obtain the solution (Risdiono et al., 2009; Murgueitioa et al., 2011; Janzen, 2011; Ukanwoko and Igwe, 2012).
Reveal the above mention so the study was focused to inventory on local floral resources used for feed in the dry land area. Microbial technology in feed process disseminated to the farmer which is aimed to optimize the feed quality and stock continuity along the dry season. In the other hand, the aims of the activities is also to provide information on the scope of mainstreaming effort in the adaptation concept in relation to climate change due to anomalies weather impacts affect the small-scale cattle farming activities in the rural neighborhood.
2.
Method
Field rapid assessment was determined before work implementation. Local forage inventory was completed into descriptive assessment. Pure microbial culture was prepared in the laboratory and turn to applicable field inoculant, it is called starter, and straightly introduced to local farmer. Laboratory inoculant (starter) then augmented in the field to have some confident yield of some microbial cells‘ function (for feed, composting, urine fermentation) by using some local resources such as carbon source (local palm sugar), mineral (coconut water), nutrient (vegetable extract), or even snail (Pomacae canaliculata Lamarck) egg as protein source, molasses, etc., to become field inoculant (FI) preparation that can be reproducible by farmer.
Hundred kilograms of fresh forage (60 percent moisture content due to dried in ambient room condition after harvest; preferably chopped in one cm square) added with some of mixed material (consist of 5 kg rice brand, 400 ml FI, 200 ml molasses, and 1400 ml water). Filled the mixed-chopped-forage into full and compact volume inside sealed air-tight bag, and wrap to keep anaerobic condition, afterward that ensiled feed has turn into nutritive value after three days incubation. The silage can be storage for long stock to few months. Uncertainly forage moisture, in about 40 percent, could make excessive heating inside the bag because of mold growth, and as due to that spoilage silage has to be disposed. In the same way, there was other usage of dry forage (agriculture waste such as straw of grasses and legumes families are dried into twenty percent moisture). A hundred kilograms of dry chopped forage mixed with 4 kg organic compound (urea as non-protein nitrogen sources) and make it in a closely package. After incubation, that amonification forage should be kept at open drying to evaporate odors before feed (Schroeder, 2013).
To evaluate result of fermented and hydrolyzed forage, then the proximate analysis through the samples include the percentage of water content, pH, ash content, dry matter, crude fiber, crude fat, neutral detergent fiber (NDF: lignocelluloses material), acid detergent fiber (ADF: hemicelluloses material), extract materials without nitrogen, protein content, crude protein, total acid, calcium (Ca) and phosphorus (P) were observed in the laboratories work.
3.
Result and Discussion
15
Table 1. List of potential local feed
16 Environmental failure which is associated to agricultural activities are forest destruction, grasslands expansion, land degradation and, increasing of degraded lands, as well as desertification, and all of that ought to become problem. The effect is to reduce biodiversity impacts. In the other hand, land crisis occurs within increasing human population, agricultural commercialization, agricultural technology inputs, and increasing consumption need. Tropical silvopastoral systems provide benefits in terms of ecosystem services, climate change, sustainable productivity, and landscape-level restoration. Current potential of small agriculture system are beginning to recognize in the productive, ecological, and social advantages of smaller-scale, less-intensive, sustainable, and their potential to provide future food as well as feed security (Herrero et al., 2010). In the other way within relation to small cattle management in the study, integrated farming systems might offer an option to increase land productivity based on simple technology and incorporating input agronomic and ecological aspects.
Feed requirements necessary to offset local government support, among others, to expand the garden green fodder, seed supply, as well as striving for the establishment of feed processing units. Feed supply center can be arranged through the manufacture of feed mill centers, or manufacturing feed barn. Intake of silage making technology with a functional role for microbes utilizes agricultural waste into feed. Rice straw is available in abundance in every area of arable farm to be used as feed source.Results of the current assessment concluded that silage fermentation was acceptable for the forage preservation in effort to maintain feed availability as livestock favor. Main study was verifying the role of fermentative and hydrolyzing microbes, particularly Lactobacillus plantarum(Table 2).
4.
Conclusion
The output of the representation work could become a reference in addressing for adaptation response through the application of functional microbial technology involvement in the small local cattle management activities, in particular for silage handling to keep the feed quality and its continuity of the supply. Microbial technology transfer is a critical step in good handling practice for feed quality improvement and more likely
applied via small farmers‘ activities in the dry land areas.Concept of improvement within functional microbe and its utilization for adaptation through local resources become practicable relating to management of small scale livestock.Supply of feed through integrated farming activities was able to keep small cycle carbon energy (cellulose) and which was even in maintain decreasing emissions.
5.
References
[1] Pusat Penelitian dan Pengembangan Petemakan. Rekomendasi Teknologi Petemakan dan Veteriner Mendukung Program Swasembada Daging Sapi (PSDS) Tahun 2014. Badan Penelitian dan Pengembangan Pertanian, 2010. [2] A.J. Rook, B. Dumont, J. Isselstein, K. Osoro, M.F. Wallis De Vries, G. Parente and J. Mills. Matching type of
livestock to desired biodiversity outcomes in pastures – a review. Biological Conservation. 2004, 119:137–150. [3] R. Bellefontaine, S. Petit, M. Pain-Orcet, P. Deleporte, J.G. Bertault, J.G. Trees outside forests: toward a better
awareness. FAO Conservation Guide 35, Rome,2002.
[4] B. Risdiono, B. Haryanto, D.P. Nurhayati and B. Setiadi. Availability and utilization of forage resources for smallscale farm in Indonesia. p. 57-64. Proceedings of the International Seminar on Sustainable Management and Utilization of Forage-Based Feed Resources for Small-Scale Livestock Farmers in Asia, Lembang, Indonesia, 3-7 August 2009. FFTC-ASPAC, IRIAP and LRI, CoA, Taiwan, 2009.
[5] E. Murgueitioa, Z. Calle, F. Uribe, A. Calle and B. Solorio. Native trees and shrubs for the productive rehabilitation of tropical cattle ranching lands. Forest Ecology and Management. 2011, 261:1654–1663.
[6] H.H. Janzen. What place for livestock on a re-greening earth? Animal Feed Science and Technology. 2011, 166:783–796.
[7] A.I. Ukanwokoand N.C. Igwe. Proximate composition of some grass and legume silages prepared in a humid tropical environment. International Research Journal of Agricultural Science and Soil Science. 2012, 2(2):068-071.
[8] Schroeder, J.M. Quality forage: Haylage and other Fermented Forages. County Commissions of North Dacota State University and U.S. Department of Agriculture Cooperating,2013. (www.ag.ndsu.edu).
17
Analysis of Farming Systems in the Arid Climate Region as Impacts of
Adaptation to Climate Change in East Nusa Tenggara (NTT)
Harmi Andrianyta
1+and Titim Rahmawati
11
Indonesian Center for Agriculture Technology Asssesment and Development
Abstract. Performers farming in arid climate areas of East Nusa Tenggara familiar with short rainy season.
However, the climate anomaly has caused many extreme events such as adverse agricultural drought, flood, pest attacks and uncertainty season. The research aims to analyze the changes in farmer's behavior as adaptation to climate change in dry areas. The experiment was conducted in the province East Nusa Tenggara as representative of arid climate regions in Indonesia.To compare that effect, selected two sample sites namely rainfed and irrigation on climate type D3 and D4 (climate type Oldeman) in two regency Kupang and South of Timor Tengah. Respondents were selected randomly in the sample sites. Primary data was collected through a questionnaire survey with tools against 30 respondents. Observed variables encompassed farming activities, cropping pattern, seed requirements, farming cost, kind of commodities, pest attack and coping strategies of family upon normal and extreme years. Data were statistically analyzed with a nonparametric test of hypothesis using the comparative testKruskall Wallisand Chi Square test,crosstabulationof the normal/extreme year. The results showed that the significant impact be found on the level of pest attack, seed application, fertilizer application, varieties of paddy. The conclusion, dryland farmers in both irrigated and rainfed adapt by improving cultivation by replacing varieties and manure applications. however the cost is not significantly different on different conditions. Different is the level of pest attack is higher during extreme rainfall years.Keywords:
Climate change, farming system, pest attack.1.
Background
Climate change is a change in climate parameters such as temperature, humidity, rainfall within a period of 50-100 years, triggered by an increase in greenhouse gas emissions. Greenhouse gas emissions continue to rise has consequences for global warming. Where greenhouse gases (CO2, CH4 and N2O) are inhibiting the
reflection of infrared radiation to the earth so that the earth's atmosphere is getting hotter. According to [1] increase in global temperature due to a doubling of CO2 concentration has led to an increase in global
temperatures between 1.0 to 3.5 ° C which will take place between now and 2100. Temperature increase is also followed by an increase in the average presitipasi 10-15% due to a warmer atmosphere bind more water vapor.
Region of East Nusa Tenggara mostly located (30,4%) on the island of Timor. Rice harvested area in 2010 from all districts of the island of Timor contributed nearly 20% of the whole province of NTT [2]. Cropping pattern during normal years is one rice and one-time planting crops, but the calendar is very dependent on water availability. Uncertainty of rainfall has disrupted the planting calendar farmers depend on rain water. Although the Local Government through budget funds have built up a network of technical irrigation to anticipate fluctuations in the availability of water but not fully correct the problem.
Climate anomalies in the arid region NTT affected by El Nino events and La Nina is affecting the growth center of the cloud and sea surface temperature. BMKG Kupang Lasiana station stated that the type of monthly rainfall in the region is a type of rain NTT Monson in which only happened one rainy season typically peaks from December to January Month. Differences in the dry season to the rainy season is very clear where the rainy season occurs during south-west monsoon system is dominant across the region.
Issues underlying this paper is that the farmers in the area during the dry climate has experienced difficulties in crop farming. Low rainfall, poverty and powerlessness has increased the vulnerability of farmers to climate change impacts. Meanwhile, commodity crops are also sensitive to climate change thus
+
Corresponding author Tel : +62251 8351277; +6281310968613; fax: +62251 8350928
18 might add to the burden of farmers. Therefore, this paper will discuss how farmers do farming as an effort to adapt to climate change along with the changes of the supporting aspects.
2.
Literature Review
The rainy season in Indonesia is influenced by several factors such as El Nino / La Nina, sea surface temperature, dipole modes, and monsoon easterlies / westerlies [3;4]. Climate anomalies in the arid region NTT affected by El Niño events and La Nina is affecting the growth center of the cloud and sea surface temperature. Meteorological and geophysics agency Lasiana Kupang stated that the type of monthly rainfall in the region is a type of rain NTT Monson which only happened one rainy season normally peaks from December to January Month. Differences in the dry season to the rainy season is very clear where the rainy season occurs during south-west monsoon system is dominant across the region [5].
Research [6] in Indonesia, stated that the extension agrometeorology role in improving the understanding of farmers in aspects of management and manipulation of water in their fields. Through field school climate in a particular period, farmers in Indramayu and Gunung Kidul trained to observe rainfall and temperature then make records relating to pests and productivity. Lessons learned from it is used to adjust farm management (sowing, transplanting, water, pest fighting, using fertilizers etc.).
Increased frequency natural disasters such as floods, tsunami, hurricane, etc during the recent year might be attributed to the climate change assosiated to increased accumulation of greenhouse gases (GHGs) in the atmosphere. The global surface temperature increased by 0.6oC since the late 19th century with a current average warming rate of 0.17oC per decade [7]. According to the data [8] in Indonesia, agriculture produce methane gas averaged 6.9% since 2005 is higher than the average world production. In addition, the use of fertilizers based on average kilograms per hectare of arable land, Indonesia is much higher than the world average.Besides as the emitter, the agricultural sector also play a role as an absorber of greenhouse gases such as sinks, C sequestration, and maintaining watershed hydrology [9].
Several studies have revealed [10; 11] that Carbon sequestration from the atmosphere can be applied through measures such as rotation cultivation, intercropping, cover cropping, companion cropping, ratoon cropping, and appropriate cropping practices.In addition, adaptation strategies to anticipate the impacts of climate change AARD has generated technological innovations such as improved varieties low emission, land and water management, and zero waste technology [12].
3.
Method
Location of the study was in the province of NTT in 2011. The choice of location is based on the consideration that the majority of the island of Timor in NTT Province including dry and extremely dry category (D3 and D4) based classification according Oldeman climate. With the category of vulnerable
regions to climate change, especially the parameters of rainfall, temperature and humidity.
Sampling locations are intentionally determined Kupang and South Timor Tengah (TTS) with consideration of the area is a food crop production centers to the mainland island of Timor. There are irrigated and rainfed rice in every type of climate. Therefore, in determining the location of the sample must be representative of the population (overall condition). Climate type D3 irrigated rice in East Kupang District
represented by Noelbaki village, rainfed lowland villages represented by Tuakole and Oesao. While climate type D4 in TTS district represented by Batu Putih village Oebobo for irrigated and South Amanuban
represented by Bena Village for rainfed rice. The selection of respondents with stratified random sampling method is selected respondents stratified by climate type next based on the type of irrigation. The number of respondents as a whole is 30 people.
19 the Kruskall-Wallis and Chi-Square test (α=5%). For deepening the discussion, several variables such as the use of seed, fertilizer application and intensity of pests attack was analyzed descriptively and cross tabulation.
4.
Result and Discussion
Farmers in dry climates with very poor conditions suffered because of climate uncertainty. It is related with the availability of water as a critical factor in farming. Upon dry climate, sufficient water is available only for once planting paddy so that farmers must rescue the farm so as not to suffer greater losses. Altough wetland irrigation have water storage reservoir, yet during dry year available water is not sufficient to watering the paddy field. It is only sufficient to watering maize crop or other legume. Distinction of agro-climatic zone showed duration the period rainy season or dry season (Table 1).
Table 1. Description of study sites
Agro-ecosystems
Agro-climatic Zone
Zone D3 Zone D4
Village Sub-District Regency Village Sub-District Regency Irrigation Noelbaki Noelbaki Kupang Oebobo Batuputih South Timor Tengah
Raifed
Oesao Center Kupang Kupang Tuakole Batuputih TTS Babau East Kupang Kupang Bena South
Amanuban
TTS
Source : Primary data (2011)
There are some actions that do farmers as effort to adapt against the climate change. For example the changes in cropping pattern, the use of seed, fertilizer use so that alter the overall farming costs.Table 2 showed that cropping pattern upon the normal year are once paddy and twice paddy with number of farmer rateably. During extreme precipitation most farmers change their cropping pattern to be twice of paddy. Otherwise, farmers reluctant to take the risk during extreme drought. Nevertheless, the alteration is not significant statistically if compare between normal year and extreme year. Except comparing between extreme precipitation and extreme drought.
Table 2. Cropping pattern of farmer in Kupang and East Timor Tengah, NTT Province, Indonesia
Cropping pattern Year
Normal Extreme precipitation Extreme drought
Paddy 16 7 23
Paddy – Paddy 14 23 7
Total 30 30 30
Source : Primary data (2011)
What did farmers actions in term of seed application as adaptation to climate change on their environment? Table 3 indicates that there is difference of treatment during extreme drought year. In arid region, the farmer have been guessed that delayed rainy season related with severe drought and high risk of failure. So that, farmer did not invest high quality seed. To averted worse losses, farmer working off-farm.
20 Table 3. Seed aplication for normal, extreme precipitation and extreme drought in Kupang and East Timor
Tengah, NTT Province, Indonesia
Seed Application Year
Normal Extreme precipitation Extreme drought
Label 27 26 24
Non label 3 4 6
Total 30 30 30
Source : Primary data (2011)
In terms of fertilizer application, the fact on Table 4 indicated that there were some means of fertilizer application, namely just added manure, added chemical fertilizer, both of them and no addition. During extreme precipitation, majority farmer increase dosage and kind of fertilizer. Because it expected able to guard the crop from pest attack and erotion of nutrient. Farmer choosed the option consider chance of water availability during longer period.Manner of fertilizer application, statistically differ between normal and extreme year.
Table 4. Fertilizer application for normal, extreme precipitation and extreme droughtin Kupang and East Timor Tengah, NTT Province, Indonesia
Fertilizer application Year
Normal Extreme precipitation Extreme drought
(+) Manure 0 1 0
(+) CF * 14 18 16
(+) Manure & (+) CF 6 4 4
No additional 10 7 10
Total 30 30 30
*CF = Chemical fertilizer Source : Primary data (2011)
Table 5 shows that of the seven parameters tested just one parameter different significantly that is level of pest infestation. Higher levels of pest attack occurred in extreme wet. Whereas farmers increase cropping intensity in that year. Meaning that if farmers want to benefit from the excess rain water, farmers have to raise capital to seed quality and high levels of pesticides as pest deterrent. While the other parameters were not significantly different. Parameter seed costs, fertilizer costs, pesticide costs do not distinct even when the extreme dry or wet. Farmers in dryland farming did not increase spending because of the lack of capital to do it.Irrigation in dry land areas does not give large changes in extreme due to water debit in the reservoir is insufficient to irrigate the paddy fields so that farmers keep land fallow.Similar conditions occur in extreme wet years in which excess water debit caused flooding in paddy fields so that farmers no opportunities to increase/ decrease the scale farming.
Table 5. Test Statistics for some parameters using Kruskal Wallis test based on grouping variables extreme years a,b
Seed cost Urea cost TSP cost Chemical Pesticide cost
Level pest infestaton
Type of
irrigation Farm scale
Chi-Square 1.340 1.205 1.329 2.946 48.138 .110 .072
Df 2 2 2 2 2 2 2
Asymp. Sig. .512 .547 .515 .229 .000 .947 .965
a. Kruskal Wallis Test
21
5.
Conclusion
During extreme precipitation, farmers increase cropping intensity and improve cultivation patterns with changing varieties and method of fertilizer. However, higher levels of pest attack occured on extreme precipitation and thus require greater pesticide costs of. Thus, the system of rice farming in extreme precipitation requires a higher cost in order to obtain optimal results. The condition also occurs in irrigated land because the debit of water irrigation has not been sufficient to regulate water during extreme years. to avoid greater costs, farmers in dry lands recommended to make efforts to implement adaptation using the mixed crop varieties and quality and balanced fertilization during years of extreme wet and extreme dry.
6.
References
[1]
Crosson. Impacts of Climate Change on Agriculture. Climate Issues Brief No. 4. Resources for the future. 1616 P Street NW. Washington, DC 20036. 1997.[2] www.ntt.bps.go.id. Central Statistical Agency East Nusa Tenggara Province. [September 10th, 2013]
[3] Timmerman,A., J. Oberhuber, A.Bacher, M.Esch, M.Latif and E. Roekner. Increased El Nino frequency an a climate model forced by future greenhouse warming. Nature. 1999; 398.
[4] Hansen, J., M.Sato, R. Ruedy, K. Lo, D.W. Lea and M. Medina-Eliza. Global Temperature change. PNAS. 2006. 103 ; 14288-14293.
[5] http://staklimlasiana.blogspot. Lasiana Climatology Station. Kupang.
[6] Stigter, K, Y.T. Winarto, E. Ofori, G. Z-Netshiukhwi, D. Nanja, and S. Walker. Extension Agrometeorology as the Answer to stakeholder realities : Response Farming and the Consequences of Climate Change. Article. Atmosphere. 2013, 4 : 237-253.
[7] IPCC. Climate Change. The Scientific Basis. Intergovernmental Panel on Climate Change. Cambridge University Press. Cambridge. 2001.
[8] World bank. Data. http://data.worldbank.org/indicator/AG.CON.FERT.ZS/countries/1W-ID?display=graph. [September 10th 2013].
[9] Agus, F., I. Irawan, H. Suganda, W. Wahyunto, A.Setyanto and M. Kundarto. Environmental multifunctionality of Indonesian Agriculture. Journal Paddy Water Environment. 2006, 4 : 181-188.
[10] Wang, Q., Y. Li, A. Alva. Cropping System to Improve Sequestration for Mitigation of Climate Change. Journal of Environmental Protection, 2010, 1 : 207-215.
[11] Maponya, P and S. Mpandeli. Climate Change and Agricultural Production in South Africa : Impacts and Adaptation Options. Journal of Agricultural Science, 2012, 4 (10) : 48-59.
22
Rice Supply on Climate Anomaly Condition in Central Java Province
Nandika Aisya Pratiwi
1+1
Student of Bogor Agricultural University
Abstract.
The happening of climate anomaly, El Nino and La Nina, have been much stronger and making a huge impact on various sectors in the last decade. In the agricultural sector, El Nino and La Nina cause the greater dry and wet conditions than the normal condition, so that the food production system in Indonesia is hampered obviously. This study aims to analyze the impact of El Nino and La Nina concerning to rice supply in Central Java Province. The study was analyzed with descriptive analysis method by making use of secondary data from years 1990-2010. In this study, the supply function was analyzed by regression analysis of ARMA (Autoregressive Moving Average) to estimate the alteration of rice supply in the climate anomaly circumstances. The occurrence of El Nino and La Nina is indicated by south oscillation index, then it is included in the regression analysis as dummy variable. The regression analysis shows that El Nino has no significant important on rice supply in Central Java. On the other hand, La Nina has a positive impact on rice supply. Rice supply function indicates that the rice supply in Central Java increases at the occurrence of La Nina. Therefore, rice supply is much greater at La Nina condition than the normal and El Nino conditions. The increasing of rice supply in Central Java during La Nina condition becomes one of the alternative way for area optimization when climate anomaly occurs. It is certainly good thing for the government, because the climate anomaly is not always make a bad impact. A good management about rice cultivation in the occurrence of climate anomaly, supports the increase of rice supplies so that the welfare of farmers will be improved.Keywords:
El Nino, La Nina, supply, ARMA1.
Background
Indonesia is known as an agricultural country which relies on agriculture as source of livelihood as well as the support of development. The agricultural sector is a strategic sector and has an important role in the national economy and for community survival, particularly in its contribution to Gross Domestic Product, employment providers and the provision of food in the country. Being aware of this role, make most of the people still maintain agricultural activities. However, over the years the production of agricultural products is still far from expectations. This is due to several factors. Internal factors that affect the low quality of human resources peasant society, hence, most farmers still use the conventional way while the recent technology is highly demanding modernization. Moreover, external factors that affect them is the conversion of agricultural land into industrial land and the climatic factors as well,which is being a concern to the experts because it raises a lot of disasters.
Climate anomaly subsequently influenced the Indonesian agricultural production, especially rice. One form of climate anomalies that have been occuring at this time are the El Nino and La Nina, which are becoming more frequent and longer in duration. El Nino events are usually followed by a decline in rainfall, while the La Nina lead to increased rainfall. Both of these events can be considered as disasters caused by climate anomalies and disadvantageous. At El Nino events, the availability of water for agricultural crop production is reduced, which decreases or even no harvest because of drought. While the La Nina events, the availability of water to be excessive and cause flooding so that the plant can also crop failure. Climate anomalies are more frequent with more extremely weather conditions and the longer duration, it rises a significant impact on agricultural production in many countries. (IPCC, 2008). Since rain is one of the important components in the agricultural world , it is very important to have the information about rainfall, especially for determining the plan for cropping patterns and post- harvest and other activities related directly or indirectly .
Central Java Province as one of the national food buffer has fluctuative rice production levels from time to time. The availibility of land area is fixed, and even tends to decrease because it is switching to
+
Corresponding author. Tel.: +6285729335010
23 agricultural functions. The average of riceharvested areain Central Java is1.6 million ha / year during the years 1990-2010. Agriculture potention in Central Java province scattered throughout the district. This area also among provinces with the title of national food buffer. The main results of agriculture in Central Java province is the rice and horticultural crops. (Triyanto, 2006) .
From the description, it appears that El Nino and La Nina were also taking a role in affecting the agricultural sector in the province of Central Java. El Nino and La Nina as a form of climate anomalies will affect agricultural production. Because water is an absolute necessity for plant growth, then the condition of water shortage at El Nino orexcessive water at La Nina during the course will affect plant growth. Plant growth which is not optimal of course will affect the rice offers downhill and of course this will have contributed to the price received by farmers. Because the prices received by farmers decreased, it can be said that the welfare of farmers measured from farmers exchange rate also decreased because their income is reduced. Therefore, in this study, it willbe estimated the influence of El Nino and La Nina on the supply function and the exchange rate function of rice farmers.
2.
Literature Review
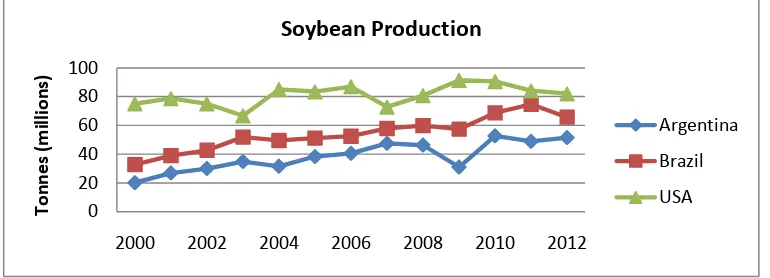
The phenomenon of drought and flood is a natural disaster that occurred almost every year in parts of Indonesia. These disasters are usually large and give highly detrimental impact on agriculture. One scientist who has been researching the impact is Irawan (2006) which states at the national level, food production opportunities rice and pulses were lost due to El Nino on average by 3.06 percent, or about 1.79 million tons for each El Nino event. Decline in food production was greatest in maize by 11.9 percent and lower in cassava plants only decreased by 1.28 percent, and rice by 2.43 percent. Soybean that was sensitive to water shortages, experienced substantial decline in production about 5.10 percent. The opposite occurred in La Nina events. At the national level, the climate anomalies stimulatedthe increase production of food grains and pulses at 1.084 percent for every La Nina occurrence. The highest increase happened in production of corn, whichwas equal to 3.92 percent. This suggests that corn plants are sensitive to climatic anomaly, either El Nino or La Nina, compared to other crops. Increased production is not very high because of La Nina occurs in plants
Further research conducted by Utami (2008) on the impact of El Nino and La Nina on the supply and the welfare of rice farmers and corn on the island of Java. The results showed that during the period 1987-2006, El Nino events have resulted a decrease rice yield by 4.15 percent, while La Nina increased rice yield by 1.45 percent. With the analysis of supply function, note that the El Nino does not significantly influence rice deals, but La Nina significantly influence rice deals. This means that rice production at the farm level is affected by the occurrence of climate anomalies.
3.
Method
This study usesthe basicresearchdescriptiveanalysis, itis a methodforexaminingthe status ofhuman groups, an object, a set of conditions, a systemof thoughtora class ofeventsin the present. Data collection wasperformedby the method ofrecording thesecondary datacontainedinthe Central Statistics Agency, Department of AgricultureCentralJava province, andBOMAustralia from1990 to 2010. Forricesupply functionvariablesareregressedusingquarterlydata since it is in accordance with riceproduction dataas the dependent variablewhich is onlyavailablepergrowing season (four months), so the dataof independent variablesthatare availablein themonthly datawere averagedperfour months.
To estimate the influence of the El Nino and La Nina on rice supply function was analyzed using the method of ARMA (Autoregressive Moving Average). The main reason for the use of ARMA models is the movement of economic variables in the supply function were obtained from the time series data that are difficult to explain by economic theories (Widarjono, 2007). In the ARMA model, there is no specific assumptions about the historical data of the time series, but uses an iterative method to determine the best model. Supply function is estimated as follows:
logQt = logb0 + b1logX1 + b2logX2 + b3logX3 + b4logX4 + b5logX5 +b6logX6 + b7logX7 + b8AR(3) +
24 Description:
logQt : log rice supply (tons) b0 : constants
b1-b11 : coefficient
logX1 : log of dry grain harvest prices (USD / I)
logX2 : log of corn prices (USD / I)
logX3 : log of soybean prices (USD / I)
logX4 : log of cassava prices (Rp / I)
logX5 : log of urea fertilizer prices (USD / kg)
logX6 : log of TSP fertilizer prices (USD / kg)
logX7 : log of average wage laborer (USD / day / person)
D1 : dummy variable El Nino events
1 = occurred El Nino 0 = not occur El Nino
D2 : dummy variable La Nina events
1 = occured La Nina 0 = not occur La Nina AR (3) : autoregressive 3 MA(5) : moving average e : factor disorders
4.
Result and Discussion
El Nino and La Nina are climate anomalies associated with rainfall,cover a wide area which are Australia, Southeast Asia, western United States to western South America. Some research has been conducted to determine the impact of El Nino and La Nina particularly in the field of agriculture. El Nino and La Nina as climatic anomalies events certainly have a negative impact, especially in Indonesia, its geographical position vulnerable to the impacts of climate anomalies.
The occurrence of El Nino and La Nina will affect rice production in Indonesia, especially in Central Java province as provincial national food buffer. Fluctuations in rice production in normal conditions, El Nino and La Nina are shown in Figure 1 below.
Fig.1 : Rice Production in Normal, El Nino, and La Nina Condition
Figure 1 shows the quarterly fluctuations in rice production in normal conditions, El Nino and La Nina in Central Java province in 1990-2010. From Figure 1 it is seen that the highest rice production was always obtained at the condition of La Nina and the lowest rice production was obtained on El Nino conditions. Production on normal conditions is always located between El Nino conditions and La Nina. The result holds for all months from January to December which is then divided into quarterly system.
0 1 2 3 4 5
Jan-April Mei-Agustus Sep-Des
R
ic
e
p
ro
d
u
ct
io
n
(
m
il
o
n
/t
o
n
)
Months
Normal
El Nino
25 Supply model is used to determine the price and quantity sold in the market. This model accommodates the possibility of factors that can change the balance, which will then be displayed in the form of a shift of the offer .
In line with the theory of supply, rice production will also offer experienced response as there are several variables that affect it. Moreover, because rice is one of the agricultural products. One of the main characteristics of agricultural products is a time lag between planting and harvest. In most agricultural commodities, the price of output cannot be ascertained when the commodity was planted. Farmers should take production decisions based on an estimate of product prices according the experiences of the past . It refers to the interval between the two periods, when to plant and harvest. Farmer response occurs after an interval as the impact of changes in input prices, output and government policies.
Seeing the privilege of rice as one of the agricultural products and as a political product, of course, it is important to know the bid response when there are several variables that affect it, especially when there is a variable climate anomalies in it. To determine the effect of these factors it is necessary to test using a regression model. Table 1 shows the regression results of the rice supply function with ARMA method. Table 1. Result Of Rice Supply Regression
Variable Coefficient Value of Significant t
C 26,28665 0,0000***
Log of dry grain harvest prices (t-1) 0,56050 0,1952 ns
Log of corn prices(t-1) -1,41032 0,0075
***
Log of soybean prices(t-1) -1,57400 0,0001
***
Log of cassava prices(t-1) -2,17600 0,0000
***
Log of urea prices(t-1) -1,16953 0,0000
***
Log of TSP prices(t-1) -0,99232 0,0016
***
Log of average wage laborer(t-1) -1,98027 0,0000
***
Dummy of El Nino -0,09130 0,2631ns
Dummy of La Nina 0,17374 0,0928*
AR(3) 0,78460 0,0000***
MA(5) 0,95330 0,0000***
Adjusted R2 0,68274
Value of significant F 0,00000
Source : Secondary Data Analysis, Central Statistic Agency 1991-2011 Description
*** : significant at α = 1% * : significant at α = 10%
ns : not significant
In the coefficient of determination test, adjusted R2 value was seen at 0.6813. This means that 68.13% of rice offers explained by variable rates of dry grain harvest, corn prices, soybean prices, the price of cassava, urea fertilizer prices, fertilizer prices TSP, the average wages of agricultural laborers, dummy El Nino and La Nina, and AR (3) MA (5), while 31.87% is explained by other variables outside the model. F test results indicate that H0 is rejected (p < 0,05). This means that the variables altogether with dry grain
harvest prices, corn prices, soybean prices, cassava prices, urea fertilizer prices, TSP fertilizer prices, and average wages laborer respectively in period t - 1, dummy of El Nino, dummy of La Nina, AR (3), MA (5) significantly influence rice deals.
5.
Conclusion
26 prices, TSP fertilizer prices, average wages laborer, and dummy LaNina. Tocope withth eclimate anomalies such as El Nino and La Nina is necessary cooperation of various fields. In this case, the Meteorology and Geophysics Agency in each state can publish the value of Southern Os