Changes in soil properties and vegetation characteristics
along a forest-savanna gradient in southern Venezuela
Nelda Dezzeo
a,*
, Noemı´ Chaco´n
a, Elio Sanoja
b, Gabriel Pico´n
caCentro de Ecologı´a, Instituto Venezolano de Investigaciones Cientı´ficas, Apdo. 21.827, Caracas 1020-A, Venezuela bUniversidad Experimental de Guayana, Puerto Ordaz, Venezuela
cEstacio´n Cientı´fica de Parupa, CVG-Autoridad Gran Sabana, Puerto Ordaz, Venezuela
Received 13 May 2004; received in revised form 21 June 2004; accepted 21 June 2004
Abstract
Vegetation cover in the Gran Sabana highlands (southern Venezuela) appears as a complex mosaic of tall to low forests, bush vegetation and savannas. In this study we described the changes in structure and floristic composition along a forest-savanna gradient consisted of tall forest (TF), medium forest (MF), low forest (LF) and open savanna (S), and analyse the possible reasons for the observed changes. The results showed no obvious differences in the soils properties along the vegetation gradient. All sites presented shallow soils (<50 cm depth) with high percentage of sand and with dominance of quartz, kaolinite and
oxides of iron and aluminum. The soil chemical characteristics were unfavorable and similar along the vegetation gradient. The major soil difference was related with the presence of an organic layer on the soil surface of TF and MF and their absence on the soils of LF and S. Abundant residues of large trees were found on the forest floor of TF, MF and LF. These residues presented no signs of burning in TF, while in MF and particularly in LF were charred. This observation joined to the presence of charcoal within the mineral soil of S and the absence of the organic surface layer in LF and S indicated that fire has affected with different intensity or frequency the studied vegetation gradient. Large differences in the structure and floristic composition were found between TF, MF, LF and S. These differences could not be explained by changes in the mineralogical and chemical characteristics of the soil but only by fire which triggers the conversion. We concluded that the studied vegetation gradient represents stages in a temporal change from forest to savanna caused by fire, and this change has implied an impoverishment of tree species, a drastic reduction of biomass in terms of basal area, a drastic change of the floristic composition and the loss of the organic surface layer, which play an important role to maintain the fertility of these soils.
#2004 Elsevier B.V. All rights reserved.
Keywords:Forest degradation; Forest disturbance; Forest fires; Secondary forest; Soil nutrient pools; Organic litter; Root litter; Root mass; Tropical forest; Savannization
1. Introduction
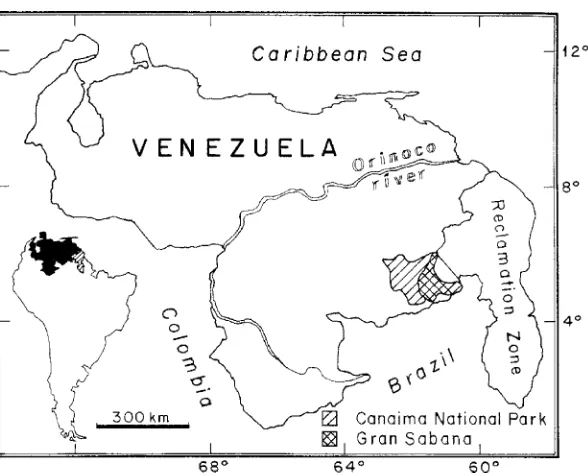
The Gran Sabana is a vast area of 18,000 km2 located in the Venezuelan Guayana highlands. This www.elsevier.com/locate/foreco
* Corresponding author. Tel.: +58 212 5041011; fax: +58 212 5041088.
E-mail address:ndzzeo@oikos.ivic.ve (N. Dezzeo).
0378-1127/$ – see front matter#2004 Elsevier B.V. All rights reserved.
region is characterized by diverse biological commu-nities renowned for their high levels of endemism (Berry et al., 1995). From a general climatic point of view, the Gran Sabana should be covered by montane evergreen forests (Huber, 1995). However, these forests occur predominantly as patches or islands surrounded by extensive areas of grassland, meadows and shrubland. With the exception of the meadows and some shrubland, associated with rather special soil conditions, the actual vegetation cover in the region represents a transitional stage in a long term process of savannization, which is originally triggered by fires, but is essentially conditioned by constant soil chemi-cal stress and episodic drought stress (Fo¨lster et al., 2001).
Strong acidification and nutrient impoverishment in the soils of the Gran Sabana forests cause shallow rooting depth and concentration of roots on the soil surface, making them susceptible to fire and drought (Fo¨lster, 1986). Fire is an important element into the culture of the indigenous Pemo´n people living in the area, who set fire for multiple purposes (Gala´n, 1984a). The fire used during the periodical burning of the savanna and during the slash and burn agricul-ture get out of control and escape into standing forests. Extensive forest fires have been observed in the Gran Sabana during unusually extremely dry years, like the ones reported byTate (1932)andRo¨hl (1948). Areas of savannas, secondary shrubland and fern fields with numerous large and still standing burned tree trunks evidence the savannization process, and14C dates of charcoal founds in the soils of forests and savannas (Fo¨lster, 1992) indicate that this process has been operating since several centuries.
The savannization process in the Gran Sabana may pass through several phases of woody regrowth, each containing less biomass; the process ends in a very open secondary bush or a bush savanna, which is turned into open savanna by fires originating from savannas (Fo¨lster, 1986, 1992; Fo¨lster and Dezzeo, 1994; Herna´ndez, 1999). Yet little is known about the ecological consequences resulting of the transforma-tion from forest to savanna in the Gran Sabana. The objectives of the present study were (1) to describe the changes in structure, species composition and soil properties along a vegetation gradient from high to low forest and savanna; and (2) to analyse if the observed variation can be explained by mineralogical
and chemical soil differences or represents stages in a temporal change caused by fire.
2. Methods
2.1. Study area
The Gran Sabana is located in the Canaima National Park, in southeastern Venezuela, between 048450–05
8300N and 60
8300–61
8220N (Fig. 1), forming
a plateau between 800 and 1500 m asl. The parent rocks consist of Precambrian sediments of the Ror-aima Group, an assemblage of formations consisting of quartzites and siliceous conglomerates, with inter-calated jasper, chert, siltstone, and arkose, and local intrusions of diabase (Schubert et al., 1986). The soils are in an advanced phase of weathering. They are characterized by low pH values, deficiency of basic cations, accumulation of acidic cations and low Ca/Al ratio in the soil solution (Dezzeo and Fo¨lster, 1994; Fo¨lster et al., 2001).
The climate of the study area has been classified as tropical very humid premontane, with mean annual precipitation between 2200 and 4000 mm and mean annual temperature between 17 and 248C (Gala´n, 1984b). According to the climatic diagram of the meteorological station of Kavanaye´n (1200 m asl, 34 years of records), a mean of 2548 mm of annual precipitation is distributed unevenly, with mean monthly rainfall 60 mm during the dry season (from December to March) (Herna´ndez, 1994).
high<14 m). According toHerna´ndez (1999) med-ium-high forests and medium forest are generally found in places where the transition from high to low forest occur, usually covering a reduced area.
2.2. Site selection
The study was carried out in a site located at 1300 m asl. In this site we selected an area of approximately 30 ha, which was covered by a vegetation gradient from forest to savanna consisted of: (i) tall forest (TF); (ii) medium forest (MF); (iii) low forest (LF); and (iv) savanna with few and scattered trees (S). At each vegetation type one rectangular plot of 10 m 100 m (0.1 ha) was delimited. It was used only a plot (unreplicated sampling), because it was very difficult to delimit more plots for each vegetation type presenting exactly the same characteristics. In order to make easier the soil and vegetation sampling, each delimited plot was divided into four subplots of 25 m10 m each one.
2.3. Organic surface layer and mineral soil proceeding
Organic layer at each vegetation type was destruc-tively sampled at nine regularly chosen points using a
metal frame of 20 cm20 cm. Each collected sample was weighed and separated into fine roots (<2 mm diameter) and litter (all detritus<1 cm diameter). Fine roots and litter were oven dried, weighed, milled and digested with a mixture of H2SO4–H2O2(according to Tiessen and Moir, 1993). The extracts were color-imetrically analyzed for total N and P with the Tech-nicon Auto-Analyzer. Ca, K and Mg were determined in the same extract by atomic-absorption spectropho-tometry. Total C was determined through complete combustion of the samples at 5008C for 8 h in a muffle furnace (Davies, 1974). Nutrient pools in fine roots and litter were calculated by multiplying the mass of each component by its corresponding nutrient concentration.
Soil samples were sieved to separate all roots <2 mm diameter, which were weighed and chemically analysed according to the procedures employed to the organic layer samples. Samples for soil chemical analyses were passed through a 2 mm soil sieve. Total C was determined by Walkley and Black (1934) method. Total N was measured following the Kjeldahl method (Jackson, 1976). Available P was extracted according toTiessen and Moir (1993), and then color-imetrically determined (Murphy and Riley, 1962). Exchangeable K, Mg, and Ca were determined by atomic-absorption spectrophotometry using 1 N ammonium acetate as extracting solution (Thomas, 1982). The pools of C, N, P, Ca, K and Mg in the soil were calculated by multiplying the mean elemental concentration at each depth by the corresponding mean soil bulk density value determined for each depth at each site.
Soil pH, exchangeable Al, texture and mineralogy were evaluated at each vegetation type by opening a soil profile in the central part of each 0.1 plot. Within each profile the boundaries of the soil horizons were identified, and of each horizon four soil samples were taken. The collected samples were air dried and passed through a 2 mm soil sieve. Soil pH was measured in 1 M KCl. Soil texture was determined by the hydro-meter method (Day, 1965). Exchangeable Al was extracted with 1 M KCl solution and determined by titration with NaOH (McLean, 1965). For X-ray dif-fraction analysis the soil samples were ground and sieved through a 100 mesh screen. The samples were X-rayed in the difractometer using Cu Ka radiation. Mean values and their standard deviation are provided throughout the presentation of similarities/differences in mass and elemental pools of the organic litter and mineral soil among vegetation types. Statistical dif-ferences were tested using one-way analysis of var-iance (ANOVA). ATukey honest significant difference (HSD) test was used when statistical differences (P<0.05) were observed.
2.4. Vegetation proceeding
Within each of the four delimited subplots per vegetation type, all plants with diameter breast height at 1.3 m (DBH)2.5 cm were counted and classified as live or dead, and the live were identified using local names. Total height and stem diameter of each single
tree were measured. For each local name samples for botanical identification were collected. Within each 0.1 ha plot, all plants with DBH < 2.5 cm were counted in 125 m2 and separated in dicotyledoneae and monocotyledoneae (Cronquist, 1981). To quantify and contrast the dominance of species with DBH 2.5 cm within and among the studied vegetation types, it was calculated the importance value index (IVI) for each 0.1 ha plot as the sum of the relative density (number of stems,D%), relative basal area (BA%) and relative occurrence of the species (frequency, F%) (Curtis and McIntosh, 1951). The IVI was calculated considering only live trees. The degree of floristic similarity within and between vegetation types was assessed using the Shannon–Wiener diversity index (Magurran, 1988). Statistical significance of floristic similarity indexes between vegetation types was assessed using at-test (Magurran, 1988).
3. Results and discussion
3.1. Soil properties
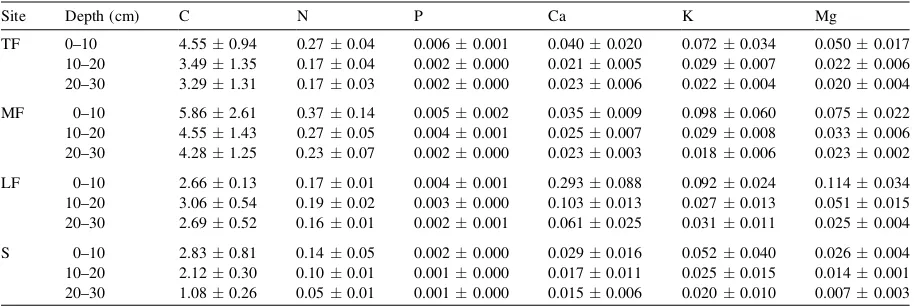
No obvious differences were observed in the mineral soil along the forest-savanna gradient. All soil profiles were shallow (<50 cm depth) and con-sisting of an A horizon on top of a C horizon. The sand content of all studied soils was high and ranged around 80% in the A horizon (Table 1). X-ray diffraction of the soil samples revealed only quartz and subordinate iron oxides and kaolinite. Soil acidity was character-ized by low pH (KCl), particularly in the A horizon. Exchangeable Al was high (Table 1), and the levels of K, Mg, P and with few exceptions Ca were very low (Table 2).
properties are comparable with the results reported by other sandy soils derived from the regionally dominant Roraima Group (Dezzeo et al., 1997).
The major difference between the soils of the vegetation gradient was related with the presence of a relatively thick organic surface layer on top of the soils of the tall and medium forests, and their absence on the soils of the low forest and the savanna (Table 3). This organic layer was characterized by a complex network of fine roots mixed with litter in various stages of decomposition. The fine root mass in the organic layer (41.1 Mg/ha in TF and 29.6 Mg/ha in MF,Table 3) was high in comparison with the mean value reported for other montane forests on more clayed soils in the study region (23.6 Mg/ha) (Dezzeo and Fo¨lster, 1994) and with the range of values
reported for Amazon lowland forests (13.8– 39.5 Mg/ha) (Klinge and Herrera, 1978).
The fine root mass was significantly lower (P < 0.05) within the mineral soil than in the organic surface layer (Table 3). Total fine roots mass in the first 30 cm of the soils (4.6–10.4 Mg/ha) was lower than the mean value reported for more clayed soils in other montane forests of the study region (12.5 Mg/ha; 0–30 cm soil depth) (Fo¨lster et al., 2001) and than the values of lowland soils in Amazon (14.7–39.5 Mg/ha; 0–30 cm soil depth) (Sanford, 1985). This lower fine root mass in mineral soil and the already mentioned higher amount of fine roots in the organic layer are consequence of the very low nutritional status of the sandy soils in the study region. High accumulation of roots on top of the soil surface has been considered an
Table 2
Element concentration in mineral soil along the forest-savanna gradient in the Gran Sabana
Site Depth (cm) C N P Ca K Mg
TF 0–10 4.550.94 0.270.04 0.0060.001 0.0400.020 0.0720.034 0.0500.017
10–20 3.491.35 0.170.04 0.0020.000 0.0210.005 0.0290.007 0.0220.006
20–30 3.291.31 0.170.03 0.0020.000 0.0230.006 0.0220.004 0.0200.004
MF 0–10 5.862.61 0.370.14 0.0050.002 0.0350.009 0.0980.060 0.0750.022
10–20 4.551.43 0.270.05 0.0040.001 0.0250.007 0.0290.008 0.0330.006
20–30 4.281.25 0.230.07 0.0020.000 0.0230.003 0.0180.006 0.0230.002
LF 0–10 2.660.13 0.170.01 0.0040.001 0.2930.088 0.0920.024 0.1140.034
10–20 3.060.54 0.190.02 0.0030.000 0.1030.013 0.0270.013 0.0510.015
20–30 2.690.52 0.160.01 0.0020.001 0.0610.025 0.0310.011 0.0250.004
S 0–10 2.830.81 0.140.05 0.0020.000 0.0290.016 0.0520.040 0.0260.004
10–20 2.120.30 0.100.01 0.0010.000 0.0170.011 0.0250.015 0.0140.001
20–30 1.080.26 0.050.01 0.0010.000 0.0150.006 0.0200.010 0.0070.003
C and N in (%), P in (mg/g), cations in (cmol/kg). TF: tall forest, MF: medium forest, LF: low forest, S: savanna. Table 1
Some characteristics of the soil profile along the forest-savanna gradient in the Gran Sabana
Site Horizon (cm) pH (KCl) Al (cmolc/kg) Silt (%) Clay (%) Sand (%) Mineralogy
TF A (0–45) 3.900.26 1.270.08 5.23.1 11.55.1 83.35.3 Q G ffi K>F
C (>45) 4.470.06 0.850.13 12.50.0 8.31.4 79.21.4 Q>K>G ffi F S
MF A (0–35) 3.550.25 1.490.21 4.02.0 8.52.0 87.54.1 Q G ffi K>F
C (>35) 4.410.15 0.950.09 2.30.5 7.11.5 90.61.3 Q>Kffi G>F>S
LF A (0–40) 4.120.23 1.170.32 12.34.4 11.08.9 76.78.1 Q K>G>S
C (>40) 4.330.06 0.800.10 14.39.9 16.89.9 68.725.7 Q>K>G ffi F>S
S A (0–35) 4.240.15 0.800.14 4.93.3 9.01.7 86.12.8 Q G>F>K
C (>35) 4.680.05 0.440.07 8.44.7 9.81.4 81.94.3 Q>Kffi G>F>S
important mechanism of nutrient conservation in for-ests growing on acidic and nutrient-poor soils (Herrera et al., 1978; Cuevas and Medina, 1988; Priess et al., 1999), and has been also related with Al toxicity within mineral soil (Fo¨lster, 1986). According to our results, the vegetation types that presented organic surface layer (TF, MF) showed considerably higher
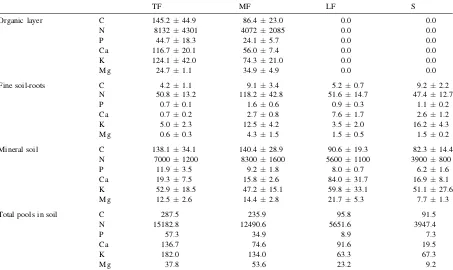
pools of C and nutrients than those that presented no organic layer (LF, S) (Table 4). In TF and MF, around 30–50% of the pools of C and N, and more than 65% of the pools of P, Ca, K and Mg were stored in the organic surface layer.
Another difference between the studied soils was related with the presence of abundant residues of large Table 3
Organic layer and fine roots (Mg/ha) in mineral soil along the forest-savanna gradient in the Gran Sabana
TF MF LF S
Organic surface layer Litter 185.783.3 a 110.633.3 a 0.0 0.0
Fine roots 41.124.7 a 1 29.619.2 a 1 0.0 0.0
Litter + fine roots 226.7104.3 a 139.743.8 a 0.0 0.0
Fine roots in mineral soil 0–10 cm 1.80.8 a 4.02.0 b 2.41.2 a 6.12.2 b
10–20 cm 2.11.1 a 3.81.4 b 1.40.7 a 3.20.9 b
20–30 cm 0.70.2 a 2.11.2 b 1.30.5 a 1.41.4 a
Total fine roots 4.61.3 a 2 10.23.8 b 2 5.60.9 a 10.42.6 b
Different letters in columns indicate significant differences between vegetation types. TF: tall forest, MF: medium forest, LF: low forest, S:
savanna. Different numbers in columns denote differences in the fine roots among organic litter and mineral soil (ANOVA,P<0.05).
Table 4
Pools of C (tonne/ha) and nutrients (kg/ha) in the organic layer (litter +fine roots), fine soil roots (0–30 cm) and mineral soil (0–30 cm) in the vegetation gradient in la Gran Sabana
TF MF LF S
Organic layer C 145.244.9 86.423.0 0.0 0.0
N 81324301 40722085 0.0 0.0
P 44.718.3 24.15.7 0.0 0.0
Ca 116.720.1 56.07.4 0.0 0.0
K 124.142.0 74.321.0 0.0 0.0
Mg 24.71.1 34.94.9 0.0 0.0
Fine soil-roots C 4.21.1 9.13.4 5.20.7 9.22.2
N 50.813.2 118.242.8 51.614.7 47.412.7
P 0.70.1 1.60.6 0.90.3 1.10.2
Ca 0.70.2 2.70.8 7.61.7 2.61.2
K 5.02.3 12.54.2 3.52.0 16.24.3
Mg 0.60.3 4.31.5 1.50.5 1.50.2
Mineral soil C 138.134.1 140.428.9 90.619.3 82.314.4
N 70001200 83001600 56001100 3900800
P 11.93.5 9.21.8 8.00.7 6.21.6
Ca 19.37.5 15.82.6 84.031.7 16.98.1
K 52.918.5 47.215.1 59.833.1 51.127.6
Mg 12.52.6 14.42.8 21.75.3 7.71.3
Total pools in soil C 287.5 235.9 95.8 91.5
N 15182.8 12490.6 5651.6 3947.4
P 57.3 34.9 8.9 7.3
Ca 136.7 74.6 91.6 19.5
K 182.0 134.0 63.3 67.3
Mg 37.8 53.6 23.2 9.2
fallen trees on the forest floor of TF, MF and LF, and their absence on the soils of S. These residues did not present signs of burning in TF, while in MF several of them were burned and in LF all of them were total charred. This observation together with the presence of charcoal pieces within the mineral soils of S, and the absence of the organic layer on the soils of LF and S indicate that fire has affected with different intensity and frequency the studied vegetation gradient. How-ever, our results about the soil chemical characteristics did not reflect the fire impact. It is known that fire changes the chemical parameters of soils as a result of the direct input of heat and ash (Ewel et al., 1981; Woodmansee and Wallach, 1981; Giovannini et al., 1988; Marafa and Chau, 1999). These changes become dissipated with the time because of leaching (Viro, 1974; Coutinho, 1982), and many of them even disappeared one year after the occurrence of fire (Marafa and Chau, 1999). The soil chemical similarity between the soils along the vegetation gradient indi-cate that fire did not occur recently, and therefore the probably changes in the soil properties due to the direct input of ash could be depleted from the burned vegetation in the following rainy seasons, when the ashes were washed away by runoff.
3.2. Structure and floristic composition along the vegetation gradient
Between TF, MF, LF and S drastic changes in stem density, basal area, species richness and floristic com-position were observed (Tables 5–7). These differ-ences were no directly related with the soil properties but seemed to be consequence of the fire impact on the vegetation cover. Although fire occurrence was no quantified, the results indicate that fire frequency
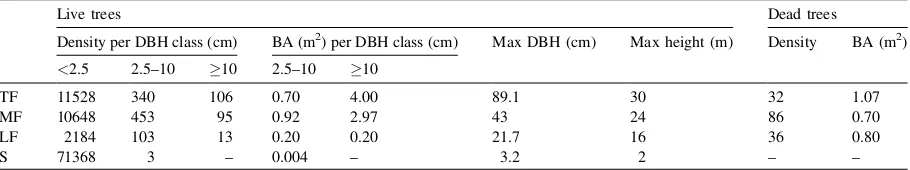
and intensity have been no spatially uniform in the study area. Under unburned condition, the forest (TF) showed values of stem density (1060 trees/ha) and basal area (40 m2/ha) (trees 10 cm DBH, Table 5) that are comparable with the mean values reported for primary montane forests growing on sandy soils (950 trees/ha and 38.7 m2/ha) (Dezzeo et al., 1997). This forest presented also high species richness (45 species in 0.1 ha,Table 6), which is comparable with the values reported for primary neotropical montane forests, excluding the Andean forests (40–65 species 2.5 cm in 0.1) (Gentry, 1995).
TF and MF showed no significant differences (P 0.9281) in the Shannon’s diversity index, and were also similar in term of species richness (number of species in the sampled area) (Table 6). However, these sites showed differences related with the forest struc-ture. The stem density of small trees (2.5–10 cm DBH) was 33% higher, the basal area 26% lower and the amount of dead standing trees 2.7 times higher in MF than in TF (Table 5). The similarity in the soil con-ditions between both forests (Tables 1 and 2) and the presence of burned trunks on the forest floor of MF suggest that the observed differences are conse-quences of the impact of fire in MF, which should has been of low intensity and probably of old date, because the organic surface layer in this site showed no signs of burning.
Vegetation structure and species richness were clearly different between TF and LF. Stem density, basal area and number of species (trees 2.5 cm DBH) were 74, 91 and 38% lower in LF than in TF (Tables 5 and 6). The number of plants in the herbac-eous stratum (<2.5 cm stem diameter) of LF was 5.4 and 4.8 times lower than those of TF and MF, respec-tively (Table 5). In LF the large and still standing
Table 5
Density and basal area (BA) of live and dead stem in 0.1 ha, and maximal (Max) DBH and height of the lived trees along the forest-savanna gradient in the Gran Sabana
Live trees Dead trees
Density per DBH class (cm) BA (m2) per DBH class (cm) Max DBH (cm) Max height (m) Density BA (m2)
<2.5 2.5–10 10 2.5–10 10
TF 11528 340 106 0.70 4.00 89.1 30 32 1.07
MF 10648 453 95 0.92 2.97 43 24 86 0.70
LF 2184 103 13 0.20 0.20 21.7 16 36 0.80
S 71368 3 – 0.004 – 3.2 2 – –
charred stumps represented 67% of the total basal area measured in this site (Table 5). The abundance of burned trunks on the forest floor and the absence of the organic surface layer in LF indicate that the fire impact in this site should be particularly dramatic. It is probably that the relative higher concentration of Ca in the soil of LF, in comparison with the other studied soils (Table 2), can be also associated with the fire impact on this forest.
Although LF showed lower species number than TF and MF, it presented the highest Shannon’s diver-sity index (Table 6). This index is based on the proportional abundance of species in the sampled area (Magurran, 1988). Therefore, the higher diversity value in LF indicates that the abundance of the species is better distributed in this forest than in TF and MF. The floristic composition (plants2.5 cm DBH) was different between the studied forests (Table 7).
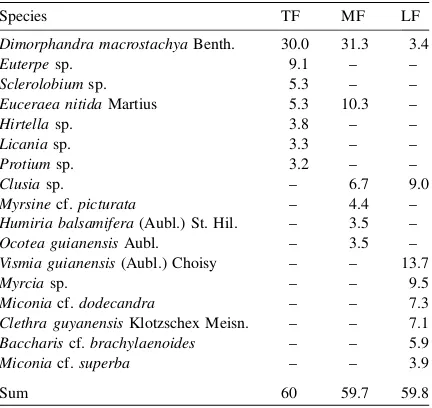
Dimor-phandra macrostachyashowed the highest IVI in TF
and MF, while in LF this species occupied a subordi-nate place. The dominant species in LF was Vismia
guianensis, a succesional species that was no present
in TF or MF. From the species that represented approximately 60% of the IVI, only Dimorphandra
macrostachyawas common in TF, MF and LF (Table
7), which indicates that the studied forests have low floristic affinity, probably because they have different succesional status. The dominance ofDimorphandra
has been reported for other montane and submontane forests of the Guayana Shield (Herna´ndez, 1992; Dezzeo and Huber, 1995), and has been associated with the opportunistic character of this species ( Her-na´ndez, 1999).
The vegetation in S was very different from that of TF, MF and LF. S showed only three trees of two species (Bonnetia sessilisBenth. andByrsonima
cras-sifoliaL.) in the diameter class 2.5–10 cm, while in the
herbaceous stratum the number of plants was consid-erably high (Tables 5 and 6). In this stratum, the abundance of species and individuals by life form changed from the forests to the savanna. The number Table 6
Number of species and diversity values for trees with DBH2.5 cm, and number of species and individuals of Monocotyledoneae (Monocots),
Dicotyledoneae (Dicots) and Ferns for plants with DBH<2.5 cm along the forest-savanna gradient in the Gran Sabana
TF MF LF S
Plants2.5 cm DBH in 0.1 ha
Number of species 45 47 28 2
Shannon’s index (H) 2.53 a 2.57 a 2.88 b 0.64 c
Evenness (E) 0.66 0.67 0.87 0.58
Plants<2.5 cm DBH in 125 m2
Number of species/individuals of Dicots 49/1394 47/1268 33/210 15/868
Number of species/individuals of Monocots 8/37 7/57 17/58 22/8052
Number of species/individuals of Fern 5/10 5/6 2/5 1/1
Total species/individuals 62/1441 59/1331 52/273 38/8921
TF: tall forest, MF: medium forest, LF: low forest, S: savanna. Values that share a common letter are not significantly different atP0.01.
Table 7
Importance value index (IVI) of the species that comprised around 60% of the IVI along the forest-savanna gradient in the Gran Sabana
Species TF MF LF
Dimorphandra macrostachyaBenth. 30.0 31.3 3.4
Euterpesp. 9.1 – –
Sclerolobiumsp. 5.3 – –
Euceraea nitidaMartius 5.3 10.3 –
Hirtellasp. 3.8 – –
Licaniasp. 3.3 – –
Protiumsp. 3.2 – –
Clusiasp. – 6.7 9.0
Myrsinecf.picturata – 4.4 –
Humiria balsamifera(Aubl.) St. Hil. – 3.5 –
Ocotea guianensisAubl. – 3.5 –
Vismia guianensis(Aubl.) Choisy – – 13.7
Myrciasp. – – 9.5
Miconiacf.dodecandra – – 7.3
Clethra guyanensisKlotzschex Meisn. – – 7.1
Bacchariscf.brachylaenoides – – 5.9
Miconiacf.superba – – 3.9
Sum 60 59.7 59.8
of Monocotyledonea species in the sampled area (125 m2) was similar between TF and MF (8 and 7 species, respectively), and increased to LF (17 spe-cies) and S (22 spespe-cies) (Table 6). In percentage terms, the abundance of individuals of Monocotyledonea species was similar between TF and MF (3 and 4% of the total individual, respectively), and increased to LF (21% of the total individuals) and S (90% of the total individuals) (Table 6). Several of the Monoco-tyledoneae present in S were also found in LF, parti-cularly species of Poaceae and Cyperacea. The fern
Pteridium aquilinum(L.) Kuhn was very abundant in
LF, but was not present in the other vegetation types. The very low number of plants in the herbaceous stratum of LF (Tables 5 and 6) can be associated with the abundance of Pteridium aquilinum, a broadly distributed weedy fern common in disturbed habitats (Watrud et al., 2003), which dense cover has been related with low regeneration rates of tree species (Rettenmaier and Fo¨lster, 1999). The frequent and persistent presence of Pteridium aquilinum in the transitional zones between forests and savannas has been associated with early succesional stages in soils with high content of humus (Hernandez, 1994). In LF, the high number of Monocotyledoneae species in the herbaceous stratum, the abundance of species typical from the savanna and the absence of the organic surface layer suggest that this forest type is in an advanced stage of savannization, probably due to the influence of repeated fires.
4. Conclusion
The results showed obvious differences in the structure and species composition along the forest-savanna gradient. However, these differences could not be associated with differences in the mineralogical and chemical characteristics of the soils, and suggest that the vegetation gradient represents stages in a temporal change from forest to savanna. Fire occur-rence appear to be the main factor triggering the replacement of tall and medium forests by low forest and savanna. This replacement implies an impover-ishment of tree species, a drastic reduction of biomass in terms of basal area, a drastic change of the floristic composition and the loss of the organic surface layer. The organic surface layer play an important role to
maintain the fertility of the soils in TF and MF, therefore their absence on the soils of LF and S is a critical factor determining the capacity of these vege-tation types to recover from fire disturbance. Finally, the data presented here confirms the savannization process actually occurring in the study region and their ecological consequences. In order to develop future strategies to restoration, management and conserva-tion of these forests, it is important to evaluate the possible exclusion of fire of the region as well as the natural regeneration dynamics process in unburned and burned forest.
Acknowledgements
This article is a contribution to the research project Atmosphere–Biosphere Interactions in the Gran Sabana, southern Venezuela. The work was supported by a grant of FONACIT, Venezuela (No. G-98001124). We thank Dr. H. Fo¨lster of the Go¨ttingen University for many helpful comments and critical review of earlier drafts of the manuscript.
References
Berry, P., Holst, B., Yatskievych, K., 1995. Introduction.In: Steyer-mark, J.A., Berry, P., Holst, B. (Eds.), 1995. Flora of the
Venezuelan Guayana, vol. 1. Missouri Botanical Garden,
USA, pp. xv–xx.
Coutinho, L.M., 1982. Ecological effects of fire in Brazilian Cerra-do.In: Huntley, B.J., Walker, B.H. (Eds.), 1982. Ecology of Tropical Savannas. Ecological Studies, vol. 42. Springer-Ver-lag, Berlin, Germany, pp. 273–291.
Cronquist, A., 1981. An Integrated System of Classification of Flowering Plants, Columbia University Press, New York. Curtis, J., McIntosh, R., 1951. An upland forest continuum in the
prairie-forest border region of Wisconsin. Ecology 32, 476–496. Cuevas, E., Medina, E., 1988. Nutrient dynamics within Amazonian forests: II. Fine root growth, nutrient availability, and leaf litter decomposition. Oecologia 76, 222–235.
Davies, B.E., 1974. Loss on ignition as an estimate of soil organic matter. Soil Sci. Soc. Am. Proc. 38, 150–151.
Day, P.R., 1965. Particle fractionation and particle size analysis.In: Black, C.A. (Ed.), Methods of Soils Analysis: Part 1. Agron-omy, vol. 9. pp. 545–567.
Dezzeo, N., Huber, O., 1995. Tipos de bosque sobre el Cerro Duida, Guayana Venezolana. In: Churchill, S.P., Balslev, H., Forero, E., Luteyn, J. (Eds.), Biodiversity and Conservation of Neotro-pical Montane Forests. New York Botanical Garden, Bronx, NY, USA, pp. 149–158.
Dezzeo, N., Herna´ndez, L., Fo¨lster, H., 1997. Canopy dieback in humid premontane forests of Alto Urima´n, Venezuelan Guayana. Plant Ecol. 132, 197–209.
Ewel, J., Berish, C., Brown, B., Price, N., Raich, J., 1981. Slash and burn impacts on a Costa Rican wet forest site. Ecology 62, 816–829.
Fo¨lster, H., 1986. Forest-savanna dynamics and desertification processes in the Gran Sabana. Interciencia 11, 311–316. Fo¨lster, H., 1992. Holocene autochthonous forest degradation in
southeast Venezuela. In: Goldammer, J.G. (Ed.), Tropical Forests in Transition. Birkha¨user-Verlag, Berlin, Germany, pp. 25–44.
Fo¨lster, H., 1994. Stability of forest ecosystems in the humid tropics. Interciencia 19, 291–296.
Fo¨lster, H., Dezzeo, N., 1994. La degradacio´n de la vegetacio´n.In: Dezzeo, N. (Ed.), Ecologı´a de la altiplanicie de la Gran Sabana (Guayana Venezolana): I. Investigaciones sobre la dina´mica bosque-sabana en el sector SE: subcuencas de los rı´os Yuruanı´, vol. 4. Arabopo´ y Alto Kukena´n, Scientia Guaianae, pp. 145– 186.
Fo¨lster, H., Dezzeo, N., Priess, J.A., 2001. Soil-vegetation relation-ship in base-deficient premontane moist forest-savanna mosaics of the Venezuelan Guayana. Geoderma 104, 95–113. Gala´n, C., 1984. La proteccio´n de la cuenca del Rı´o Caronı´.
CVG-EDELCA C.A., Divisio´n de Cuencas e Hidrologı´a, Caracas, 52 pp.
Gala´n, C., 1984. Memoria explicativa del mapa de zonas bioclima´-ticas de la cuenca del Rı´o Caronı´. CVG-EDELCA C.A., Divisio´n de Cuencas e Hidrologı´a, Caracas, 74 pp.
Gentry, A.H., 1995. Patterns of diversity and floristic composition in neotropical montane forest. In: Churchill, S.P., Balslev , H., Forero, E., Luteyn, J. (Eds.), Biodiversity and conservation of neotropical montane forests. New York Botanical Garden, Bronx, NY, USApp. 103–126.
Giovannini, G., Lucchesi, S., Giachetti, M., 1988. Effect of heating on some physical and chemical parameters related to soil aggregation and erodability. Soil Sci. 146, 255–261. Herna´ndez, L., 1992. Gliederung, Struktur und floristische
Zusam-mensetzung von Wa¨ldern und ihre Degradations und Regrada-tionsphasen im Guayana, Hochland, Venezuela. Go¨ttinger Beitra¨ge zur Land-und Forstwirtschaft der Tropen und Subtro-pen, vol. 70. Erich Goltze, Go¨ttingen.
Herna´ndez, L., 1994. Clima, hidrografı´a e hidrologı´a.In: Dezzeo, N. (Ed.), Ecologı´a de la altiplanicie de la Gran Sabana (Guayana Venezolana): I. Investigaciones sobre la dina´mica bosque-sabana en el sector SE: subcuencas de los rı´os Yuruanı´, vol. 4. Arabopo´ y Alto Kukena´n, Scientia Guaianae, pp. 25–44. Herna´ndez, L., 1999. Caracterizacio´n florı´stica de los bosques.In:
Herna´ndez, L. (Ed.), Ecologı´a de la altiplanicie de la Gran Sabana (Guayana Venezolana): II. Scientia Guaianae, vol. 9. pp. 53–83.
Herrera, R., Jordan, C.F., Klinge, H., Medina, E., 1978. Amazon ecosystems: their structure and functioning with particular emphasis on nutrients. Interciencia 3, 223–232.
Huber, O., 1994. Recent advances in the phytogeography of the Guayana Region, South America. Me´m. Soc. Bioge´ogr. IV (3), 53–63.
Huber, O., 1995. Vegetation.In: Steyermark, J.A., Berry, P., Holst, B. (Eds.), 1995. Flora of the Venezuelan Guayana, vol. 1. Missouri Botanical Garden, USA, pp. 97–160.
Jackson, M.L., 1976. Ana´lisis quı´mico de suelos, third ed. Editorial Omega, Barcelona.
Klinge, H., Herrera, R., 1978. Biomass studies in Amazon Caatinga forest in southern Venezuela: 1. Standing crop of composite root mass in selected stand. Tropical Ecol. 79, 93– 110.
Mackensen, J., Tillery-Stevens, M., Klinge, R., Fo¨lster, H., 2000. Site parameters, species composition, phytomass structure and element stores of a terra-firme forest in east-Amazonia, Brazil. Plant Ecol. 151, 101–119.
Magurran, A.E., 1988. Ecological Diversity and its Measurement, Princeton University Press, Princeton, NJ.
Marafa, L.M., Chau, K.C., 1999. Morphological and chemical properties of soils along a vegetation gradient affected by fire in Hong Kong. Soil Sci. 164, 683–691.
McLean, E.O., 1965. Aluminum. In: Black, C.A. (Ed.), Methods of Soil Analysis. Part 2. Agronomy 9, 985–994.
Murphy, J., Riley, J.P., 1962. A modified single solution method for the determination of phosphate in a natural waters. Anal. Chem. Acta 27, 31–36.
Priess, J.A., Fo¨lster, H., 2001. Microbial properties and soil respira-tion in submontane forests of Venezuelan Guayana: character-istics and response to fertilizer treatments. Soil Biol. Biochem. 33, 503–509.
Priess, J.A., Then, Ch., Fo¨lster, H., 1999. Litter and fine-root production in three types of tropical premontane rain forest in SE Venezuela. Plant Ecol. 143, 171–187.
Rettenmaier, R., Fo¨lster, H., 1999. Dina´mica de la regeneracio´n natural.In: Herna´ndez, L. (Ed.), Ecologı´a de la altiplanicie de la Gran Sabana (Guayana Venezolana): II. Scientia Guaianae, vol. 9. pp. 108–125.
Ro¨hl, E., 1948. Los veranos ruinosos de Venezuela Boletı´n de la Academia de Ciencias Fı´sicas. Matema´ticas y Naturales 31, 1–23.
Sanford Jr., R.L., 1985. Root ecology of mature and successional Amazon forests. Ph.D. thesis, University of California, Berkeley, California, USA.
Schubert, C., Bricen˜o, H., Fritz, P., 1986. Paleoenvironmental aspects of the Caronı´-Paragua river basin (Southeastern Vene-zuela). Interciencia 11, 278–289.
Tate, G.H.H., 1932. Life zones at Mount Roraima. Ecology 13, 235–257.
Thomas, G.W., 1982. Exchangeable cations. In: Page, A.L., Miller, R.H., Keeny, D.R. (Eds.), Methods of Soil Analysis. Part 1. Agronomy 9, 159–166.
Viro, P.J., 1974. Effects of forest fire on soil. In: Kozlowski, T.T., Ahlgren, C.E. (Eds.), Fire and Ecosystems. Academic Press, New York, pp. 7–45.
Walkley, A., Black, I.A., 1934. An examination of the Degtjareff method for determining soil organic matter and a proposed modification of the chromic acid titration method. Soil Sci. 37, 29–38.
Watrud, L.S., Maggard, S., Shiroyama, T., Coleman, C.G., Johnson, M.G., Donegan, K.K., Di Giovanni, G., Porteous, L.A.,
Lee, E.H., 2003. Bracken (Pteridium aquilinum L.) frond
biomass and rhizosphere microbial community
charac-teristics are correlated to edaphic factors. Plant Soil 249, 359–371.