Volume 27, Number 3, 2012, 315 – 335
PRIVATE INFORMATION ARRIVAL AT INDONESIA
STOCK EXCHANGE, REALITY OR IMAGINARY?
U-SHAPED RETURN VARIANCE CURVE
VERIFICATION
1Setiyono Mihardjo
Faculty of Economics and Business Universitas Gadjah Mada
Sumiyana
Faculty of Economics and Business Universitas Gadjah Mada
ABSTRACT
This research investigates occurrence of private information arrival in Indonesia Stock Exchange (IDX). The occurrence comes from overnight nontrading session as well as lunch-break hour. Lunch-break return variance decreases two times in comparison with early morning and lately afternoon return variances. This variance is due to private information arrival. This study finds that opening prices form the full day U-shape. It means that opening price causes stock mispricing. It also be concluded that lunch-break session produces the bottom line on the U-shape to move downward. U-shaped curve during morning until the end-afternoon session occurs. Therefore, the line formation implies the existence of private information arrival that is in short-lived.
Keywords: U-shaped curve, private and public information
INTRODUCTION
This1 study investigates a permanent re-search question “why does return volatility increase during every early morning and late afternoon trading?” Some previous research has tried many times to answer the questions which end up in price formation theory (French & Roll, 1986; Harris, 1986; Wood, Mcnish & Ord, 1985; Jain & Joh, 1988; Mcnish & Ord, 1990; Amihud & Mendelson,
1 This paper had been presented in The 9th Annual
Conference of the Asian Academic Accounting Association, Kadir Has University, Istanbul, Turkey. We have considerated all suggestions from this conference.
stock prices. Additionally, pricing error is observed with very low probability. Therefore, the main cause of high return volatility is only private information.
The examination of private information phenomenon which occurs especially in Indo-nesia Stock Exchange, herein after IDX, is conducted in series formulation of U-shaped. The U-shaped curve illustrates the distribution of return variance over certain period of time. The U-shaped curve consists of three parts, the descending line, the bottom line, and the as-cending line. The early part of desas-cending line represents return variance during morning. However, this line will flatten until lunch break. The rising return variance over after-noon is caused day-end effect phenomenon and makes the ascending line (Cheung, 1995; Jain & Joh, 1988; Ho & Cheung, 1991).
The existence of U-shaped induces that return variance during lunch break is lower than all return variance during morning and afternoon session. If the IDX also has that kind of return variance movement, it can be concluded that information dissemination during trading is correct and valid (Amihud & Mendelson, 1991; Ito & Lin, 1992). The reasons are the pressure of morning sessions as a result of private information accepted previously by investors. The trading pressure also drives the high return volatility during morning session (Ito et al. 1998). Frino & Hill (2001) and Balduzzi et al. (2001). The analysis of price volatility, trading volume, and bid-ask spreads indicates that adjustment against new information occurs very quickly, within 240 seconds. Therefore, to analyze pri-vate information arrival we use intraday data.
This study has prime contribution to de-tect the phenomenon of private information arrival in IDX. This phenomenon becomes extremely important due to various condition of stock market, especially emerging stock market compared to advanced stock market. As far as we know, this study is the first Indo-nesian research using intraday data from IDX.
This study, therefore, implies that investors and potential investors in IDX should re-ana-lyze current and future investment and invest-ment decision. The acquired information is in form of stock price variability behavior during trading periods in IDX related to timing of sell-buy strategy. Another benefit is return information reliability during trading period in relation with the timing of investment decision taken by the investors and potential investors. Shortly, this research examines the dissimilar-ity of return distribution during some intervals within one day.
This study assumes that stock price be-haviors between advanced capital market and emerging capital market are equal. We main-tain this assumption because factors affecting return volatility behaviors in emerging capital market are the same as in advanced capital market. Furthermore, what we focused to ex-amine U-shaped form would be identified more clearly because of the following reasons.
First, in emerging markets there might be in-formation leakage indicating the existence of insider trading (Dvoraks, 2005). Second, in-vestors in emerging markets are accustomed to high price volatility so that they do not intelli-gently respond to good news, unlike investors in advance markets (Dvoraks, 2005). Finally, the magnitude of price fluctuations in emerg-ing markets might be greater than that in ad-vanced markets because stock prices might not reflect firms’ fundamental values (Bhattacharya et al., 2000). This study also assumes that information arrives at capital market regardless of the signal from the com-pany. This assumption makes this study purely finance in nature, and not accounting instead.
LITERATURE REVIEWS AND HYPOTHESES DEVELOPMENT
Information, Volatility and Trading Period
Fama (1970; 1991) stated that stock price reflects all available information, including previous price, public information and private information. Private information is rarely oc-curred and only affects the price through trading by informed investors, which usually do trading based on investor’s information for more than one day (Fama, 1991). Public in-formation is inin-formation recognized at the same time it affect the price, before the inves-tors are able to use it as trading decision strat-egy (French & Roll, 1986; Berry & Howe, 1994). Public information is presented for all investors, but evaluated differently by inves-tors who have different beliefs (Barron, 1995; Odean, 1998). Informed only do trading when new information available, such as future cash flows or other variables such as wealth, pref-erences, and investment opportunities. The investor’s reaction against information occurs when the information arrives. The reaction causes price change that reflects the expected risks and investors acquirement (Berry & Howe, 1994).
Pritamani & Singal (2001) examined public information arrivals which are proxied by volume increase and price change. Grundy & Kim (2002) states that rank of information heterogeneity affects the increase of price variability, and subsequently contribute to price fluctuations. Suhaibani & Kryzanowski (2000) examined the information contents of new bids in Saudi Stock Market (SSM). The new bids which are greater and more aggres-sive are caused by information arrivals. The relative measurement of bids information im-plies that private information is dominant fac-tors in stock trading decisions. Therefore, pri-vate information also affects price volatility.
Berry & Howe (1994) stated that investors react against new information arrival that is reflected in expected risks and acquired return.
Public information is responded longer in overnight periods than morning and afternoon session. Therefore, return volatility is hy-pothesized higher during nontrading than during trading. Furthermore, Amihud & Mendelson (1991) and Huang et al. (2000) proved empirically that return volatility is higher during trading caused by private infor-mation arrival. Private inforinfor-mation is dissemi-nated during trading by the informed traders, and it is hypothesized that return during trad-ing is higher than durtrad-ing nontradtrad-ing.
Examination Stage and Hypothesis
This study focuses on examining the ex-istence of private information based on U-shaped formula. This formula is trading model which believe to private information arrival. Essentially, this formula explains corrected price variance during the early morning ses-sion (Wood et al. 1985; Harris, 1986; Andersen & Bollerslev, 1997; Admati & Pfleiderer, 1988; Foster & Vismanathan, 1990; Slezak, 1994). Private information refers to information that meet two criteria, namely not in form of publicly known and always related to price (Ito & Lin, 1992; Ito et al. 1998). Meanwhile, French & Roll (1986) define that private information is correctly identifiable because it is related to price momentarily.
The volatility returns form U-shaped pat-tern, in which the highest volatility return is at the opening and closing session of the market (Chan et al. 1995). The occurrence of high volatility at the opening and closing prices in capital market is also suggested by Wood et al. (1985) who examine intraday stock returns. The high volatility can be caused by the noise occurrences (Steeley & Steeley, 2001).
comparing opening and closing return vari-ance. When this ratio is greater than one, this indicates private information arrival. In-versely, if the comparison value is equal to one, this can be considered as public informa-tion arrival, which means that return variance does not change over the period. Therefore, return volatility during lunch break can be hypothesized as follows.
H1: Return volatility can be detected during lunch break in IDX.
Test: C 1 ing (O) lunch break (L) return variances.
Second stage, this study analyze the dis-similarity of private information arrival by examining the change of return volatility dur-ing morndur-ing and afternoon sessions. This stage conducts to assign model exposed by Admati and Pfleiderer (1988). The research suggests that if a number of private information did not change while the trading drives the change, private information should not cause price change whose return is not distributed during morning until afternoon. In fact, private in-formation always drives price change which ends up in return distribution all day long. Therefore, this study deduces that return dis-tribution occurs due to private information captured during trading.
H2: The return volatility follows a U-shaped curve decreasing until lunch break and in-creasing after the lunch break.
Test: O
With additional notes from previous test, O
M
V
andV
MC are return variance during the opening and closing of morning session, and M (morning), and A (afternoon).The prediction of private information arrival can be done by cutting off the trading during morning session for the first four hours. In other words, the trading is limited until lunch break. This cutting off is based on logical framework recommended by Ito et al.
(1998). This research suggested that −if not limited during lunch break− bottom line of U-shaped curve flattens. It means that U-U-shaped during one full day is not confirmed (Slezak, 1994). U-shaped framework in morning session cutting off can be hypothesized as follows.
H3: Return volatility during early morning is moving downward sharply, and then turn the slightly flattened during mid morning, and finally become more flattened during late morning.
Test: C 1
With additional notes from previous tests, O
EM
V
, and others are return variances during the opening or closing price at early (E), mid (M), and late (L) morning session.delay their transaction which enlarges return variance during morning session (Foster & Viswanathan, 1990). Such characteristic refers to private information model, that private information hypothesis occurs during short term.
H4: Opening morning return variance is greater than opening afternoon, and closing morning return variance is less than closing afternoon.
Test: 1
O A
O M
V V
and 1
C M C A
V V
,
or 1
C A
C M O A
O M
V V V V
RESEARCH METHOD
Sample, Return and Trading Session
The sample is companies listed in LQ45 index during either first or second semester of
2006-2007. LQ45 selection is based on reasons that are able to minimize sleeping stocks during the trading day. The sleeping stock can affect internal and conclusion validity of this study. This method is used because IDX is thin market marked by lots of sleeping stocks. Opening and closing return for each 30 minutes interval lay in trading day which acquired from intraday data. Return is calculated by natural logarithm of relative price Ri,30’m,(t) =ln(Pi,30’m,(t)/Pi,30’m-1,(t)) where i is
firm, m is minute and t is day for each firm. To calculate 30 minutes interval return, companies’ trading data is divided into 12 intervals, and the formulation is as follows.
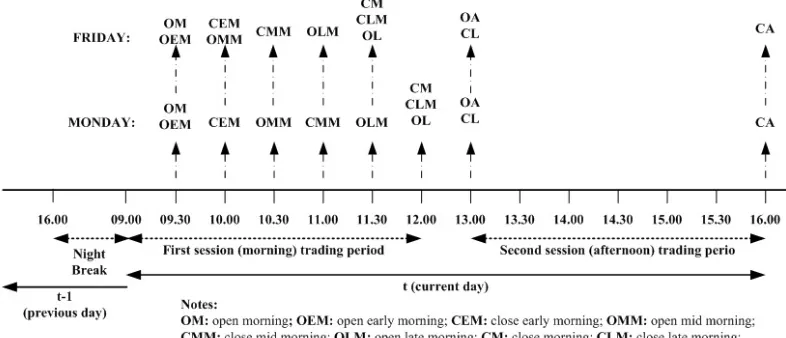
Trading session is not equal during each day. Trading is opened at 09.00 every day, but the first session is closed at 12.00 on Monday until Thursday, while on Friday the first session is closed at 11.30. The second session is opened at 13.30 on Monday until Thursday, while on Friday the second session is opened at 14.00. The second session is closed at 16.00 every day. Figure 1 shows trading day and trading period along with their relation with hypotheses examination in this research.
Data Analysis
Data analysis has following procedural steps. First, from intra-day data, 12 series of price was obtained that is price within 30 min-utes interval. This 30 minmin-utes interval price was used to calculate return. Then, calculating return by Ri,30’m,(t)=ln(Pi,30’m,(t)/Pi,30’m-1,(t), which
is return within minute interval from the first until twelfth. Opening return was calculated by ln(Pi,09.30(t) /Pi,16.00(t-1)), and forming 12 series
of 30 minutes interval return from Monday until Friday. The analysis in this examination is only focused to differentiate the return in one 30 minutes interval from other returns of 30 minutes interval.
Second, eliminating the days around divi-dend announcement, stock dividivi-dend, stock split and other firms’ specific news an-nouncements during the day between t-3 and
t+3. Firms’ specific information, unlike public
and market related information, cause high price fluctuation, and may compromise con-clusion validity. Third, identifying and then calculating all variances related to time sepa-ration as described in figure 1. Fourth, con-ducting sensitivity test using firm size, trading volume, and bid-ask spread. Sensitivity test by firm size serves to verify the consistency of previous hypotheses examination. Fama and French (1992) suggests that size influences return more consistently. Admati & Pflederer (1988) argue that the average of trading vol-ume forms a “U” pattern. It means that trading periods with high trading volume tend to have high return variability. Easley & O’Hara (1987) and Stoll (1989) suggested that the highly traded stock has smaller risk than the rarely traded stock as a result of information arrivals. Therefore, we consider that this sen-sitivity test is necessary to enhance the analy-sis.
RESULTS
Descriptive Statistics
The descriptive statistics shows highly varied 30 minutes interval data during 2006.
Table 1.a shows that the magnitude of mean of return 30 minutes interval with the lowest number during the period from previous day closing until the following 09.30 at -0.00093. This lowest mean is at the beginning of 30 minutes interval. Meanwhile, the highest mean of return is during 09.30-10.00 that is 0.0005 and during 15.30-16.00 that is 0.00424.
It illustrates that the highest mean is within the earliest 30 minutes interval during early morning session and within late trading day. This condition serves as the evidence that the return is surging compared to the previous 30 minutes interval. Meanwhile, the number of observations for the first 30 minutes interval is 10,845 and from this sum, only 9,956 are us-able or 889 are excluded. This exclusion is caused by lack of transaction during this inter-val causing no price differences or no return. This explanation is applicable for the rest dis-cussion.
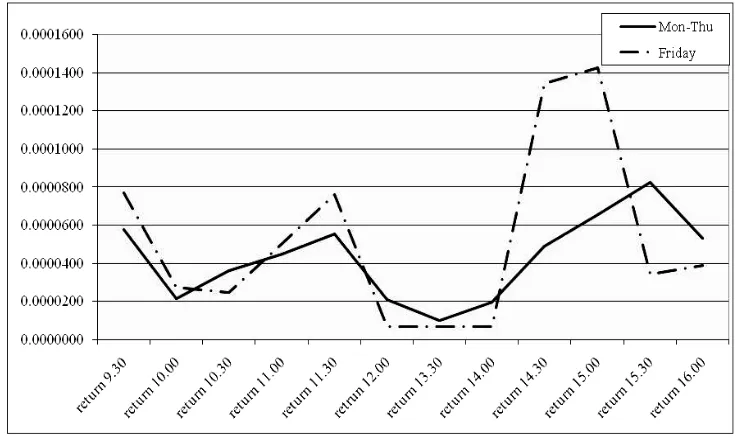
The standard deviation of each 30 minutes interval varies in relatively equal number. For 30 minutes interval 15.30-16.00 is 0.00708. The minimum value, and maximum value, is presented following the standard deviation column. For instance, minimum value for the last 30 minutes interval during trading day (return of 15.30-16.00) is -0.03, the maximum value is 0.04 and the range between minimum value and maximum value is 0.07. The high return during 09.30-10.00 and 15.30-16.00 along with the day-end effect presented graphically in Figure 2.
sig-nificant afterward, then become positively significant again during interval 15.30-16.00.
We concluded that the result from this test confirms the U-shaped graphical test.
Table 1.a. Descriptive Statistics
N($) N(and) Mean Std. Dev. Min. Max.
return 09.30 10,845 9,956 -0.0009 0.0182 -0.7000 0.3900 return 10.00 10,890 10,067 0.0005 0.0153 -0.5100 0.1200 return 10.30 10,890 9,202 -0.0006 0.0272 -1.3900 0.5100 return 11.00 10,890 8,661 0.0004 0.0312 -0.8500 1.4000 return 11.30 10,890 8,329 0.0000 0.0275 -0.7600 0.8400 retrun 12.00 8,820 6,483 0.0004 0.0180 -0.3700 0.5300 return 13.30 8,820 6,694 -0.0005 0.0189 -0.9700 0.3400 return 14.00 10,890 9,415 -0.0004 0.0202 -0.4100 1.0100 return 14.30 10,890 8,700 -0.0004 0.0361 -1.3900 0.8800 return 15.00 10,890 8,478 -0.0005 0.0398 -1.1200 1.3900 return 15.30 10,890 8,820 -0.0003 0.0361 -0.7900 1.1200 return 16.00 10,890 9,768 0.0042 0.0285 -0.7600 0.8300 return 09.30(t+1) 10,845 9,956 -0.0009 0.0182 -0.7000 0.3900
Notes: N($): Number of Observations; N(and): Number of included case
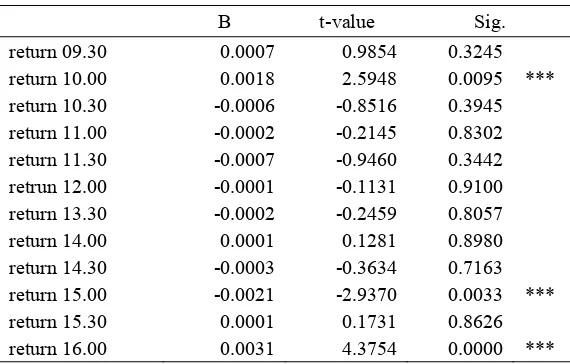
Table 1.b. Correlation and Stationary Tests
B t-value Sig.
return 09.30 0.0007 0.9854 0.3245 return 10.00 0.0018 2.5948 0.0095 *** return 10.30 -0.0006 -0.8516 0.3945 return 11.00 -0.0002 -0.2145 0.8302 return 11.30 -0.0007 -0.9460 0.3442 retrun 12.00 -0.0001 -0.1131 0.9100 return 13.30 -0.0002 -0.2459 0.8057 return 14.00 0.0001 0.1281 0.8980 return 14.30 -0.0003 -0.3634 0.7163 return 15.00 -0.0021 -2.9370 0.0033 *** return 15.30 0.0001 0.1731 0.8626 return 16.00 0.0031 4.3754 0.0000 ***
First Stage Examination Result
Hypothesis H1 can also be interpreted that return variance during opening of lunch break session is greater than during the closing. This stage examines the whole sample using the period of three first months within year of ob-servation, cumulative six months, cumulative nine months, and cumulative twelve months periods. The result shows that ratio between return variance of the opening lunch break session and that of the closing is greater than one.
Table 2. Examination for hypothesis H1
Sample period C 1 L
O L
V V
3 months 6 months 9 months 12 months
2.8227 2.7869 2.7681 3.3111 calc-t 14.7710***
Notes: * significant at level of 10%; ** significant at level of 5%; *** significant at of level 1%
Table 2 shows that all ratios return vari-ance between during lunch break opening and during lunch break closing are greater than one. These ratios are in detail within a range
between 2.7 and 3.3. Tested by means com-parison, the results show significant result, with t-value (sig.) equals to 14.7710 (0.000). This result supports H1. Therefore, we con-clude that return variance during lunch break is probably caused by private information arri-val (French & Roll, 1986, and Ito et al., 1998). Second Stage Examination Result
This second stage investigates further evi-dence of private information arrival at IDX. It deepens the proof of morning U-shaped curve. This second stage is also conducted in the same way as the first one. Table 3 shows in detailed result from all samples.
Table 3. Examination for hypothesis H2
Sample
period MO
O L C M C L
V V V V
O A
O L C A
C L
V V V V
3 months 6 months 9 months 12 months
2.5207 1.1312 0.9765 1.6900
4.5221 5.7585 6.7213 17.5736
calc-t 1.6600 2.5390*
Table 3 shows that return variances during opening morning and afternoon are greater than the closing return variances during after-noon and lunch break. The result shows that all ratios are greater than one, which in details are in a range between 1.13 until 17.57, except for the third row that is 0.97. These ratios ex-amined by one sample mean comparison test show insignificant difference with t-value (sig.) that equals to 1.660 (0.195). However, tests using one lag show significant results, t-value equals to 2.593 (0.085). It supports H2. This result indicates that high return variance during opening lunch break caused by private information arrival. Therefore, return variance during closing afternoon is greater than during opening and closing lunch break, and during afternoon. Therefore, we conclude that bottom line in U-shaped curve is the lowest return variance compared to all return variance within full day (French and Roll, 1986; and Ito
et al. 1998). This finding supports private in-formation arrival in IDX as stated in H1.
The second stage is continued with H3 ex-amination. The test is limited until return vari-ance during lunch break in order to be able to form U-shaped curve. This hypothesis has simple reason that if U-shaped is confirmed by morning return then one day U-shaped curve may be examined. The detailed result of H3 is presented in Table 4 as follows.
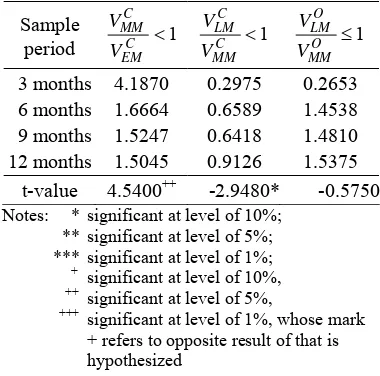
Table 4 confirms that closing return vari-ance during mid morning is greater than clos-ing early mornclos-ing session. Therefore, the sec-ond column of Table 4 shows that the ratio of closing return variances is less than one, which confirms that was hypothesized. Furthermore, the ratio, when examined by one sample mean comparison test using one lag shows significant difference, with tvalue (sig.) equals to -2.948 (0.060). The similar result is also shown in the third column, although one sample mean comparison test using one lag shows insignifi-cant difference. In fact, the first column is big-ger than the second column. Therefore, this study concludes that return variance at IDX
does support the validity of morning U-shaped curve (French and Roll, 1986; Ito et al. 1998).
Table 4. The examination for hypothesis H3
Sample t-value 4.5400++ -2.9480* -0.5750
Notes: * significant at level of 10%; ** significant at level of 5%; *** significant at level of 1%; + significant at level of 10%,
++
significant at level of 5%,
+++ significant at level of 1%, whose mark
+ refers to opposite result of that is hypothesized
The second stage is sharpened by H4 ex-amination. Table 5 induces that hypothesis H4 is supported. Return variance ratios are greater than one, with the lowest ratio is 1.794 and the highest one is 10.3987. One sample mean comparison tests result significant difference, with t-value (sig.) equals to 2.810 (0.067). The conclusion is the confirmation of private in-formation arrival which always related to price
Table 5. The examination for hypothesis H4
Sample period 1
and the arrival occurs within one trading day only or does not influence the next trading day (French & Roll, 1986; Foster & Viswanathan, 1990; Kyle, 1995; and Ito et al. 1998). Such examination result can also be interpreted as in accordance with hypotheses H1 and H2.
Sensitivity tests by firm size
To perform sensitivity test, this research divides firm size into five categories from the smallest to the biggest ones. The detailed examination result is presented in Table 6 as follows.
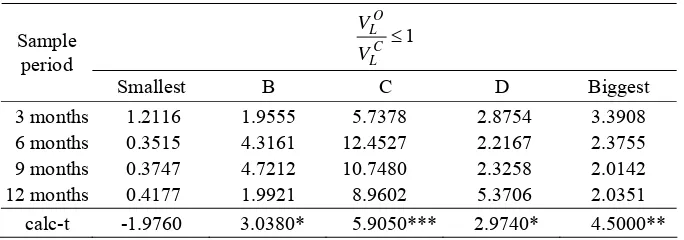
Table 6 shows that ratio between opening and closing return variance during lunch break is greater than one for almost all firm size, except the smallest one. One sample mean comparison test with one lag shows that firm size categories those are not the smallest ones (B group or above) have significant difference, with t-values (sig.), consecutively, 3.038 (0.056), 5.905 (0.010), 2.974 (0.059), and 4.5 (0.020). Hypothesis H1 is re-supported which means that opening return variance compared to closing during lunch break is caused by private information (French & Roll, 1986 and Ito et al. 1998). Additionally, medium to big firm size tend to capture private information at IDX. The sensitivity test for H2 shows consistent results with previous H2 examination. The opening return variance
during early morning session compared to during lunch break or during around lunch break is greater than one.
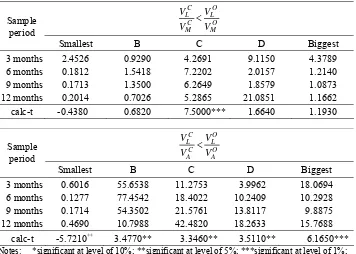
Table 7 shows that the first ratio is proven greater than one for medium firm size. Exami-nation using one sample mean comparison test with one lag results significant difference with t-value (sig.) that equals to 7.500 (0.005). Meanwhile, the ratio of second return variance is also proven greater than one from the smallest until the biggest firm size. The statistics examination shows t-value with significance level of 5% and 10%. Therefore, this study concludes that all ratios are greater than one, then the bottom line of U-shaped curve is the lowest return variance compared to all within one day.
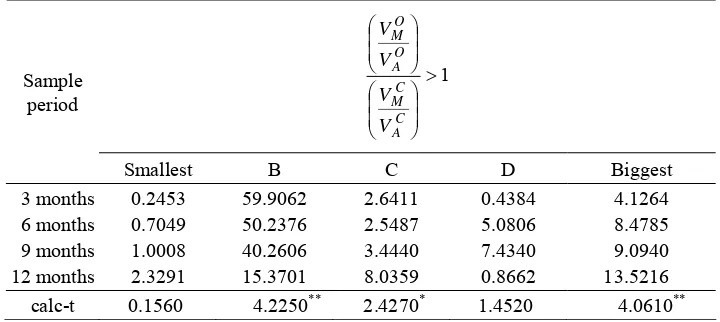
Table 8 shows a notably interesting result. Except medium firm size (column C), all other three ratios examined for H3 are supported. The results show that for all firm size, except medium firm size, the first return variance ratio support H3, because return variance during early morning is bigger than during closing mid-morning, and return variance during closing mid-morning is greater than closing late morning, or C
MM C LM C
EM C MM
V V V
V
. This means that return variance at IDX support the validity of U-shaped curve formulation.
Table 6. The sensitivity tests by firm size (hypothesis H1)
1
C L
O L
V V
Sample period
Smallest B C D Biggest
3 months 6 months 9 months 12 months
1.2116 0.3515 0.3747 0.4177
1.9555 4.3161 4.7212 1.9921
5.7378 12.4527 10.7480 8.9602
2.8754 2.2167 2.3258 5.3706
3.3908 2.3755 2.0142 2.0351 calc-t -1.9760 3.0380* 5.9050*** 2.9740* 4.5000**
Table 7. The sensitivity tests for firm size (hypothesis H2)
Notes: *significant at level of 10%; **significant at level of 5%; ***significant at level of 1%; +significant at level of 10%, ++significant at level at 5%,
+++significant at level of 1%, whose mark + refers to opposite result of that is hypothesized
Table 8. The sensitivity tests by firm size (hypothesis H3)
1
Notes: *significant at level of 10%; **significant at level of 5%; ***significant at level of 1%; +significant at level of 10%, ++significant at level at 5%,
+++significant at level of 1%, whose mark + refers to opposite result of that is hypothesized
The re-enhancement by H4 examination shows that private information arrival is re-vealed during short term trading if ratio of opening return variance is less then ratio of closing return variance outside lunch break or if the descending line of U-shaped curve is formed. Table 9 induces that hypothesis H4 is re-supported. It means that all examined return variance ratios are greater than one. These ratios with one lag result is significant differ-ence, with t-values (sig.) that equal to 4.225 (0.024) for the smallest (column B), 2.427 (0.094) for medium, and 4.061 (0.027) for the biggest firm size. This study concludes that private information arrival does not influence stock price in the next trading day (French &
Roll, 1986; Foster & Viswanathan, 1990; Kyle, 1995; and Ito et al., 1998).
Sensitivity tests by trading volume
Similar to sensitivity tests by firm size reasoning, sensitivity tests by trading volume is also aimed to ensure the consistent results. All examinations show results which do not too far in comparison with the result of firm size sensitivity tests. Considering that on sen-sitivity tests by firm size, hypothesis H1, H2, and H4 are re-supported, while H3 is not sup-ported. Therefore, this research concludes that results of trading volume examination are con-sistent with the previous results.
Table 9. The sensitivity tests by firm size (hypothesis H4)
1
Table 10. The sensitivity tests by trading volume (hypothesis H1)
+++significant at level of 1%, whose mark + refers to opposite result of that is hypothesized
Table 11. The sensitivity tests by trading volume (hypothesis H2)
O
Notes: *significant at level of 10%; **significant at level of 5%; ***significant at level of 1%; +significant at level of 10%, ++significant at level at 5%,
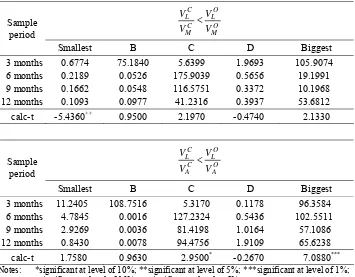
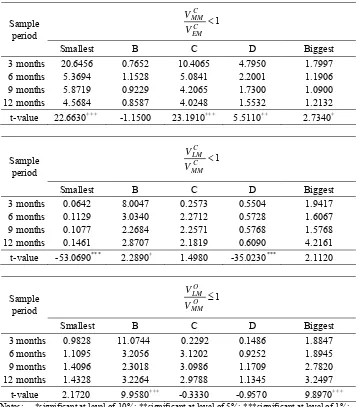
Table 12. The sensitivity tests by trading volume (hypothesis H3)
1
C EM C MM
V V
Sample period
Smallest B C D Biggest
3 months 6 months 9 months 12 months
20.6456 5.3694 5.8719 4.5684
0.7652 1.1528 0.9229 0.8587
10.4065 5.0841 4.2065 4.0248
4.7950 2.2001 1.7300 1.5532
1.7997 1.1906 1.0900 1.2132 t-value 22.6630+++ -1.1500 23.1910+++ 5.5110++ 2.7340+
1
C MM
C LM
V V
Sample period
Smallest B C D Biggest
3 months 6 months 9 months 12 months
0.0642 0.1129 0.1077 0.1461
8.0047 3.0340 2.2684 2.8707
0.2573 2.2712 2.2571 2.1819
0.5504 0.5728 0.5768 0.6090
1.9417 1.6067 1.5768 4.2161 t-value -53.0690*** 2.2890+ 1.4980 -35.0230*** 2.1120
1
O MM
O LM
V V
Sample period
Smallest B C D Biggest
3 months 6 months 9 months 12 months
0.9828 1.1095 1.4096 1.4328
11.0744 3.2056 2.3018 3.2264
0.2292 3.1202 3.0986 2.9788
0.1486 0.9252 1.1709 1.1345
1.8847 1.8945 2.7820 3.2497 t-value 2.1720 9.9580+++ -0.3330 -0.9570 9.8970+++
Notes: *significant at level of 10%; **significant at level of 5%; ***significant at level of 1%; +significant at level of 10%, ++significant at level at 5%,
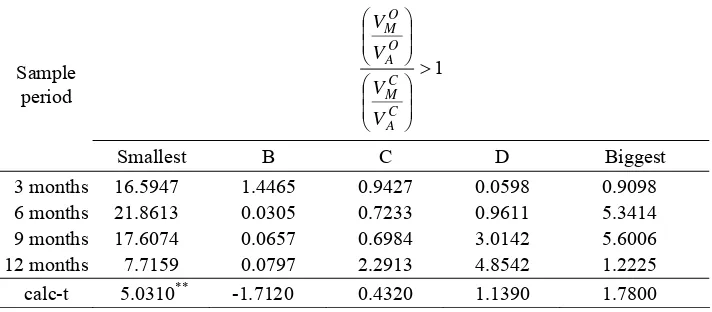
Table 13. The result of sensitivity tests by trading volume (hypothesis H4)
1
C A
C M O A
O M
V V V V
Sample period
Smallest B C D Biggest
3 months 6 months 9 months 12 months
16.5947 21.8613 17.6074 7.7159
1.4465 0.0305 0.0657 0.0797
0.9427 0.7233 0.6984 2.2913
0.0598 0.9611 3.0142 4.8542
0.9098 5.3414 5.6006 1.2225 calc-t 5.0310** -1.7120 0.4320 1.1390 1.7800
Notes: *significant at level of 10%; **significant at level of 5%; ***significant at level of 1%;
Return variance during lunch break ses-sion must be smaller than opening and closing return variance during morning and during afternoon. This finding is consistent and sup-ports to hypothesis H1. Therefore, the bottom line of U-shaped curve is the return variance during lunch break which is the smallest vari-ance compared to all that within one day. This finding re-supports H2. Furthermore, hypothe-sis H3 examination also confirms that U-shaped curve is proven during morning session for the smallest and D-column quintiles. This means that U-shaped curve is a function of return variance in full day period. The last one, H4 examination shows that private informa-tion arrival is always related to the stock price and its arrival occurs within one trading day or does not have permanent effect on stock price. The overall results of hypotheses on trading volume sensitivity tests conclude that private information occurred validly in IDX.
Sensitivity tests by bid-ask spreads
From Table 14 until Table 17 show simi-lar results compared to the previous examina-tion by both firm size and trading volume. All examinations confirm that private information arrival is proven valid in IDX. This is marked by the opening return variance during early
morning session compared to closing return variance during lunch break or return variance around lunch break which is greater than one. This finding is consistent and in supporting to H1. Therefore, the bottom line of U-shaped curve is return variance during lunch break which is the smallest variance compared to all within one day. This finding supports to H2. Furthermore, hypothesis H3 examination also confirms that U-shaped curve exist during morning session for the biggest and B- and C-columns bid-ask spreads. This means that U-shaped curve is a function of return variance in full day period. The last one, H4 examination, shows that private information arrival does not have permanent effect on stock price. The de-tailed results of hypotheses are presented in the following consecutive tables.
Findings and Consequences
the highest return variance during early trading period, this study concludes that private information arrives at every morning session in IDX. This confirmation is also supported by
the existence and occurrence of high closing return variance around late afternoon session. Therefore, U-shaped curve formula is closing to the complete form.
Table 14. The sensitivity tests by bid-ask spreads (hypothesis H1)
1
Notes: *significant at level of 10%; **significant at level of 5%; ***significant at level of 1%; +significant at level of 10%, ++significant at level at 5%,
+++significant at level of 1%, whose mark + refers to opposite result of that is hypothesized
Table 15. The sensitivity tests by bid-ask spreads (hypothesis H2)
O
Notes: *significant at level of 10%; **significant at level of 5%; ***significant at level of 1%; +significant at level of 10%, ++significant at level at 5%,
Table 16. The sensitivity tests by bid-ask spreads (hypothesis H3)
1
C EM C MM
V V
Sample period
Smallest B C D Biggest
3 months 6 months 9 months 12 months
13.4887 4.8169 4.1098 3.5888
0.7618 0.8554 0.9266 1.5461
2.1189 1.6316 1.0070 1.1853
2.0757 2.2552 2.2717 1.8576
13.0215 6.6821 7.0783 7.0336 t-value 17.8830+++ -0.3620 2.3180+ 22.9410+++ 51.3340+++
1
C MM
C LM
V V
Sample period
Smallest B C D Biggest
3 months 6 months 9 months 12 months
0.0655 0.1150 0.1335 0.2397
3.6193 1.3954 1.3857 1.2324
0.2314 0.5864 0.8130 0.6780
0.4404 0.6523 0.8001 0.9389
0.0740 0.0799 0.0870 0.0896 t-value -23.4800*** 1.5890 -3.4010** -2.7380* -259.9640***
1
O MM
O LM
V V
Sample period
Smallest B C D Biggest
3 months 6 months 9 months 12 months
0.0991 0.2144 0.2904 0.3367
2.8750 2.0476 1.8579 1.5650
0.1184 0.7170 0.6517 0.6056
0.3729 3.4165 9.5335 7.6565
0.0509 0.1857 0.1835 0.1880 t-value -2.6190* 8.1990+++ -1.3040 0.3150 -2.2300
Notes: *significant at level of 10%; **significant at level of 5%; ***significant at level of 1%; +significant at level of 10%, ++significant at level at 5%,
Table 17. The result of sensitivity tests by bid-ask spreads (hypothesis H4)
1
C A
C M O A
O M
V V V V
Sample period
Smallest B C D Biggest
3 months 6 months 9 months 12 months
9.1775 5.7287 7.0501 11.1887
0.1405 3.3023 4.4487 5.0504
3.8876 3.1787 6.0236 8.2458
9.9064 5.9832 4.4570 0.6829
6.6353 8.7773 32.2256 33.3889 calc-t 6.0710*** 2.0440 3.7900** 2.2310 2.6510*
Notes: *significant at level of 10%; **significant at level of 5%; ***significant at level of 1%;
The occurrence of private information ar-rival is also sharpened by the result of exami-nation of U-shaped curve, though morning session support U-shaped curve formation for the smallest, medium and the biggest sized firm; the smallest and medium trading volume; and the smallest, medium and the biggest bid-ask spreads. The point is, with all confirmed results of this U-shaped form, return formula-tion in U-shaped curve occurs within period of one full day. This study later found sharpening evidence that private information is revealed short lived, i.e. one day, on the IDX’ stock market. This study suggests that private in-formation always related to stock price during every trading day in IDX.
With the confirmation of U-shaped curve formula at IDX, this study formulates a trading strategy that can be applied by investors. The investors at IDX could do trading if only they have information, refers to informed investors. This strategy must also be complemented not just with information, but also with strict ob-served time when return variance is high. This high return variance occurs during early morning session and during late afternoon session. The investors’ prudential behavior is necessary to observe high return variance during early morning session and late after-noon session along with specific information
acquired which is not well known publicly among other investors.
The timing of trading strategy is also found in this study. The investors who wish to acquire high return should trade during period when the return variance is high, that is during early morning or during late afternoon session. However, during all this time, the investors may also suffer great losses. Meanwhile, if the investors wish for certain returns but in small number, the investors should trade during around before and after lunch break. The rea-son is, during around this period, it is proven that lunch break return variance is the lowest compared to other return variance within one day period. This can also be inferred that the period having the highest return variance re-fers to the high risk period, whereas the period having low return variance refers to low risk period. The prudential principle for investors trading during high return variance is abso-lutely necessary.
dur-ing period havdur-ing the lowest return variance. Inversely, sell strategy is recommended to be applied during period having high return vari-ance. This means that investors should wait until early morning session on the next day, to see whether there is new private information arrival or not. The reasons that support this sell-buy strategy is shown that stock mispric-ing only occurs durmispric-ing period havmispric-ing high re-turn variance and it is not likely to occur dur-ing period havdur-ing low return variance. The last attention to these all findings is to be consid-ered that private information arrival is related to stock price in short lived. In other words, it only occurs within period that is not longer than one day.
CONCLUSION AND LIMITATIONS
This study is able to confirm the existence and occurrence of return formulation at IDX in form of U-shaped curve, as the return variance formulation at other countries stock market. Basically, this study concludes the research findings as follows. First, the occurrence of private information at IDX is proven validly.
Second, return variance during morning ses-sion is the highest value which affects all re-turn variance during morning and afternoon.
Third, descending line of U-shaped curve during morning session and then ascending line of U-shaped curve during the end-after-noon occur, for certain groups. Fourth, the effect of private information arrival occurs within short term.
All four conclusions have impacts against trading strategy for investors at IDX. The best strategy is as follows. The investors do trading if only they have information. Investors who wish for high returns should trade during pe-riod having high return variance that is during early morning session or during late afternoon session. By maintaining the concept of in-formed investors, buy strategy may be applied during around lunch break, and sell strategy may be applied during late afternoon or during early morning on the next day. In addition,
investors should keep in their mind that pri-vate information arrival related to price in short lived. In other words, the relationship between private information arrival and stock price only occurs within period that is not longer than one day.
This study has limitations that may de-crease conclusion validity. These limitations are as follow. First, this research only used 30 minutes interval data, whereas the price high price instability may occur within less or more than 30 minutes. This price variability is not captured within this study. Second, this study used sensitivity tests on firm size, trading vol-ume and bid-ask spreads. Further study can be designed by applying trading day and market-up or -down condition. Third, this research used all stock within LQ45 list index, so that it only describes the frequently traded stock.
Fourth, this study ignores to economic and market-related events. Although we know that emerging capital market is very vulnerable to these events, eventually, the effects are simul-taneously to all traded stocks. The Last, this study uses bid-ask spreads as a sensitivity test. This requires a caution that bid-ask spreads is not based on the information asymmetry con-cept but transitory component concon-cept instead. The concept of transitory component calcu-lates spread value based on inventory cost and its completion cost.
REFERENCES
Admati, A., and P. Pflederer, 1988. “A Theory of Intraday Patterns: Volume and Price Variability”. The Review of Financial Studies, 1 (1), 3-40.
Amihud, Y., and H. Mendelson, 1987. “Trad-ing Mechanism and Stock Return: An Empirical Investigations”. Journal of Fi-nance, 42, 533-553.
Andersen, T., and T. Bollerslev, 1997. “Intra-day Periodicity and Volatility Persistence in Financial Market”. Journal of Empiri-cal Finance, 4, 115-158.
Balduzzi, P., E. J. Elton, and T. C. Green, 2001. “Economic News and Bond Prices: Evidence from the US Treasury Market”.
Journal of Financial and Quantitative Analysis, 36 (4), 523-543.
Barron, O. E., 1995. “Trading Volume and Belief Revisions That Differ Among Indi-vidual Analysts”. The Accounting Review,
70 (4), 581-597.
Bery, T. D., and K. M. Howe, 1994. “Public Information Arrival”. Journal of Finance,
49, 1331-1347.
Bhattacharya, U., H. Dauouk, B. Jorgenson, and C. H. Kehr, 2000. “When an Event is Not an Event: The Curious Case of An Emerging Market”. Journal of Financial Economics, 55 (1), 69-101.
Chan, K.C., W. G. Christie, and P. H. Schultz, 1995. “Market Structure and the Intraday Pattern of Bid-Ask Spreads for Nasdaq Securities”. Journal of Business, 68 (1), 35-60.
Cheung, Y. L., 1995. “Intraday Return and the Day End Effect: Evidence from the Hong Kong Equity Market”.Journal of Business Finance and Accounting, 22 (7), 1023-1034.
Dvorak, T., 2005. “Do Domestic Investors Have an Information Advantage? Evi-dence from Indonesia”. Journal of Fi-nance, 25 (2), 817-839.
Easley, D., and O’Hara, 1987. “Price, Trade Size and Information in Securities Mar-kets”. Journal of Financial Economics,
19, 69-90.
Fama, E. F., 1970. “Efficient Capital Market: a Review of Theory and Empirical Work”.
Journal of Finance, 25, 387-417.
Fama, E. F., 1991. “Efficient Capital Markets II”. Journal of Finance. 46 (51), 575-617.
Foster and Viswanatahan, 1993. “Variations in Trading Volume, Return Volatility and Trading Costs: Evidence on Recent Price Formation Models”. Journal of Finance,
48, 187-211.
French, K.R., and R. Roll, 1986. “Stock Price Variances: The Arrival of Information and the Reaction Traders”. Journal of Finan-cial Economics, 17, 5-26.
Frino, A., and A. Hill, 2001. “Intraday Futures Market Behavior around Major Scheduled Macroeconomics Announcements: Aus-tralian Evidence”. Journal of Banking and Finance, 25: 1319-1337.
Grundy, B., D., and Y. Kim, 2002. “Stock Market Volatility in a Heterogeneous In-formation Economy”. Journal of Finan-cial and Quantitative Analysis, 37(1), 1-27.
Guner, N., and Z. Onder, 2002. “Information and Volatility: Evidence from An Emerg-ing Market”. Emerging Markets Finance and Trade, 36 (6), 26-46.
Harris, L., 1986. “A Transaction Data Study of Weekly and Intra-daily Patterns in Stock Returns”. Journal of Financial Econom-ics, 8, 55-69.
Ho, Y.K., and Y.L. Cheung, 1991. “Behavior of Intra-Daily Return on Asian Emerging Market - Hong Kong”. Applied Econom-ics, 23 (6), 957-966.
Huang, Y.S., D.Y. Liu, and T.W. Fu, 2000. “Stock Price Behavior over Trading and Non-Trading Periods: Evidence from The Taiwan Stock Exchange”. Journal Busi-ness and Financial Accounting, 51, 575-602.
Ito, T., and W.L. Lin, 1992. “Lunch Break and Intraday Volatility of Stock Returns: An Hourly Data Analysis of Tokyo and New York Stock Markets”. Economics Letters, 39, 85-90.
Jain, and Joh, 1988. “The Dependence be-tween Hourly Prices and Trading Vol-ume”. Journal of Financial and Quantita-tive Analysis, 22, 109-126.
Kyle, A., 1985. “Continuous Auction and In-sider Trading”. Econometrica, 53, 1315-1335.
Mcnish, T. H., and R. A. Wood, 1992. “An Analysis of Intraday Patterns in Bid/Ask Spread for NYSE Stocks”. Journal of Fi-nance, 47(2), 753-764.
Odean, T., 1998. “Volume, Volatility, Price and Profit When All Traders are Above Average”. Journal of Finance, 53 (6), 1887-1934.
Peiers, B., 1997. “Informed Traders, Interven-tion and Price Leadership A Deeper View of The Microstructure of The Foreign Ex-change Market Closures”. Journal of Fi-nance, 49 (4), 1589-1614.
Pritamani, M., and V. Singal, 2001. “Return Predictability following Large Prices Changes and Information Releases”. Journal of Banking and Finance, 25, 631-656.
Slezak, S., 1994. “A Theory of The Dynamics of Security Returns Around Market Clo-sures”. Journal of Finance, 50, 319-339.
Steely, and Chelley, 2001. “Opening Returns, Noise and Overreaction”. Journal of Fi-nancial Research, 24 (4), 513-521. Stoll, H. R., 1989. “Inferring the Component
of the Bid-ask spreads: Theory and Em-pirical Test”. Journal of Finance, 44, 115-134.
Suhaibani, M.A., and L. Kryzanowski, 2000. “The Information Content of Orders on the Saudi Stock Market”. Journal of Fi-nancial Research, 23 (2), 145-156.
Sumiyana, 2007. “Noise as the Impact of Trading Mechanism and Periodic Clearing Procedures: Substantive Evidence from Indonesia Stock Exchange”. Journal of Indonesian Economy and Business, 24 (1), 81-99.
Sumiyana, 2008. “Behavior of Stock Price Variability over Trading and Nontrading Periods, and Daily Return Volatility”.
Gadjah Mada International Journal of Business, 9 (3), 409-453.
Sumiyana, 2009. “The Behavior of Opening and Closing Prices: Noise and Overreac-tion”. Gadjah Mada International Journal of Business, 11 (Jan-April), 73-116. Wood, R.A., T. H. Mcnish, and J. K. Ord,