FINANCIAL FEASIBILITY OF INVESTING IN SMALLHOLDER
COW-CALF COOPERATIVES IN BALURAN NATIONAL PARK
Kelayakan Finansial Investasi pada Koperasi Usaha Pembibitan Sapi di Taman
Nasional Baluran
Mark Rademaker, Any Suryantini, Jangkung Handoyo Mulyo Faculty of Agriculture, Universitas Gadjah Mada Jl. Flora, Bulaksumur, Kec.Depok, Kabupaten Sleman,
Daerah Istimewa Yogyakarta 55281 [email protected]
Diterima tanggal 30 Maret 2017; Disetujui tanggal 24 Mei 2017
ABSTRACT
Livestock grazing is a major driver of human-wildlife confl ict in conservation areas. Currently, it is estimated that 3000 heads of cattle illegally grazing within Baluran National Park (BNP) in East Java. The recent research has suggested the potential of livestock system intensifi cation to reduce land-use and confl ict through conservation priorities. The research goal was to investigate the fi nancial feasibility of starting intensive cow-calf cooperatives by smallholders in the BNP area. Data were collected using Farm surveys in a Criterion sampling design. Optimal herd management plans were generated using whole farm Linear Programming and fi nancial feasibility was assessed using Discounted cash-fl ow analysis and debt-servicing capabilities. Investment lifetime was set at 15 years and four alternative varieties of cattle were taken from Bali, Peranakan Ongole, Limousin and Simmental. Results show that investing in all varieties represents a positive investment opportunity. Bali cattle obtaining the highest NPV ($53.769), IRR (14,25%) and B/C ratio (1,13). Farmer income can be increased by 163% by combining additional Off-farm labor. However, debt-servicing capabilities of cow-calf cooperative activities showed that the loan principal can only be repaid in the 10th year instead of the maximum eight years set by the government cow-calf credit scheme. We urge the government to reconsider either the grace period or the repayment time of the credit scheme to better fi t the cash-fl ow characteristics of cow-calf enterprises.
Keywords : cash-fl ow analysis; human-wildlife confl ict; linear programming; livestock grazing
INTISARI
INTRODUCTION
Rural governments around the world are faced with challenges on how to best allocate and use available lands, especially in balancing the interests of nature conservation with expanding agriculture (Green et al., 2005). One of the main locations where conflicts take place is around protected areas such as National Parks (NP). Issues around these areas primarily revolve around the levels of exploitation allowed within and around park boundaries (Andrade & Rhodes, 2012; Fiallo & Jacobson, 1995). Livestock grazing has been a major driver of confl ict in NP areas (Fleischner, 1994; Infi eld & Namara, 2001; Fischer, 2009; Waweru & Oleleboo, 2013). Negative impacts of overgrazing include loss of biodiversity, disruption of the nutrient cycling and changes in the biophysical characteristics of the soil (Fleischner, 1994; Dorrough et al., 2007; Howland et al, 2014). In the Baluran NP (BNP) area in East Java, there are currently an estimated 3000 heads
of cattle illegally grazing within park boundaries.
The cattle belong to two villages. The first is the village of Karang Teko located on the park’s border and the second village, Merak, is an enclave of settlers who entered the park in 1975 as employees for a plantation company that, in a conterversial case, had obtained a 25-year plantation exploitation permit from the Ministry of Internal Affairs (SK. 16/HGU/DA/1975), even though the right to grant exploitation rights and reborder protected areas did not lie with the Ministry of Internal Affairs, but with the Ministry of Agriculture.
Despite continous protests from the Ministry of Agriculture, the permit was never revoked and exploitation continued untill its expiration in the year 2000. However, new conflict soon started as former employees claimed ownership rights to the accession areas. They reportedly rented and bought land from the permit-holder with the hope of gaining ownership once the permit expired, although it is not empat jenis sapi yang berbeda, yaitu sapi Bali, Peranakan Ongole, Limousin dan Simmental. Hasil penelitian menunjuk bahwa investasinya layak untuk semua jenis sapi, tetapi dengan sapi Bali yang menghasilkan nilai NPV ($53.769), IRR (14,25%) dan rasio B/C (1,13) terbesar. Pendapatan petani dapat meningkat sebanyak 163% melalui kombinasi dengan pendapatan luar koperasi. Namun, biaya prinsipal dari pinjaman yang dibutuhkan hanya dapat dibayar kembali pada tahun ke-10, daripada batas maksimal 8 tahun yang ditetapkan oleh skema kredit usaha pembibitan sapi dari pemerintah. Kami mendesak pada pemerintah Indonesia untuk mempertimbangkan kembali masa tenggang atau waktu pelunasan skema kredit usaha pembibitan sapi agar lebih sesuai dengan karakteristik arus kas usaha pembibitan sapi.
known whether the employees were aware these constructions are illegal under permit regulations, or that they were duped into it by the permit holder (Wianti, 2014).
The enclave has grown since and currently numbers over 320 families, who are still reliant on government funded Direct Cash-Assistance (BLT) and free rice distributions (Raskin) to meet their needs (Wianti, 2014). Considering that former old-order political and industry collusion are largely at the root of the problem, the current government takes a humanistic approach towards the settlers in Merak. Why the Karang Teko villagers on the border of the protected area are not prohibited from grazing their cattle in the national park is unknown.
Direct competition between the grazing cattle from both communities and wildlife has contributed to population declines in several highly threathened and protected species. The most notable example of this is the Banteng (Bos javanicus), whose population numbers have dwindled from 150-200 pre-settlement down to less than 25 individuals in 2014 (Hakim et al., 2015). Next to this, settlers have been involved in the illegal hunting of Banteng and other protected species such as Javan Rusa (Rusa timorensis), as well as bird-trapping, feeding into the rampant illegal bird trade on Java (Eaton et al., 2015).
Recent research has indicated the potential of intensification of livestock systems to spare lands and thereby reduce
conflict with conservation priorities (Lapola et al., 2014; Cohn et al., 2014). In BNP such an intensifi cation would entail a transition from smallholder grazing on BNP’s savannah areas to intensive livestock keeping in village areas. Potential funding to realize such a transition has recently become available through a new government created credit scheme (KUPS) to support national beef self-suffi ciency goals, which is specifically aimed at the creation of medium scaled cow-calf businesses by smallholders (Ilham & Saliem, 2016; Winarso & Basuno, 2013). However, it is unknown whether such an investment would be fi nancially feasible and, if feasible, how the cooperative might be optimally managed by the smallholders.
This research aimed to investigate the financial feasibility of investing in intensive cow-calf cooperatives by livestock smallholders from the BNP area based on optimal herd management. In doing so, a second aim was to present a potential solution to the current confl ict that benefits both the villagers from an economic perspective, National Park authorities from a conservation perspective and the central goverment in achieving national policy goals.
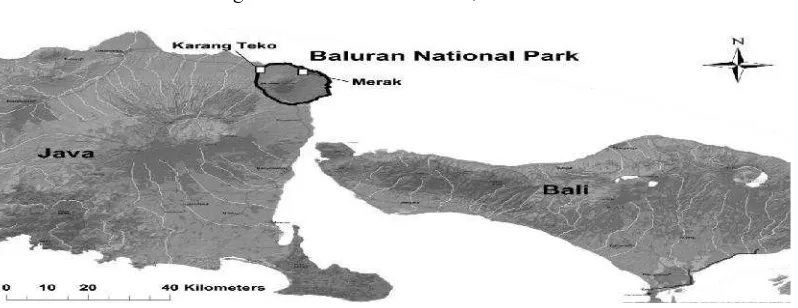
METHODS
Figure 1. Location of Baluran National Park (BNP) on the North-Eastern tip of Java Island, Indonesia. Basemap from National Geographic, ESRI (2017).
information on the ownership status and total number of heads of cattle owned per farmer in the village of Karang Teko and in the Merak enclave. The aim was to sample 50 respondents in each location using criterion sampling (Suri, 2011), as the uncertainty regarding the total number of livestock-keeping households and their precise locations for both villages did not allow a representative sample size to be determined a priori, nor random sampling to be implemented in the fi eld.
As part of the smallholders in the BNP area rear cattle for external investors on a split-profi t basis, only those farmers that had full ownership of all or part of their cattle were included.
The value of cattle owned was estimated based on weight in kilograms, determined by measuring the heart girth and body length (Pater, 2007; Heinrichs et al., 1992) (Equation 1). The average value of the cattle owned per farmer was used as a proxy for available investment capital.
(1) Cattle weight estimation
Where Wkg is weight in kg, equal to heart girth square (H2) in inches multiplied by body length (L) inches, divided by 300 and multiplied by the ratio of pound to kilogram. Secondary data relating to the operational and investment costs, were obtained from the East-Java Livestock Extension Offi ce or DINAS Peternakan JATIM in Surabaya. The maximum limit for the number of members per planned cooperative was set at 10 members and 50 heads of breeding cows in an intensive colony system.
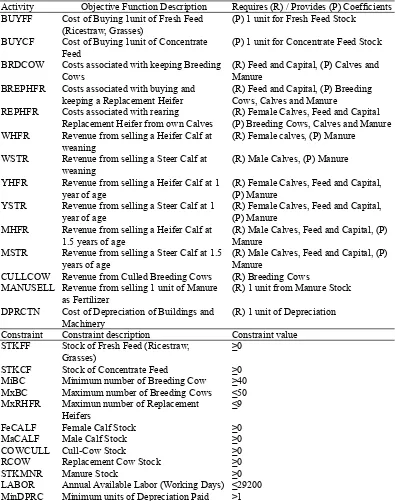
Table 1. Activities and Constraints Included in The Base Model For The Whole Farm Linear Programmming Model.
Activity Objective Function Description Requires (R) / Provides (P) Coeffi cients BUYFF Cost of Buying 1unit of Fresh Feed
(Ricestraw, Grasses)
(P) 1 unit for Fresh Feed Stock
BUYCF Cost of Buying 1unit of Concentrate Feed
(P) 1 unit for Concentrate Feed Stock
BRDCOW Costs associated with keeping Breeding Cows
(R) Feed and Capital, (P) Calves and Manure
BREPHFR Costs associated with buying and keeping a Replacement Heifer
(R) Feed and Capital, (P) Breeding Cows, Calves and Manure
REPHFR Costs associated with rearing Replacement Heifer from own Calves
(R) Female Calves, Feed and Capital (P) Breeding Cows, Calves and Manure WHFR Revenue from selling a Heifer Calf at
weaning
(R) Female calves, (P) Manure
WSTR Revenue from selling a Steer Calf at weaning
(R) Male Calves, (P) Manure
YHFR Revenue from selling a Heifer Calf at 1 year of age
(R) Female Calves, Feed and Capital, (P) Manure
YSTR Revenue from selling a Steer Calf at 1 year of age
(R) Female Calves, Feed and Capital, (P) Manure
MHFR Revenue from selling a Heifer Calf at 1.5 years of age
(R) Male Calves, Feed and Capital, (P) Manure
MSTR Revenue from selling a Steer Calf at 1.5 years of age
(R) Male Calves, Feed and Capital, (P) Manure
CULLCOW Revenue from Culled Breeding Cows (R) Breeding Cows MANUSELL Revenue from selling 1 unit of Manure
as Fertilizer
(R) 1 unit from Manure Stock
DPRCTN Cost of Depreciation of Buildings and Machinery
(R) 1 unit of Depreciation
Constraint Constraint description Constraint value STKFF Stock of Fresh Feed (Ricestraw,
Grasses)
≥0
STKCF Stock of Concentrate Feed ≥0 MiBC Minimum number of Breeding Cow ≥40 MxBC Maximum number of Breeding Cows ≤50 MxRHFR Maximun number of Replacement
Heifers
≤9
FeCALF Female Calf Stock ≥0
MaCALF Male Calf Stock ≥0
COWCULL Cull-Cow Stock ≥0
RCOW Replacement Cow Stock ≥0
STKMNR Manure Stock ≥0
LABOR Annual Available Labor (Working Days) ≤29200 MinDPRC Minimum units of Depreciation Paid ≥1
1991). The types of cattle considered were the Limousin, Peranakan Ongole (PO), Simmental and Bali variety, with the differrent feed requirements, weight and
The base model included 14 activities and 12 constraints. Culling rate for the breeding cows was set at 15%, and with an estimated annual loss of 3% of the cattle, replacement rate was set at 18%. Within the model, feed was bought locally from farmers around the cooperative instead of producing it on privately owned land and transferring it to the cattle feed (e.g. Gomes, 1991). This to support the local economy and increase societal acceptance towards the existence of a newly created medium-scaled cow-calf cooperative in the area. The linear model was analyzed using LiPS version 1.11.1.
The financial feasibility for the optimal herd development plans in the LP model was analyzed in detail using a monthly based discounted cash-flow analysis, including debt-servicing capabilities (Obst et al., 2007). The investment was deemed financially feasible if the net present value of proceeds minus costs over the investment’s lifespan > 0 (Eqn 2), and if the net cash proceeds accrued over the investment loan repayment period minus taxes and interest were larger than the intitial capital borrowed.
(2) Net Present Value estimation
Where T is the economic lifespan of the investment, Ct is the net
cash-flow in year t, r is the discount factor and C0 represents the initial investment. The discount factor was set at 10%, the current prime commercial lending rate at Indonesia’s three largest banks, Bank Negara Indonesia (BNI), Bank Rakyat Indonesia (BRI) and Bank Mandiri.
Tax rate was set at 1%, which is the rate set by the Indonesian government for businesses with an annual revenue of less than IDR 4.8 billion ($360.000). The loan repayment period of the governments cow-calf KUPS credit scheme is 6 years with an additional 24 month grace-period. Benefi t / Cost ratio of the investment was calculated by dividing the sum of the present values of cash infl ows by the sum of the present values of cash outflows. Next to this, the percentage of cash infl ows allocated to fresh and concentrate feed cost was assessed. Feed cost can make up to 50% of operational costs in livestock enterprises and are therefore likely to explain variation in performance between cattle varieties (Holmgren & Dillon, 2015).
month consisting of 25 days of eight hours (Anggraeni, 2015).
RESULTS AND DISCUSSION
Estimated investment costs for buildings and land was Rp. 541.000.000 and annual depreciation equal to Rp. 42.766.667. Respondent characteristics for both villages are listed in Table 2.
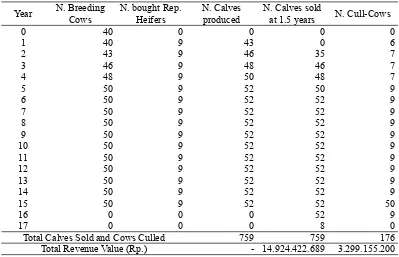
Of the alternative types of cattle considered, keeping the Simmental variety resulted in the largest farm surplus over the 15 year investment period (Fig. 2). For all cattle varieties, the optimal herd development plan included only bought replacement heifers and no replacement heifers reared from own calves. Next to this, all calves are sold at age 1.5 years and
none at 7 months or 1 year of age (Table 3). The optimal herd development plan of the Limousin cattle was equal to that of the Simmental variety, however with a slightly lower revenue value (Calves sold: Rp. 14.222.123.025; Cows Culled: Rp. 3.104.640.000). The number of calves produced and sold in the optimal herd development plan for the P.O. and Bali variety were considerably lower at 676 and 495 individuals, representing a revenue value of Rp. 6.617.923.308 and Rp. 5.061.960, respectively. The number of cows culled for the P.O. and Bali variety was similar to that for the Simmental and Limousin varieties with 175 and 173 individuals, however their revenue values were lower (P.O.: Rp. 2.646.000.000; Bali: Rp. 1.888.814.000).
Table 2. Respondent and Cattle Characteristics Used to Determine Available Investment Capital Per Farmer.
Karang Teko Merak
Number of respondents 49 50
Number of cattle reared 7,75 3,22
Number of cattle owned privately 2,10 1,32
Number of cattle measured 53 54
Average cattle weight (Kg) 329,52 390,71
Average value per head (Rp.) 15.631.786 17.972.469 Available investment capital (Rp.) 32.826.750 23.723.659
Discounted cash-flow analysis resulted in positive NPV’s, IRR and B/C ratio indicators for all cattle varieties considered, with the Bali variety performing best and the Limousin variety performing the worst (Table 4). This indicates that without taking tax and capital loan repayment into account, the investment would be
feasible for all varieties. The Simmental and Limousin variety had to allocate a relatively higher amount of cash infl ows towards covering feed costs compared to the Bali and P.O. cattle. The differrent cattle varieties differred considerably in the time required for cash infl ows to exceed cash outfl ows and generate positive net
Table 3. Optimal Herd Development of Simmental Cow-Calf Cooperative Based on Whole Farm Linear Program.
Year N. Breeding Cows
at 1.5 years N. Cull-Cows
0 40 0 0 0 0
Total Calves Sold and Cows Culled 759 759 176
Total Revenue Value (Rp.) - 14.924.422.689 3.299.155.200
Table 4. NPV, IRR and B/C ratio for investing in cow-calf cooperatives for the four cattle varieties, the percentage of cash infl ows allocated to the differrent cost items and % of cash fl ows that become net positive cash fl ow. Discount factor r in calculating NPV was equal to 10%, the prime lending rate in Indonesia.
Cattle
Bali 698.997.575 14,15% 1,130 34% 7% 22% 37%
P.O. 453.113.200 12,57% 1,070 28% 9% 30% 33%
Figure 3. Cash fl ow developments of cow-calf cooperatives for the different cattle varieties (a) Bali cattle (b) Simmental cattle (c) P.O. cattle (d) Limousin cattle. Solid black line indicates Net cash fl ow, dotted black line Cash infl ow and grey broken line
Cash outfl ow for the duration of the investment.
Table 5. Debt servicing capabilities for investing in Bali, P.O. Simmental and Limousin cow-calf cooperatives in Karang Teko and net value accrued per member. Year in which net accumulated cash-fl ows after tax exceed loan principal is highlighted in bold.
Bali P.O. Simmental Limousin
Peak debt Rp. 1.350.672.240 Rp. 1.424.745.963 Rp. 1.724.927.621 Rp. 1.424.745.963 Capital loan Rp. 2.000.000.000 Rp. 2.000.000.000 Rp. 2.000.000.000 Rp. 2.000.000.000 Interest 5% Rp. 100.000.000 Rp. 100.000.000 Rp. 100.000.000 Rp. 100.000.000 Net accumulated cash fl ow after tax (1%)
Year
Table 6. Debt servicing capabilities for investing in Bali, P.O. Simmental and Limousin cow-calf cooperatives in Merak and net value accrued per member. Year in which net accumulated cash-fl ows after tax exceed loan principal is highlighted in bold.
Bali P.O. Simmental Limousin
Peak debt Rp. 1.441.703.150 Rp. 1.614.751.353 Rp. 1.815.958.531 Rp. 1.730.199.781 Capital loan Rp. 2.500.000.000 Rp. 2.500.000.000 Rp. 2.500.000.000 Rp. 2.500.000.000 Interest 5% Rp. 125.000.000 Rp. 125.000.000 Rp. 125.000.000 Rp. 125.000.000 Net accumulated cash fl ow after tax (1%)
Year
0 Rp. 914.480.206 Rp. 1.189.838.366 Rp. 959.136.206 Rp. 929.156.006 1 Rp. 451.932.045 Rp. 742.119.854 Rp. 434.041.470 Rp. 422.021.236 2 Rp. 578.535.183 Rp. 557.724.369 Rp. 495.940.308 Rp. 475.292.231 3 Rp. 718.749.650 Rp. 385.248.647 Rp. 568.364.684 Rp. 539.147.480 4 Rp. 860.196.595 Rp. 297.141.105 Rp. 639.964.350 Rp. 609.804.534 5 Rp. 1.057.089.512 Rp. 252.131.113 Rp. 766.055.410 Rp. 445.522.365 6 Rp. 1.400.766.690 Rp. 349.668.517 Rp. 1.063.930.732 Rp. 737.680.000 7 Rp. 1.744.443.868 Rp. 842.133.937 Rp. 1.361.806.054 Rp. 1.062.815.306 8 Rp. 2.088.121.046 Rp. 1334.599.357 Rp. 1.659.681.376 Rp. 1.387.950.551 9 Rp. 2.431.798.224 Rp. 1.826.064.777 Rp. 1.957.556.698 Rp. 1.713.085.797 10 Rp. 2.556.685.402 Rp. 2.100.740.197 Rp. 2.036.642.019 Rp. 1.819.431.042 11 Rp. 2.900.362.580 Rp. 2.593.205.617 Rp. 2.334.517.341 Rp. 2.144.566.287 12 Rp. 3.244.039.759 Rp. 3.085.671.037 Rp. 2.632.392.663 Rp. 2.469.701.533 13 Rp. 3.587.716.937 Rp. 3.578.136.457 Rp. 2.930.267.985 Rp. 2.794.836.778 14 Rp. 3.931.394.115 Rp. 4.070.601.877 Rp. 3.228.143.307 Rp. 3.119.972.023 15 Rp. 6.455.275.201 Rp. 5.956.236.627 Rp. 5.728.826.093 Rp. 5.566.503.720 Minus principal Rp. 3.955.275.201 Rp. 3.456.236.627 Rp. 3.228.826.093 Rp. 3.066.503.720 Per member Rp. 395.527.520 Rp. 345.623.663 Rp. 322.882.609 Rp. 306.650.372
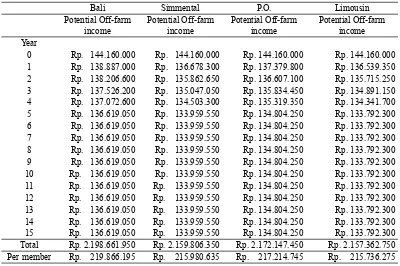
Table 7. Potential of Off-farm income that can be earned by farmers investing in cow-calf cooperatives for the four differrent cattle varieties.
Bali Simmental P.O. Limousin
Potential Off-farm income
Potential Off-farm income
Potential Off-farm income
Potential Off-farm income Year
0 Rp. 144.160.000 Rp. 144.160.000 Rp. 144.160.000 Rp. 144.160.000
1 Rp. 138.887.000 Rp. 136.678.300 Rp. 137.379.800 Rp. 136.539.350
2 Rp. 138.206.600 Rp. 135.862.650 Rp. 136.607.100 Rp. 135.715.250
3 Rp. 137.526.200 Rp. 135.047.050 Rp. 135.834.450 Rp. 134.891.150
4 Rp. 137.072.600 Rp. 134.503.300 Rp. 135.319.350 Rp. 134.341.700
5 Rp. 136.619.050 Rp. 133.959.550 Rp. 134.804.250 Rp. 133.792.300
6 Rp. 136.619.050 Rp. 133.959.550 Rp. 134.804.250 Rp. 133.792.300
7 Rp. 136.619.050 Rp. 133.959.550 Rp. 134.804.250 Rp. 133.792.300
8 Rp. 136.619.050 Rp. 133.959.550 Rp. 134.804.250 Rp. 133.792.300
9 Rp. 136.619.050 Rp. 133.959.550 Rp. 134.804.250 Rp. 133.792.300
10 Rp. 136.619.050 Rp. 133.959.550 Rp. 134.804.250 Rp. 133.792.300
11 Rp. 136.619.050 Rp. 133.959.550 Rp. 134.804.250 Rp. 133.792.300
12 Rp. 136.619.050 Rp. 133.959.550 Rp. 134.804.250 Rp. 133.792.300
13 Rp. 136.619.050 Rp. 133.959.550 Rp. 134.804.250 Rp. 133.792.300
14 Rp. 136.619.050 Rp. 133.959.550 Rp. 134.804.250 Rp. 133.792.300
15 Rp. 136.619.050 Rp. 133.959.550 Rp. 134.804.250 Rp. 133.792.300
Total Rp. 2.198.661.950 Rp. 2.159.806.350 Rp. 2.172.147.450 Rp. 2.157.362.750
cash flows before tax and interest (Fig 3.a-b). Investing in the Simmental variety produced the most stable cash fl ow and the Bali variety the most unstable cash fl ow.
Debt-servicing capabilities of the capital loans showed that net accumulated cash-fl ows after tax and interest remained positive for all varieties considered in both Merak and Karang Teko. However the principal could only be repaid in year 9 and 10 for the Bali and Simmental variety, year 10 and 11 for the P.O. variety and year 12 and 13 Limousin variety (Tables 5-6).
The planned ten cooperative members represent 24.000 hours of availlable anual labor. Total annual labor required for running the cooperative was an average of 2280 hours per year for all four cattle varieties, or 228 hours per member. The amount of hours availlable to work Off-farm by cooperative farmers was 21.720 hours, resulting in a potential average annual Off-farm income of Rp. 135.750.000, or Rp. 13.575.000 per member (Table 7).
Combining the potential income accrued from On-farm and Off-farm activities over the 15 year period resulted in the Bali cattle providing farmers the highest
value, with relatively little differrence compared to P.O. cattle (Table 8). Averaging the annual On- and Off-farm income gained between cattle varieties, gave a value of Rp. 39.528.390. This represents a net increase of Rp. 24.517.890, or 163% compared to the Rp. 15.010.500 annual income of Baluran villagers reported by Anggreani (2015).
The higher amounts of calves produced and sold by the Simmental and Limousin variety in the optimal Whole Farm Linear Program (Table 3) compared to Bali and P.O. cattle, can be explained by their much higher reproductive success.
The coeffi cients for these parameters in the whole farm Linear Programming model were based on availlable literature. For the Bali variety, Paune et al., (2014) found calving rates of 75% using artifi cial insemination and Jelantik et al., (2008), report an average calf mortality of 17,9%. This means that net birth and survival to weaning of Bali cattle is only 57,1%. During the same research, Paune et al.,(2014), found a much higher calving rate for P.O. cattle at 88,1% and with a reported calf mortality of 9% as reported by Wirdahayati
Table 8. Potential Off-farm and On-farm income gained per member by investing in cow-calf cooperatives in Karang Teko (K) and Merak (M).
Bali P.O. Simmental Limousin
et al., (2000), results in a 79,1% net birth and survival to weaning. These numbers are considerably lower than the net birth and survival to weaning reported by Cundiff et al., (1993) for Limousin and Simmental cattle at 90,8% and 88,8% respectively.
Scientifi c literature on the performance of Limousin and Simmental cattle in Indonesia were not available however, and this makes it diffi cult to assess whether their reproductive performance would be as high in the dry and hot conditions characterizing the Baluran area. Vice-versa, the calving rate and calf mortality of especially the Bali variety seems exceptionally poor and might be related more to sub-optimal cattle rearing in the specifi c researches mentioned; with improved cattle management much better results could potentially be achieved for this variety in Baluran.
Contrary to the farm surpluses obtained by the Whole Farm Linear Program, it were the Bali and P.O. variety that performed the best and the Simmental and Limousin variety that performed the least in the Discounted cash fl ow analysis (Table 4). This is mainly because of two factors. Firstly the Linear program only included fi xed costs in the form of depreciation of equipment and buildings, which favours those cattle types generating large amounts of revenue per item sold such as Limousin and Simmental calves.
Secondly, all costs and benefits obtained from maintaining breeding cows
and replacement heifers and rearing calves untill 1.5 years of age were brought back to a single year in the Linear Program and were not discounted. Spreading these items out over their respective time frames resulted in unfeasible solutions as cattle needed to be shifted between multiple years, sometimes placing three times the demand (raising replacement heifer year 1-3) on what is a single supply, i.e. a single replacement heifer obtained from a single heifer calf.
In the cash fl ow analysis these items (calves, replacement heifers) are spread out over their respective time schedules and discounted, thus providing a much more detailed view of actual costs and benefi ts obtained. Results show that because of their much higher cost of concentrate feed (Table 4), the Simmental and Limousin variety convert much less cash inflows into positive net cash fl ows, hence accruing less capital over time. Linear Programs are therefore useful in generating optimal herd development plans, but are not practical in forecasting actual net returns for cow-calf enterprises.
period. Although operational cash-fl ows can support the required interest payments (Table 5-6), a considerable amount of debt in the form of the loan’s principal is required to cover initial investment in buildings and cattle and maintain positive accumulated cash fl ows during the fi rst two years of operation in which no returns are made yet.
Although our research shows that starting intensive cow-calf cooperatives is a feasible option to resolve the current grazing problem in BNP from a fi nancial perspective, this does not necessarily mean it is the optimal solution from a social perspective. Any move towards potentially implementing this plan should continue with full support of village representatives, to avoid the forcing of measures on communities that favour conservation, but which eventually fail due to a lack of support (e.g. Madden, 2004; Benneth & Dearden, 2014).
National Park authorities are currently looking into starting an integrated agricultural system within the former concession area Merak, where the manure from intensively held cattle colonies might be used as organic fertilizer for fi elds of chili and dragon fruit, who seem exceptionally well suited to grow in the area due to the extended dry season. The fresh feed for the cattle is grown around these fields and the products marketed as ecologically friendly and conservation
supportive agriculture (Rademaker, 2017). However, the economic benefi ts of such a system have not been investigated yet and it is unknown how the cooperatives as described in this research might fi t into such a system.
CONCLUSIONS AND SUGGESTION
Our results show that starting cow-calf cooperatives by small-holders in the Baluran area represents a positive investment opportunity. Firstly, the whole-farm Linear Program showed the Simmental cattle as the variety with the highest production and returns. However, detailed cash-fl ow analysis showed that the Bali variety generates the highest NPV, IRR and B/C ratio of all four cattle varieties considered. Investing in cow-calf cooperatives provides farmers with the potential to increase their income by 163% through additional Off-farm labor. However, debt-servicing capabilities of cow-calf activities showed the loan principal can only be repaid in the 10th year of operations instead of the maximum 8 year period set by the government. We urge the government to reconsider either the interest rate or the grace period of the credit scheme to better fi t the cash-fl ow characteristics of cow-calf enterprises.
to this, the economic benefi ts of integrated conservation supportive agricultural systems that National Park authorities would like to develop should be assessed.
ACKNOWLEDGEMENTS
We would like to express our gratitude to National Park Authorities and the East-Java Livestock Extension Office for granting permission to carry out research in the National Park area and to collect secondary data. Next to this we would like to thank members of interviewed communities in Karang Teko and Merak for their participation.
REFERENCES
A n d r a d e , G . S . , & R h o d e s , J . R . , 2012. Protected areas and local c o m m u n i t i e s : A n i n e v i t a b l e partnership toward successful conservation strategies? Ecology and Society, 17(4): 14.
Anggreani, Y., 2015. Pola Pemanfaatan dan Kontribusi Hasil Hutan Terhadap Pendapatan Masyarakat Desa Penyangga Taman Nasional Baluran. [Bachelor Thesis]. Universitas Jember.
Astuti, M., 2004. Potensi dan keragaman sumberdaya genetik sapi Peranakan Ongole (PO). Wartazoa, 14(3): 98-106.
Caesariantika, E., Kondo, T., & Nakagoshi, N., 2011. Impact of Acacia nilotica (L.) Willd. ex Del invasion on plant species diversity in the Bekol Savanna, Baluran National Park, East Java, Indonesia. Tropics, 20(2): 45-53.
Cohn, A.S., Mosnier, A., Havlik, P., Valin, H., Herrero, M., Schim, E., & Obersteiner, M., 2014. Cattle ranching intensification in Brazil can reduce global greenhouse gas emissions by sparing land from deforestation. Proceedings of the National Academy of Sciences, 111(20): 7236-7241.
Cundiff, L. V., Szabo, F., Gregory, K.E., Koch, R.M., Dikeman, M.E., & Crouse, J.D., 1993. Breed comparisons in the Germplasm Evaluation Program at MARC. Proc. Beef Improv. Ann. Res. Sym. And Ann. Mtg : 124-136.
Dorrough, J., Moll, J., & Crosthwaite, J., 2007. Can intensification of temperate Australian livestock production systems save land for native biodiversity?. Agriculture, ecosystems & environment, 121(3): 222-232.
Eaton, J.A., Shepherd, C.R., Rheindt, F.E., Harris, J.B.C., van Balen, S.B., Wilcove, D.S., & Collar, N.J.,2015. Trade-driven extinctions and near-extinctions of avian taxa in Sundaic Indonesia. Forktail, 31: 1-12. Fiallo, E.A., & Jacobson, S.K., 1995. Local
communities and protected areas: attitudes of rural residents towards conservation and Machalilla National Park, Ecuador. Environmental Conservation, 22 (3): 241-249. Fischer, J., Sherren, K., Stott, J., Zerger,
A., Warren, G., & Stein, J., 2009. Toward landscape-wide conservation outcomes in Australia’s temperate grazing region. Frontiers in Ecology and the Environment, 8(2): 69-74. Fleischner, T.L., 1994. Ecological costs of
Gomes, M. G., 1991. Whole farm planning for a large scale sheep and beef cattle farm: a case study. [Master Thesis]. Agricultural Science in Farm Management , Massey University, New Zealand.
Green, R.E., Cornell, S.J., Scharlemann, J.P., & Balmford, A., 2005. Farming and the fate of wild nature. Science, 307(5709): 550-555.
Hakim, L., Guntoro, D.A., Waluyo, J., Sulastini, D., Hartanto, L., & Nakagoshi, N., 2015. Recent status of Banteng (Bos Javanicus) conservation in East Java and its perspectives on ecotourism planning. Journal of Tropical Life Science, 5(3): 152-157.
Heinrichs, A.J., Rogers, G.W., & Cooper, J.B., 1992. Predicting body weight and wither height in Holstein heifers using body measurements. Journal of Dairy Science, 75 (12): 3576-3581.
Hernowo, J.B., 1999. Habitat and Local Distribution of Javan Green Peafowl (Pavo muticus muticus Linneaus 1758) in Baluran National Park, East java. Media Konservasi, 6(1). Holmgren, L., Dillon, F., 2015. Cost and
Returns for a 200 Cow, Cow-Calf Operation, Northern Utah. Utah State University Extension.
Howland, B., Stojanovic, D., et al., 2014. Eaten out of house and home: impacts of grazing on ground-dwelling reptiles in Australian grasslands and grassy woodlands. PloS one, 9(12): e105966.
Ilham, N., & Saliem, H.P., 2016. Kelayakan finansial system integrase sawit-sapi melalui program kredit usaha pembibitan sapi. Analisis Kebijakan Pertanian, 9 (4): 349-369.
Infi eld, M., Namara, A., 2001. Community attitudes and behaviour towards conservation: an assessment of a community conservation programme around Lake Mburo National Park, Uganda. Oryx, 35(1): 48-60.
Jelantik, I.G.N., Copland, R., & Mullik, M.L., 2008. Mortality rate of Bali cattle (Bos sondaicus) calves in West Timor, Indonesia. Proceedings of the Australian Society for Animal Production, 27: 8.
Lapola, D. M., Martinelli, L. A., Peres, C.A., Ometto, J.P., Ferreira, M.E., Nobre, C.A., & Joly, C.A., 2014. Pervasive transition of the Brazilian land-use system. Nature Climate Change, 4(1): 27-35.
Madden, F., 2004. Creating coexistence between humans and wildlife: global perspectives on local efforts to address human–wildlife conflict. Human Dimensions of Wildlife, 9(4): 247-257.
Martojo, H., 2003. Indigenous bali cattle: the best suited cattle breed for sustainable small farms in Indonesia. Laboratory of Animal Breeding and Genetics, Faculty of Animal Science, Bogor Agricultural University, Indonesia.
Pater, S., 2007. How Much Does Your Animal Weigh? University of Arizona Cooperative Extension. Paune, S., Ilham, F., & Nugroho, T.A.E.,
2014. Comparison of Success Rate of Artifi cial Insemination in Beef Cattle Bali and Peranakan Ongole (PO) in the Regional Technical Implementation Unit (RTIU) Wonggahu Livestock Development. KIM Fakultas Ilmu-Ilmu Pertanian, 2(3).
E n v i r o n m e n t a l S c i e n c e a n d Conservation news. https://news. mongabay.com. [2 March 2017]. Suri, H., 2011). Document analysis as
a qualitative research method. Qualitative Research Journal, 9 (2): 27-40.
Waweru, F.K., Oleleboo, W.L., 2013. Human-Wildlife Conflicts: The Case of Livestock Grazing Inside Tsavo West National Park, Kenya. Research on Humanities and Social sciences, 19 (3): 60-67.
Wianti, K.F., 2014. Land Tenure Confl ict in the Middle of Africa van Java (Baluran National Park). Procedia
Environmental Sciences, 20: 459-467.
Winarso, B., & Basuno, E., 2013. Pengembangan pola integrasi tanaman-ternak merupakan bagian upaya mendukung usaha pembibitan sapi potong dalam negeri. Forum Penelitian Agro Ekonomi, 31 (2): 151-169.