Towards a decision support tool for 3D visualisation:
Application to selectivity purpose of single object in a 3D city scene
R. Neuville a, J. Pouliot b, F. Poux a, P.Hallot a, L. De Rudder c, R. Billen a
a Geomatics Unit, Department of Geography, University of Liège, Allée du Six Aout, Belgium – (romain.neuville, fpoux, p.hallot,
rbillen)@ulg.ac.be
b Department of Geomatics Sciences, University of Laval, Quebec City, Canada – [email protected]
c Department of Mathematics, University of Liège, Allée de la Découverte, Belgium – [email protected]
KEY WORDS: 3D semiotics, 3D visualisation, 3D cartography, 3D visualisation rules, static visual variables, 3D environment parameters, urban visualisation
ABSTRACT:
This paper deals with the establishment of a comprehensive methodological framework that defines 3D visualisation rules and its application in a decision support tool. Whilst the use of 3D models grows in many application fields, their visualisation remains challenging from the point of view of mapping and rendering aspects to be applied to suitability support the decision making process. Indeed, there exists a great number of 3D visualisation techniques but as far as we know, a decision support tool that facilitates the production of an efficient 3D visualisation is still missing. This is why a comprehensive methodological framework is proposed in order to build decision tables for specific data, tasks and contexts. Based on the second-order logic formalism, we define a set of functions and propositions among and between two collections of entities: on one hand static retinal variables (hue, size, shape…) and 3D environment parameters (directional lighting, shadow, haze…) and on the other hand their effect(s) regarding specific visual tasks. It enables to define 3D visualisation rules according to four categories: consequence, compatibility, potential incompatibility and incompatibility. In this paper, the application of the methodological framework is demonstrated for an urban visualisation at high density considering a specific set of entities. On the basis of our analysis and the results of many studies conducted in the 3D semiotics, which refers to the study of symbols and how they relay information, the truth values of propositions are determined. 3D visualisation rules are then extracted for the considered context and set of entities and are presented into a decision table with a colour coding. Finally, the decision table is implemented into a plugin developed with three.js, a cross-browser JavaScript library. The plugin consists of a sidebar and warning windows that help the designer in the use of a set of static retinal variables and 3D environment parameters.
1. INTRODUCTION
Following the constant evolution of computer sciences and acquisition techniques, many researches have been conducted in the field of 3D visualisation (Häberling et al., 2008; Métral et al., 2014; Semmo et al., 2015). Although 3D models are increasingly used in many projects in different application fields, ranging from archaeology to augmented reality and cadastre, environment modelling, telecommunication … (Bandrova, 2005; Häberling et al., 2008), their visualisation is still a challenge. Indeed, 3D visualisation techniques are numerous and their application is often specific to the types of data to visualise, the task to perform or the context in which the task is executed. For example, which visual variables best suit the distinction between two categories of 3D objects; should we apply shadow or not in a 3D navigation system; how to visualise the roads occluded by the building? As a consequence, selecting an appropriate 3D visualisation technique becomes complex, especially when being non-expert and dealing with new combinations of criteria (data, task or context) (Métral et al., 2014).
This is why a decision support tool is proposed in this paper. It aims at assisting non-professional users manipulating 3D viewers especially PDF 3D or SketchUp for example. Whilst these software provides a high number of functionalities to visualise 3D models, they do not warn the user against the pitfalls of their choices. For instance, the use of shadow combined with specific colours applied on 3D objects may make more complex the visibility inside the 3D scene. 3D objects may visually disappear which is detrimental to the transmission of information. Consequently, the proposed tool essentially addresses planners, managers who manipulate 3D models for decision makings by providing rules to produce an efficient 3D visualisation.
To build the decision support tool, a methodological framework is developed based on the second-order logic formalism. It enables to define 3D visualisation rules, classified into four categories (consequence, compatibility, incompatibility and potential incompatibility) through a set of functions and propositions among and between two collections of entities:
- Static retinal variables (hue, material, size…) and 3D environment parameters (atmosphere effect, depth of field, directional lighting…);
- Their effect(s), both interpretation tasks (selectivity, associativity…) and visual tasks like pollution, insecurity…
In this paper, the application of the model is demonstrated for an urban visualisation at high density considering a set of entities X
and Y. Based on our analysis and the results of three studies conducted in the 3D semiotics field, truth values of propositions are determined which enables to extract 3D visualisation rules that are both global and local (specific to the considered context and entities).
kinds of 3D models and application fields. Hence, additional decision tables can be created based on the same methodology.
This paper is organised as follows. Section 2 presents the 3D semiotics structure. Section 3 introduces the methodological framework and applies it in a selectivity context for an urban visualisation at high density. Section 4 presents the decision support tool and the proof-of-concept. Finally we conclude and address perspectives for future works.
2. 3D SEMIOTICS STRUCTURE 2.1 Context
As a reminder, semiotics is defined as the study of symbols and how they relay information (Ware, 2004). Regarding 2D semiotics, a major reference is the book of Jacques Bertin (published in 1967) entitled “Semiology of Graphics” in which he analyses the interpretation tasks of a set of graphical variables on two-dimensional objects.
Contrary to 2D semiotics, 3D semiotics is relatively new and whilst it refers to the same concepts as in 2D, it introduces new aspects like graphical elements, 3D design mechanisms and variables of vision (Jobst et al., 2008). As a consequence, the 2D visualisation rules cannot be directly implemented in 3D models. This is why many researches have been conducted in the 3D semiotics field like (Foss et al., 2005), (Halik, 2012), (Wang et al., 2012), (Pouliot et al., 2013, 2014a, 2014b), (Rautenbach et al., 2015)… The researches of (Foss et al., 2005) and (Halik, 2012) analyse respectively the use of hue in 3D thematic maps and the efficiency of some visual variables in augmented reality applications displayed on smartphone. Based on an application field (cadastre, urban planning) and an interpretation task (e.g. selectivity), the studies of (Pouliot et al., 2013, 2014a, 2014b), (Wang et al., 2012) and (Rautenbach et al., 2015) analyse the efficiency of some visual variables in 3D environments and conclude on some effective rules in 3D geovisualisation. For instance, (Pouliot et al., 2013, 2014a, 2014b) and (Wang et al., 2012) highlight that hue is one of the most encouraging variable for selectivity tasks in 3D cadastre visualisation. In another context (urban planning), (Rautenbach et al., 2015) show that the most adapted variables for selectivity tasks are hue and texture.
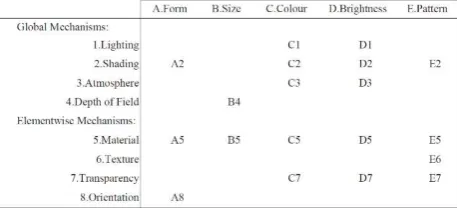
In 2015, an extended 3D semiotics model has been proposed by (Semmo et al., 2015). It integrates the research of (Jobst et al., 2008) and (Häberling et al.,2008) for the design aspects and the work of (Ware, 2004) and (Foerster et al., 2007), respectively for the visualisation pipeline and the concepts for cartographic generalisation (figure 1). The model presents five processing stages: (1) modelling of real-word phenomena (features), (2) filtering and pre-processing, (3) mapping of the primary model to a cartographic model via symbolization, (4) rendering, and (5) the perceptional interface (Semmo et al., 2015)1. It is worth noting that all these processing stages are not independent which means that some initial configurations must be reviewed. This is especially the case for the mapping and rendering stages. Indeed, some potential conflicts may appear between these stages. For instance, the depth of field (3D design mechanism) changes the perception of size (graphical variable); these two elements are therefore incompatible for an optimal 3D visualisation. In 2008, (Jobst et al.)analyse these conflicts and define some general incompatibilities (figure 2).
1 p.97
Figure 1 The extended 3D semiotic model from Semmo et al. (2015)
Whilst the study of (Jobst et al., 2008) points out some incompatibilities, it only considers a small number of graphical variables and does not present a general scope that would enable to define other potential links and conflicts. This is why a state-of-the-art of static visual variables defined by authors during the last decades is performed as well as the development of a comprehensive methodological framework which defines 3D visualisation rules on specific 3D data, tasks and contexts.
Figure 2 Graphical conflicts of 3D design mechanisms with graphical variables from Jobst et al. (2008)
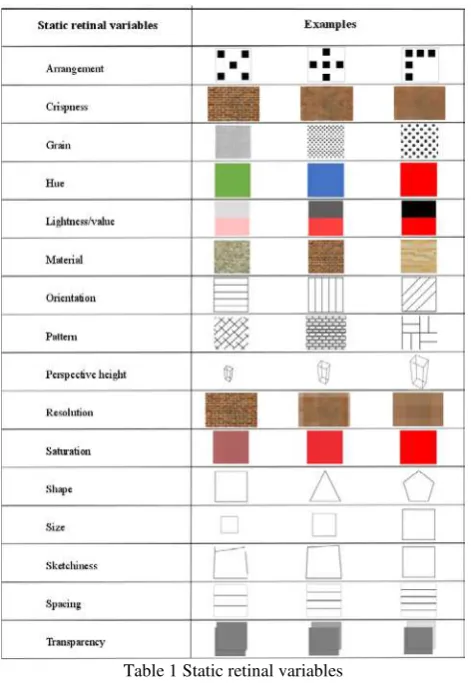
Table 1 Static retinal variables
Regarding the perceptual properties of these variables, (Bertin, 1967) gathers them according to four interpretation tasks (table 2).
Interpretation tasks The capacity Selectivity To extract categories Associativity To regroup similarities Order perception To compare several orders Quantitative perception To quantify a difference
Table 2 Interpretation tasks definitions
Whilst initially applied on 2D objects, the static retinal variables are not directly transposable on 3D objects. As already mentioned, the use and the efficiency of static retinal variables are a function of 3D scene parameters (figure 2). Since the study of (Jobst et al., 2008) does not provide a general scope, a methodological framework is proposed in order to determine all potential relations among and between static retinal variables and 3D environment parameters (cf. mapping and rendering aspects on figure 1). Its application is then demonstrated for an urban visualisation at high density considering a selection of entities.
3. METHODOLOGICAL FRAMEWORK 3.1 Definitions
The methodological framework is applied on two collections of entities. On one hand the collection of entities � (equation 1) corresponds to static retinal variables (table 1) and 3D environment parameters that include 3D global design mechanisms and environment projections (cf. figure 1). On the other hand the collection of entities �(equation 2) corresponds to the effect(s) of� regarding specific visual tasks. It includes
interpretation tasks (table 2) but may also cover any kinds of visual tasks like the appearance of a dilapidated city, an atmospheric pollution, a perception of insecurity …
�= {arrangement, atmosphere effect (haze), crispness, depth of field, environment projection, grain, hue, lightness/value, lighting (directional), material, orientation, pattern, perspective height, resolution, saturation, shading, shadow, shape, size,
sketchiness, spacing, transparency} (1)
�= {selectivity, associativity, order perception, quantitative perception, dilapidated city effect, pollution effect, perception of insecurity …} (2)
Then, two functions are defined. The equation 3 means that an entity � is associated to a part of the effects of � and for any effect � of an entity�, this entity induces this effect: e.g. since the static retinal variable “hue” is selective and associative, then hue induces these two interpretation tasks; since the visual variable “grain” is selective, associative and ordered, then grain implies these three interpretation tasks… The equation 4 means that an association of entities � (static retinal variables and/or 3D environment parameters) are required to produce an effect and for any effect� induced by a combination of entities �, these entities induce this effect : e.g. if a dilapidated city effect can be obtained by the combination of an atmospheric effect (e.g. haze) and the application of one kind of material (e.g. damaged facade material), then these entities induce this effect; if the perception of insecurity can be obtained by the application of a slight ambient light and a shadow, then they imply this effect … �:� �⎯� �(�):� ↦{� ∈ �:� → �} (3)
�:�×� �⎯� �(�): (�1�2)↦{� ∈ �: (�1�2)→ �} (4)
Based on these two functions, a series of propositions (equations 5 to 10) is defined to represent all potential links between the entities and their effect(s). The equation 5 means that the entity �1 induces the entity �2: e.g. the use of shadow implies the use of a directional light. The equation 6 means that the change of a variable �1, represented by �(�1), induces the change of a variable �2(�(�2)) : e.g. a change of perspective height implies a change of size; a change of grain implies a change of spacing … The equations 7 and 8 mean that an entity �1 may be respectively compatible or incompatible with another entity �2: e.g. the size is incompatible with the depth of field since the last one modifies the size perception; the grain is incompatible with the pattern in the case of selectivity since it creates a new pattern … The equations 9 and 10 mean that �1 (an effect of the entity�1) may be respectively combined or not with �2 (an effect of the entity�2) : e.g. the simultaneous use of size and hue enables to combine the specific effects of these visual variables (the order perception with the size and the associative perception with the hue); the selectivity effect of pattern and grain cancels since this combination creates new patterns and makes difficult the distinction between the two variables; the order perception of grain may nevertheless be maintained with pattern although the selectivity effect of these two visual variables disappears … �1→ �2 (5)
�(�1) → �(�2) (6)
�1∩ �2 (7)
¬(�1∩ �2) (8)
(�1∈ �(�1),�2∈ �(�2))(�1∪�2) (9)
All these equations enable to define 3D visualisation rules classified into four categories: consequence (equations 5 and 6), compatibility, incompatibility and potential incompatibility (equations 7 to 10).
3.2 Application to selectivity purpose of single object in a 3D city scene
To validate its feasibility, the methodological framework is applied to an urban visualisation at high density considering a selection of entities. The collection of entities� corresponds to equation 1 while the collection of entities � only considers the selectivity interpretation task (equation 11). It is worth noting that depending on the data, tasks and context, other entities � and � may be considered.
�= {selectivity} (11)
Based on many studies conducted in the 3D semiotics field and our analysis on a virtual 3D LOD1 model of New-York city in CityGML provided by the Technical University of Munich (figure 3), the truth values of propositions defined in equations 5 to 10 are determined.
Figure 3 Virtual 3D LOD1 model of New-York city with the analysis zone
As a reminder, the consequence link is represented by the equations 5 and 6. The equation 5 is only true for the shadow (�1) since it implies the use of a directional lighting (�2) while the equation 6 is true for seven entities:
- a change of perspective height induces a change of size;
- a change of grain induces a change of spacing; - a change of transparency induces a change of
lightness/value and saturation.
The compatibility and incompatibility links refer to the equations 7 to 10. The equations 7 and 8 determine the compatibility and incompatibility links among entities�. Based on several researches, we are able to extract the following global incompatibilities:
- the 3D environment parameter “atmosphere effect (haze)” influences the static retinal variables “ lightness/value” and “saturation” (Jobst et al., 2008); - the 3D environment parameter “depth of field” changes
the perception of the static retinal variables “size” (Jobst et al., 2008), “orientation” (Wang et al., 2012), “grain”, “spacing” (Ware, 2013), but also “perspective height” and “resolution” ;
- the 3D environment parameter “lighting (directional)” influences the static retinal variables “ lightness/value and saturation” (Jobst et al., 2008);
- the 3D environment parameter “shading” influences the static retinal variables “lightness/value” and “saturation” (Jobst et al., 2008);
- the 3D environment parameter “shadow” influences the static retinal variables “lightness/value” and “saturation” (Jobst et al., 2008).
Figure 4 illustrates the previous incompatibilities.
Figure 4 Visual impacts of 3D environment parameters and static retinal variables
Besides the previous global incompatibilities, there exists other incompatibilities where the truth of propositions is a function of the context, the 3D objects or the characteristics of other entities used simultaneously. Indeed, the use of shading may impact the arrangement, grain, orientation, pattern, sketchiness and spacing only if it produces a similar colour as these static retinal variables (Jobst et al., 2008). On figure 4 (g), shading reduces the visibility of pattern, especially on the roofs.
3D objects, the visual variables applied on them (e.g. hue) and the context since the shadow will not impact similarly the objects of a “flat” 3D model than an urban environment with many skyscrapers.
If a “bump mapping” effect is applied on the static retinal variable “material”, it changes the static retinal variables “lightness/value” and “saturation” and may also affect some other visual variables like the arrangement, grain, orientation, pattern, perspective height, shape, size, sketchiness and spacing since this effect deforms the geometry and may induce a similar colour as other retinal variables (Jobst et al., 2008). However, the degree of inconsistency depends on the 3D objects geometry since the “bump mapping” effect may modify the geometry without changing the general form. On the other hand, the “bump mapping” will not affect these visual variables if there is no colours combination.
Next, the static retinal variable “transparency” may affect the arrangement, grain, hue, material, orientation, pattern, sketchiness, and spacing since new combinations may be generated (Jobst et al., 2008). On figure 4 (h), transparency induces new colours combinations. However, transparency does not always affect these visual variables since the impact depends on the spatial distribution of 3D objects.
Finally, the equations 9 and 10 determine the compatibility and incompatibility links among the entities � (the effects of entities�). As a reminder, the selectivity interpretation task is only considered. Among the entities� that are selective, some are not compatible since their effect of selectivity cancels when they are applied on a same 3D object. Therefore, it is recommended to avoid the combination of grain and pattern or sketchiness as it becomes difficult to distinguish the grain from the pattern or sketchiness (or the reverse).
4. DECISION SUPPORT TOOL
4.1 A decision table of selectivity for an urban visualisation at high density
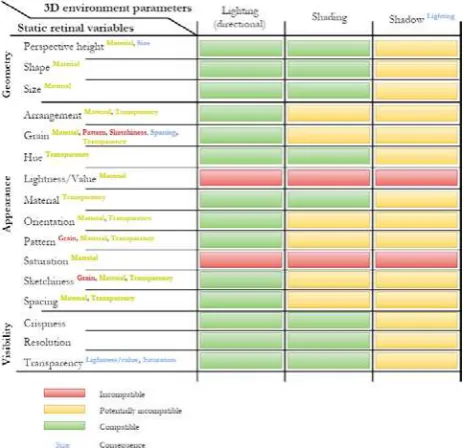
Based on the previous defined 3D visualisation rules among and between the selected entities � and�, a decision table is produced. The aim is to provide to users a decision support tool when designing their own 3D urban model. The entities� are divided into static retinal variables and 3D environment parameters and static visual variables are sorted into three categories (geometry, appearance and visibility) depending on their visual impact. This division is carried out in order to help non-expert users. Through the use of four colours, all 3D visualisation rules are represented:
- the “green” colour means that the entities are compatible;
- the “yellow” colour means that the entities are potentially incompatible;
- the “red” colour means that the entities are incompatible;
- the “blue” colour means a consequence link.
The decision table can be read in several ways. Indeed, the designer could firstly choose a set of static retinal variables that will constraint the selection of 3D environment parameters or he could select a set of 3D environment parameters that will limit the use of some static retinal variables. Therefore, mapping and rendering stages (figure 1) are no longer independent which enables to avoid potential conflicts. Non-expert users can then
find appropriate graphical expressions by simply analysing the decision table. As a consequence, consistent combinations are proposed so as to produce an optimal 3D visualisation. The next sub-section will present the implementation of the decision table into a proof-of-concept (POC) developed in WebGL.
Figure 5 A decision table of selectivity for an urban visualisation at high density (part 1)
Figure 6 A decision table of selectivity for an urban visualisation at high density (part 2)
4.2 Proof-of-Concept
7 and 8). The first event concerns the representation of 3D visualisation rules (consequence, direct and potential incompatibilities) through the colour coding while the second event concerns the explanation of these rules via a warning window. This is especially useful for the potential incompatibilities where the complexity of the 3D model acts greatly. Consequently, non-expert users are aware of the visual risks and they can then pay attention to specific visualisation aspects in order to produce an optimal 3D visualisation.
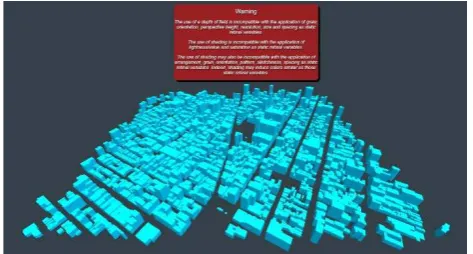
The proof-of-concept is applied to the visualisation of the 3D LOD1 model of the quarter around Eleven Madison Park (New-York). Non-expert users can then select and deselect the 3D environment parameters that will apply to the model and will be warned of the risks through the sidebar (figure 7) and the warning window (figure 8).
Figure 7 A proof-of-concept of decision support tool: Direct and Potential incompatibilities linked to the use of a
depth of field and a shading
Figure 8 A proof-of-concept of decision support tool: A warning window linked to the use of a depth of field and a
shading
5. CONCLUSION AND FUTURE WORK
This paper aims at proposing a decision support tool to assist planners, managers who manipulate 3D models for decision makings by providing visualisation rules to produce an efficient 3D visualisation. Through the development of a methodological framework based on the second-order logic formalism, we define a set of functions and propositions among and between two collections of entities: on one hand static retinal variables and 3D environment parameters and on the other hand their effect(s) regarding specific visual tasks. It enables to define 3D visualisation rules classified into four categories: consequence, compatibility, potential incompatibility and incompatibility. In this paper, the application of the methodological framework is
demonstrated for an urban visualisation at high density considering a selection of entities. All static retinal variables defined over the last fifty years as well as a set of 3D environment parameters have been considered and correspond to the collection of entities�. Regarding the effects of these entities, until now we only considered the selectivity interpretation task which corresponds to the collection of entities�. Based on our analysis and the results of three studies conducted in the 3D semiotics field, truth values of propositions are determined. 3D visualisation rules, both global and local (specific to selectivity for an urban visualisation at high density), are then extracted. Next, a decision support tool is produced through a decision table which is then implemented into a proof-of-concept by designing a kind of decision support plugin. Through the development of a sidebar and a warning window, the plugin helps non-expert users to efficiently select static retinal variables and a set of 3D environment parameters.
Whilst the decision table is only valid for a 3D city scene in a selectivity purpose of single object, it could be completed by considering additional 3D environment parameters and visual tasks. Furthermore, new decision tables could be created for other 3D data, visual tasks and contexts. Indeed, the methodological framework constitutes a working platform transposable to any 3D models and application fields. As a consequence, it enables to efficiently relay any kinds of three dimensional information by proposing consistent and optimal combinations during the mapping and rendering of 3D models. Finally, the approach could be a basis to assist machine learning: so more you use, more the proposal would fit your requirements. Future works will follow in order to apply the methodological framework in several control contexts (considering various users’ profiles) and also to validate the proposal.
REFERENCES
Bandrova, T., 2005. Innovative Technology for the Creation of 3D Maps. Data Science Journal, Vol. 4, pp. 53–58.
Bertin, J., 1967. Sémiologie graphique : les diagrammes, les réseaux et les cartes, Mouton/Gauthier-Villars, Paris.
Boukhelifa, N., Bezerianos, A., Isenberg, T., & Fekete, J.-D. (2012). Evaluating Sketchiness as a Visual Variable for the Depiction of Qualitative Uncertainty. In IEEE Transactions on Visualization and Computer Graphics, 18(2), 2769-2778.
Carpendale, M. S. T., 2003. Considering Visual Variables as a Basis for Information Visualisation. Dept. of Computer Science, University of Calgary, Canada, Tech. Rep. 2001-693-16. http://dspace.ucalgary.ca/bitstream/1880/45758/2/2001-693- 16. pdf
Foerster, T., Stoter, J. E. and Kobben, B., 2007. Towards a formal classification of generalization operators. In 26th International
Cartographic Conference, Moscow.
Fosse, J.M., Veiga, L.A.K. & C.R. Sluter., 2005. Color Hue as a Visual Variable in 3D Interactive Map. In IEEE International Conference on Communications, Vol. 55, Seoul, Korea.
Halik, L., 2012. The Analysis of Visual Variables for Use in the Cartographic Design of Point Symbols for Mobile Augmented Reality Applications. In Geodesy and Cartography 61(1), pp. 19–30.
Jobst, M., Kyprianidis, J.E., & Döllner, J., 2008. Mechanisms on Graphical Core Variables in the Design of Cartographic 3D City Presentations. A. Moore, I. Drecki (Eds.), Geospatial Vision, Lecture Notes in Geoinformation and Cartography, Springer-Verlag, pp. 45-59.
MacEachren, A.M., Robinson, A., Hopper, S., Gardner, S., Murray, R., Gahegan, M. & Hetzler, E., 2005. Visualizing Geospatial Information Uncertainty: What We Know and What We Need to Know. Cartography and Geographic Information Science, 32(3), pp. 139–160.
Métral, C., Ghoula, N., Silva, V. & Falquet, G., 2014. A Repository of Information Visualization Techniques to Support the Design of 3D Virtual City Models. U. Isikdag (Ed.),
Innovations in 3D Geo-Information Sciences, Lecture Notes in Geoinformation and Cartography, Springer, pp. 175-194.
Pouliot, J., Wang, C., Fuchs, V., Hubert, F. & Bédard, M., 2013. Experiments with Notaries about the Semiology of 3D Cadastral Models. In: The International Archives of the Photogrammetry, Remote Sensing and Spatial Information Sciences, Istanbul, Turkey, Vol. XL-2/W2, p53–57.
Pouliot, J., Wang, C. & Hubert, F., 2014a. Transparency Performance in the 3D Visualization of Bounding Legal and Physical Objects: Preliminary Results of a Survey. In the Proceedings of the4th International Workshop on 3D Cadastres,
Dubai, pp. 173–182.
Pouliot, J., Wang, C., Hubert, F. & Fuchs, V., 2014b. Empirical Assessment of the Suitability of Visual Variables to Achieve Notarial Tasks Established from 3D Condominium Models. U. Isikdag (Ed.), Innovations in 3D Geo-Information Sciences, Lecture Notes in Geoinformation and Cartography, Springer International Publishing Switzerland, pp. 195-210.
Rautenbach, V., Coetzee, S., Schiewe, J. & Çöltekin, A., 2015. An Assessment of Visual Variables for the Cartographic Design of 3D Informal Settlement Models. In theProceedings of the ICC 215, Rio de Janeiro, Brazil.
Semmo, A., Trapp, M., Jobst, M. & Döllner, J., 2015. Cartography-Oriented Design of 3D Geospatial Information Visualization – Overview and Techniques. The Cartographic Journal 52, no. 2: 95–106.
Slocum, T. A., McMaster, R.B., Kessler, F.C & Howard, H.H., 2010. Thematic Cartography and Geovisualization (Third Edition), Pearson Education LTD, London.
Wang, C., Pouliot, J. & Hubert, F., 2012. Visualization Principles in 3D Cadastre: A First Assessment of Visual Variables. In the Proceedings of the 3rd International Workshop on 3D Cadastres, Shenzhen, pp. 309-324.
Ware, C., 2012. Information Visualization Perception for Design, Elsevier Science, Burlington.