Evidence from Indonesia, Thailand, Philippines, and Malaysia
Maria Praptiningsih
Department of Business Management, Faculty of Economics Petra Christian University, Surabaya, Indonesia
Email: mia@peter.petra.ac.id
ABSTRACT
Corporate governance still becomes a major issue during the post-financial crisis period in Asian emerging market, such as Indonesia, Thailand, Philippines and Malaysia. Particularly, the financial institutions have implemented corporate governance reforms to enhance the protection of shareholders and stakeholders interest. The consequences emerge as it allows for greater monitoring especially by the shareholders. The objective of this study is to measure the corporate governance and performance in banking sectors in particular, which is determining by the corporate governance mechanisms. In the last part, this study attempts to identify whether there exist any differences in the monitoring mechanisms of banking firms and non-banking firms. This study found that only the foreign shareholder which is represent of the ownerships monitoring mechanisms are significantly negatively related with corporate performance measures in the banking firms in Asian emerging markets. Second, the Internal Control Monitoring Mechanisms showed the insignificant relationship with corporate performance, but only one of the internal control monitoring mechanisms which is CEO duality provides evidence in order to explain the relationship better. Third, the disclosure monitoring mechanisms through the big 4 external auditor is significantly related to corporate performance, instead of the big 3 rating agency. Last, there are similarities between bank and non-bank in terms of corporate governance monitoring mechanisms.
Keywords: corporate governance, firms’ performance, monitoring mechanisms.
GENERALITIES OF THE STUDY
Background of the Study
Does good corporate governance still matter in Asian business recently? It is an interesting question that economist and businessess concern on it, although it was ten years after the Asian crisis had happened. Meanwhile, some people believe that corporate governance has no longer become main issues during their business. These people are speculators.
Unfortunately, good governance does not matter equally to all classes of investor, and this make a difference to the way a company sees the need for good governance. Therefore, the question become more sophisticated, would corporate governance still relevant toward the business and economic behavior through such reforms such as restructuring, mergers, and acquisitions exercises in order to improve the corporate performance? The mere fact that investors make a distinction based on corporate governance and that analysts write about its growing significance and are beginning to find evidence that it does make a difference, means that it is indeed becoming more important.
Nowadays, the attention of corporate governance’s implementation is focused on the effectiveness of corporate governance in assures protection on investment and generates return by improving the corporate performance (Zulkafli and Samad, 2007). Nevertheless, earlier studies have found differences in corporate governance practices across industries, particularly in emerging markets.
During the past ten years after the Asian crisis, many studies focused on non-financial firms in order to observe its corporate governance practice (Wallace and Zinkin, 2005). The evidence indicate that there are differences between corporate governance mechanism for financial sectors such as banking firms and the non-financial corporation since they operate under different environments. Other evidence that made was an issue of moral hazard in banking firm operational, such as transfer pricing, asset stripping, hiring family members, and an improper credit allocations that result negative impact on bank’s performance (Zulkafli and Samad, 2007). Therefore, this paper attempt to identify whether there exist any differences on banking firms and non-banking firms monitoring mechanism, based on corporate governance mechanism such as Ownership
Monitoring Mechanism, Internal Control Monitoring Mechanism, Regulatory Monitoring Mechanism, and Disclosure Monitoring Mechanism.
Research Objectives
The objective of this study is to measure the corporate governance and performance in banking firms/sectors in particular, which is determining by the corporate governance mechanisms. In the last part, this study attempts to identify whether there exist any differences in the monitoring mechanisms of banking firms and non-banking firms.
Research Questions
The research questions for this study will be:
− Is there a significant relationship between the corporate performance in banking firms and the corporate governance monitoring mechanisms?
− Is there a significant difference between
monitoring mechanism on banking firms and non-banking firms?
Scope of the Research
The coverage of the study is in the Asian region, which is represent by some countries in Asian emerging market. This study concerned about the implementation of corporate governance in Asian region, particularly after the economic and financial crisis in 1997. The data sets period using annually data from 2003-2007, consist of 22 banking firms in Indonesia, 12 banking firms in Thailand, 13 banking firms in Philippines, and 5 banking firms in Malaysia, which all those banking firms are listed on each Stock Exchange.
REVIEW OF RELATED LITERATURE AND STUDIES
Definition and Features of the Independent Variable
Issues of Corporate Governance in Banking
In their book, (Brigham and Erhardt, 2005) defined corporate governance as the set of rules and procedures that ensures managers do indeed employ the principles of value based management. The essence of corporate governance is to make sure that the key shareholder objective -wealth management- is implemented.
The Bassel Committee on Banking Supervision – Federal Reserve defined that banks are a critical component of any economy. They provide financing for commercial enterprises, basic financial services to a broad segment of the population and access to payment systems (Brigham and Erhardt, 2005). The importance of banks to national economies is underscored by the fact that banking is virtually universally a regulated industry and that banks have access to government safety nets. It is of crucial importance therefore that banks have strong corporate governance.
Corporate Governance Monitoring Mechanism
The Bassel Committee on Banking Supervision– Federal Reserve papers, has highlighted the fact that strategies and techniques based on OECD Principles (Brigham and Erhardt, 2005), which are basic to conduct corporate governance include:
(a) The corporate values, codes of conduct and other standards of appropriate behavior and the system used to ensure compliance with them
(b) Establishment of a mechanism for the interaction and cooperation among the board of directors, senior management, and the auditors
(c) Strong internal control systems, including internal and external audit functions, risk management functions independent of business lines, and other checks and balances.
In addition, the corporate governance monitoring mechanism becomes one of the practices of those particular strategies to conduct the corporate governance.
Theories and Studies Related to the Independent Variable
Issues of Corporate Governance in Banking
Corporate Governance Monitoring Mechanism
a.. Ownership Monitoring Mechanism - Large Shareholders
In his study, (Mitton, 2002) found that large shareholders can benefit the minority shareholders because of their power and incentives to prevent expropriation.
- Government Ownership
The controlling of government may used to solve the conflict problem between the board management and the shareholders (Bai, Liu, Lu, Song, and Zhang, 2003)
- Foreign Ownership
The study of (Micco, Panizza, and Yanez, 2004) result the interesting fact, which is the entry of foreign banks particularly in developing countries, attempt to domestic banks more efficient in terms of overhead cost and spread. It is a good impact to the banking sectors as well.
b. Internal Control Monitoring Mechanism
- CEO Duality
High compensation and prestige go with the position on the board of a major company, so board seats are prized possessions (Brigham and Erhardt, 2005). In similar, (Wallace & Zinkin, 2005) confirmed that the Chair needs the support of the CEO and must ensure that the committee maintains the confidence of management whilst also retaining its independence and objectivity. It is preferable for the Chair to not also be Chair of the Board, which is called CEO Duality.
- Board Size
As the study of (Cheng, 2008), the variability of corporate performance changes with board size independent of the existence of agency problems within larger board, which is means that board size is an important determinant of volatility in corporate performance.
- Board Independence
To conduct the checks and balances that is measure by the compliance board, needs the outsiders into the board to provide a more effective monitoring of managers (Adams and Mehran, 2003).
c. Regulatory Monitoring Mechanism
According to (Brigham and Erhardt, 2005), the review from the Bassel Committee implies that the regulatory monitoring which is issued by the central bank or the government also affect the banking performance particularly in profitability, through the reserve requirement and or the capital adequacy ratio.
d. Disclosure Monitoring Mechanism
The financial transparency becomes more important mechanism particular in after the economic and monetary crisis, because it can define the credible assurance from banks activities (Zulkafli & Samad, 2007)
- Big 4 External Auditors
According to OECD Principles and study of (Niinimaki, 2001), an auditor plays an important role as a bank supervisor to ensure the financial report controlling in order to improving the corporate performance. The big 4 external auditors are Pricewater house Coopers, Deloitte Touche Tohmatsu, Ernst & Young, and KPMG.
- Big 3 Rating Agency
In order to assess the financial health of the bank and the valuation of the banks, the shareholder needs accurate rating information by some trusted rating agencies (Brigham and Erhardt, 2005). Therefore, the rating agency plays an important role also on corporate performance. The big 3 rating agency are Moody’s, S&P, and Fitch.
Relationship of the Independent Variable to the Dependent Variable
As we pointed earlier, that this paper attempt to investigate the direct relationship between the corporate governance monitoring mechanism, with all its proxies, can affect the corporate governance performance with the ROA as a proxy.
Definition and Features of the Dependent Variable
As we discussed earlier, this paper measure the corporate performance of banking firms as the dependent variable based on the corporate governance principles, which is using the Return on Asset (ROA) ratio as a proxy. Return on Asset (ROA) is the ratio of income before interest and taxes (EBIT) or net income divided by book value of assets at the beginning of the fiscal year (Brigham & Ehrhadrt, 2005). Return on assets measures a company’s earnings in relation to all of the resources it had at its disposal [the shareholders’ capital plus short and long-term borrowed funds]. Thus, it is the most stringent and excessive test of return to shareholders. If a company has no debt, it the return on assets and return on equity figures will be the same. An indicator of how profitable a company is relative to its total
assets. ROA gives an idea as to how
earnings. Calculated by dividing a company's annual earnings by its total assets, ROA is displayed as a percentage. Sometimes this is referred to as "return on investment". (Brigham & Erhardt, 2005). The following is the ROA ratio calculation:
Boubakri et al, 2005 also used ROA, ROE, and Return on Sales as the variables to measure the firm performance.
Previous Studies
The main paper that supporting this paper is study of (Zulkafli & Samad, 2007). The topic is corporate governance and performance of banking firms. In additional paper, there are (Baubakri et al, 2005) study which is investigate the postprivatization corporate governance: the role of ownership structure and investor protection; and the study of (Cheng, 2008) about the board size and the variability of corporate performance.
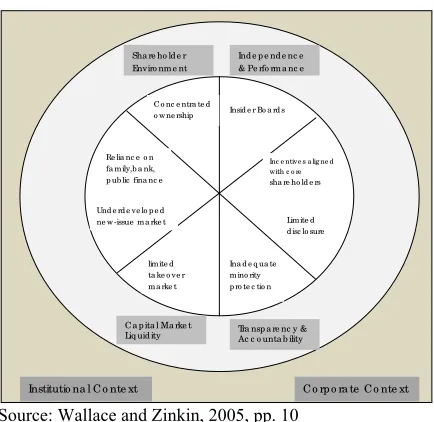
Source: Wallace and Zinkin, 2005, pp. 10
Figure 1. Control Model of Corporate Governance
Conceptual Framework
The idea of the theoretical framework in above which is similar with the conceptual framework that will use in this paper, defined that the model is about achieving and retaining control through:
(a)Concentrated ownership and a reliance on family or bank finance, which determine the shareholder context
(b)Board with aligned incentives, such the Board is dependent on the same outcome as the controlling shareholders
(c)Limited disclosure and inadequate minority protection
(d)Illiquid capital markets with restricted takeover activities and an under-developed new issue market.
Research Hypotheses
Based on the theories and the contextual framework, this paper will construct the hypotheses in order to test the relationship and how each independent variable is associated with dependent variable, in which direction on regression model.
Model 1:
CP = Corporate performance measured by
ROA
OWN = Large block holders/shareholders
GOV = Government ownership
FOR = Foreign ownership
CEO = Duality
SZB = Number of Director in bank t
INDB = Number of Independent Directors in bank t
CAR = Capital Adequacy Ratio
BIG3 = Rating of banks by reputable rating agencies (Big 3)
BIG4 = Auditing by reputable external auditor (Big 4)
SIZE = Size of banks measured by total assets
e = Random error
βi = Parameters to be estimated
Model 1:
Ho: β1;β2;β3;β4;β5;β6;β7;β8 = 0 (4)
There is no significant difference between the large blockholders; CEO duality; the number of director in bank t; the number of independence director in bank t; the capital adequacy ratio; the rating of banks by the big 3 rating agency; auditing result by the reputable external auditor; between size of the bank by its total assets; and ROA.
Model 2:
Ho: β1;β2;β3;β4;β5;β6;β7;β8;β9 = 0 (5)
There is no significant difference between the government ownerships; foreign ownerships; CEO duality; the number of director in bank t; the number of independence director in bank t; the capital adequacy ratio; the rating of banks by the big 3 rating agency; auditing result by the reputable external auditor; between size of the bank by its total assets; and ROA.
After we construct the null hypothesis, then the alternative hypotheses, as follows:
Model 1:
Ha : β1;β2;β3;β4;β5;β6;β7;β8 ≠ 0 or minimum one of the
variable not equal with zero (6)
There is a significant difference between the large blockholders; CEO duality; the number of director in bank t; the number of independence director in bank t; the capital adequacy ratio; the rating of banks by the big 3 rating agency; auditing result by the reputable external auditor; between size of the bank by its total assets; and ROA
Model 2:
Ha : β1;β2;β3;β4;β5;β6;β7;β8;β9 ≠ 0 or minimum one of
the variable not equal with zero. (7)
There is a significant difference between the government ownerships; foreign ownerships; CEO duality; the number of director in bank t; the number of independence director in bank t; the capital adequacy ratio; the rating of banks by the big 3 rating agency; auditing result by the reputable external auditor; between size of the bank by its total assets; and ROA.
Method of Research Used
In particular, this research using the Case Study Method in order to investigate a contemporary phenomenon in real life context. Moreover, this study concerned with how things happen and why, in such
case of corporate governance in Asian emerging markets. The objective of this method is attempts to understand what is happening and link the contextual realities toward the lack of what was planned and what is the fact in a certain period.
Collection of Data/Gathering Procedures
This paper use panel data that is combination between time series data and cross section data, particularly in annually data. The number of banking firms and all proxies comes from each emerging markets, such as Indonesia, Thailand, Malaysia, and Philippines. The main sources of those data was collected from each country’s stock exchange, which are Indonesia Stock Exchange, SET Exchange, Kuala Lumpur Stock Exchange (Bursa Malaysia), and the Philippines Stock Exchange,
In order to get additional data to sharpen the analysis, this paper also optimize the Financial Statement Annually and Quarterly Data/Reports for each banking firms, the Central Bank Annual Reports, The IMF Reports, and other sources of data.
Statistical Treatment of Data
The Research Model
This study assumed a direct relationship between corporate governance monitoring mechanism as independent variables, with its proxies to measure it, and corporate performance of banking firms as a dependent variable with the ROA as its proxy.
The research using a Panel Estimated Generalized Least Squares (EGLS) Regression Model, using the Eviews Software Package.
Panel Data Analysis
Panel data analysis is an increasingly popular form of longitudinal data analysis among social and behavioral science researchers. A panel is a cross-section or group of people who are surveyed periodically over a given time span (Yaffe, 2006).
psychology, sociology, and health research to study characteristics of groups of people followed over time. In educational research, researchers study classes of students or graduates over time (Yaffe, 2006).
Before we observed in detailed, based on (Cameron & Trivedi, 2005), panel model could be divided into two categories as well, which is linear panel data models and non-linear panel data models. The linear data models and associated estimators are conceptually simple, aside from the fundamental issue of whether or not fixed effect are necessary (will be describe later on). The considerable algebra used to derive the properties of panel data estimators should not distract one from an understanding of the basics: The statistical properties of panel data estimators vary with the assumed model and its treatment of unobserved effects. Furthermore, much of the algebra does not generalize to non-linear panel models.
According to research model in above, this paper would adopt the linear panel data models instead of non-linear panel data model.
Types of Panel Analytic Models
Greene, 2003 and Yaffe, 2006, defined that there are several types of panel data analytic models. There are constant coefficients models, fixed effects models, and random effects models. Among these types of models are dynamic panel, robust, and covariance structure models. Solutions to problems of heteroskedasticity and autocorrelation are of interest here.
a. The Constant Coefficients Model
One type of panel model has constant coefficients, referring to both intercepts and slopes. In the event that there is neither significant country nor significant temporal effects, we could pool all of the data and run an ordinary least squares regression model. Although most of the time there are either country or temporal effects, there are occasions when neither of these is statistically significant. This model is sometimes called the pooled regression model.
b. The Fixed Effects Model (Least Squares Dummy Variable Model)
Another type of panel model would have constant slopes but intercepts that differ according to the cross-sectional (group) unit—for example, the country. Although there are no significant temporal effects, there are significant differences among countries in this type of model. While the intercept is cross-section (group) specific and in this case differs from country to country, it may or
may not differ over time. These models are called fixed effects models.
The one big advantage of the fixed effects model is that the error terms may be correlated with the individual effects. If group effects are uncorrelated with the group means of the repressors, it would probably be better to employ a more parsimonious parameterization of the panel model.
c. The Random Effects Model
Prof. William H. Greene calls the random effects model a regression with a random constant term (Greene, 2003). One way to handle the ignorance or error is to assume that the intercept is a random outcome variable. The random outcome is a function of a mean value plus a random error. Nevertheless, this cross-sectional specific error term vi, which indicates the deviation from the
constant of the cross-sectional unit (in this example, country) must be uncorrelated with the errors of the variables if this is to be modeled. The time series cross-sectional regression model is one with an intercept that is a random effect.
According to above explanation, this paper uses the random effect models regarding some basic assumptions. There are: the unobserved effect is uncorrelated with all the explanatory variables; the unobserved individual heterogeneity as being distributed independently of the repressors; using a balanced panel data; the number of observation (N) greater than number of period (T); and in order to solve the serial correlation problem as well.
Specification Tests: the Quandary of Random or Fixed Effect Models
The Hausman specification test is the classical test of whether the fixed or random effects model should be used. The research question is whether there is significant correlation between the unobserved person-specific random effects and the regressors. If there is no such correlation, then the random effects model may be more powerful and parsimonious. If there is such a correlation, the random effects model would be inconsistently estimated and the fixed effects model would be the model of choice.
Model Estimation
proxy variables uncorrelated with the errors, are based on the group means. The use of these instrumental variables allows researchers to circumvent the inconsistency and inefficiency problems following from correlation of the individual variables with the errors.
This paper will examine the specification of the model using the Hausman test, based on two models that we construct earlier. This test is used to decide whether the random effects model or fixed effects model that should be appropriate used in this research. Therefore, the result will be support the analysis and arguments as well.
PRESENTATION AND CRITICAL DISCUSSION OF RESULTS
Descriptive Statistics
The descriptive statistics for all variables are presented in Table 1 to 3. It is found that 100% of 52 banks in the sample are having at least 5% shareholding by a single shareholders ranging from 0 to 99.99%. In terms of the type of large shareholders, foreign shareholdings can be found in 27 banks (51.92%) while there is and existence of government’s shareholdings in 12 banks (23.08%). The following table are in detail:
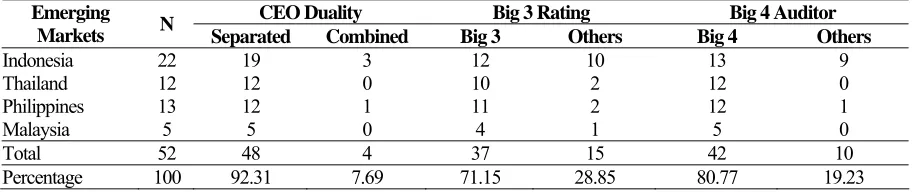
On the other hand, the number of banking firms, which falls into separated leadership, is 48 banks (92.31%) while combined leadership has 4 banks
(7.69%). The study also discovers that the CAR for all banks is above the minimum requirement (i.e. Indonesia and Malaysia are 8%; Thailand and Philippines are 10%). It is found that there are 37 banks (71.15%) with big 3 rating agencies while 15 (28.85%) banks are either rated by other rating agencies or not rated at all. There is also a significant presence of big 4 auditor where 42 (80.77%) banks are audited by big 4 external auditor while 10 (19.23%) are audited by other categories of external auditors. In detailed, we can summarize as the following table 2.
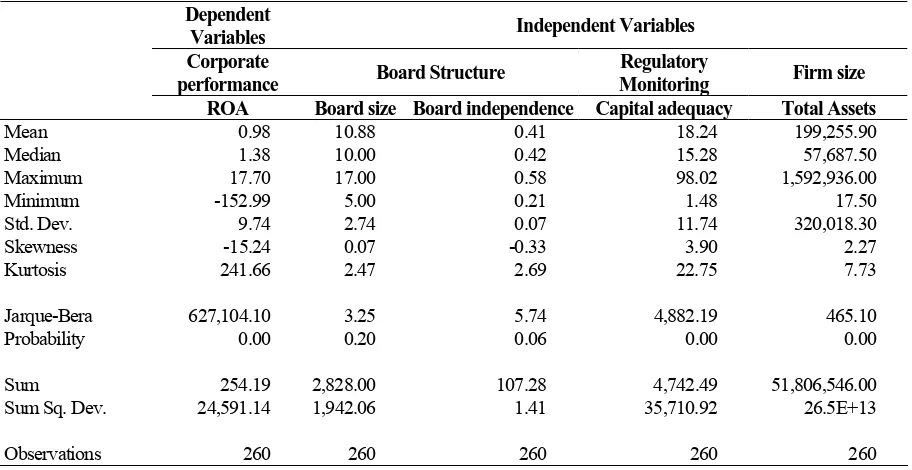
According to this following table, we can summarize all samples that are use in this paper, in terms of descriptive statistics analysis.
Corporate Governance Monitoring Mechanisms and Corporate Performance
We provide the result for the regression analysis of all corporate governance monitoring mechanisms, which presented in the following table below.
Unit Root Test
According to the theory that if our data contains of a time series data sets, the first step is to test whether our data set are stationary on particular type of testing. Meanwhile, regarding the number of observation which is the time series data set that is used in this study only 5 year (annually data), meaning that it is insufficient number to test the
Table 1. Descriptive Statistics on Ownership
Large Blockholders Foreign Shareholding Government Shareholding Emerging
Markets N At least 5% Less than 5% At least 5% Less than 5% At least 5% Less than 5%
Indonesia 22 22 0 7 15 6 16
Thailand 12 12 0 6 6 3 9
Philippines 13 13 0 11 2 2 11
Malaysia 5 5 0 3 2 1 4
Total 52 52 0 27 25 12 40
Percentage 100 100 0 51.92 48.08 23.08 76.92
Source: Author (processed)
Table 2. Descriptive Statistics on the Categorical Variable
CEO Duality Big 3 Rating Big 4 Auditor
Emerging
Markets N Separated Combined Big 3 Others Big 4 Others
Indonesia 22 19 3 12 10 13 9
Thailand 12 12 0 10 2 12 0
Philippines 13 12 1 11 2 12 1
Malaysia 5 5 0 4 1 5 0
Total 52 48 4 37 15 42 10
Percentage 100 92.31 7.69 71.15 28.85 80.77 19.23
stationary (Eviews User’s Guide, 2005). Never-theless, Eviews provide a panel unit root test, in order to test the stationary of the variables as a group. During the study, we found that as a group, the result is rejecting the null hypothesis, under the null hypothesis of no unit root, which is under the Hadri-Z test. In other word, the result is non-stationary. Therefore, we adopt the individual unit root test, using a Phillips-Perron Fisher Unit Root Test. This test defined under the null hypothesis, there is a unit root, while under the alternative hypothesis, and there is no unit root or some cross-sections without unit root.
The following tables are the result of unit root test of each variable, as follow:
Table 4. Board Independence
Null Hypothesis: Unit root (individual unit root process)
Sample: 2003 2007 Exogenous variables: None
Newey-West bandwidth selection using Bartlett kernel
Total (balanced) observations: 90 Cross-sections included: 45 (7 dropped)
Method Statistic Prob.**
PP - Fisher Chi-square 294.677 0.0000
PP - Choi Z-stat NA
Test statistic value of 'NA' due to the present of a p-value of one or zero
** Probabilities for Fisher tests are computed using an asympotic Chi-square distribution. All other tests assume asymptotic normality.
Table 5. Board size
Null Hypothesis: Unit root (individual unit root process)
Sample: 2003 2007 Exogenous variables: None
Newey-West bandwidth selection using Bartlett kernel
Total (balanced) observations: 80 Cross-sections included: 40 (12 dropped)
Method Statistic Prob.**
PP - Fisher Chi-square 260.491 0.0000
PP - Choi Z-stat -10.9780 0.0000
** Probabilities for Fisher tests are computed using an asympotic Chi-square distribution. All other tests assume asymptotic normality.
Table 6. Capital Adequacy Ratio
Null Hypothesis: Unit root (individual unit root process)
Sample: 2003 2007 Exogenous variables: None
Newey-West bandwidth selection using Bartlett kernel
Total (balanced) observations: 104 Cross-sections included: 52
Method Statistic Prob.**
PP - Fisher Chi-square 391.070 0.0000
PP - Choi Z-stat -12.5373 0.0000
** Probabilities for Fisher tests are computed using an asympotic Chi-square distribution. All other tests assume asymptotic normality.
Table 3. Descriptive Statistics on the Continuous Variable for the Full Sample
Dependent
Variables Independent Variables
Corporate
performance Board Structure
Regulatory
Monitoring Firm size ROA Board size Board independence Capital adequacy Total Assets
Mean 0.98 10.88 0.41 18.24 199,255.90
Median 1.38 10.00 0.42 15.28 57,687.50
Maximum 17.70 17.00 0.58 98.02 1,592,936.00
Minimum -152.99 5.00 0.21 1.48 17.50
Std. Dev. 9.74 2.74 0.07 11.74 320,018.30
Skewness -15.24 0.07 -0.33 3.90 2.27
Kurtosis 241.66 2.47 2.69 22.75 7.73
Jarque-Bera 627,104.10 3.25 5.74 4,882.19 465.10
Probability 0.00 0.20 0.06 0.00 0.00
Sum 254.19 2,828.00 107.28 4,742.49 51,806,546.00
Sum Sq. Dev. 24,591.14 1,942.06 1.41 35,710.92 26.5E+13
Observations 260 260 260 260 260
Table 7. Total Assets
Null Hypothesis: Unit root (individual unit root process)
Sample: 2003 2007 Exogenous variables: None
Newey-West bandwidth selection using Bartlett kernel
Total (balanced) observations: 104 Cross-sections included: 52
Method Statistic Prob.**
PP - Fisher Chi-square 339.083 0.0000
PP - Choi Z-stat -11.0887 0.0000
** Probabilities for Fisher tests are computed using an asympotic Chi-square distribution. All other tests assume asymptotic normality.
Table 8. Return on Assets (ROA)
Null Hypothesis: Unit root (individual unit root process)
Sample: 2003 2007 Exogenous variables: None
Newey-West bandwidth selection using Bartlett kernel
Total (balanced) observations: 104 Cross-sections included: 52
Method Statistic Prob.**
PP - Fisher Chi-square 356.071 0.0000
PP - Choi Z-stat -11.3408 0.0000
** Probabilities for Fisher tests are computed using an asympotic Chi-square distribution. All other tests assume asymptotic normality
The Model Estimation using Regression Analysis
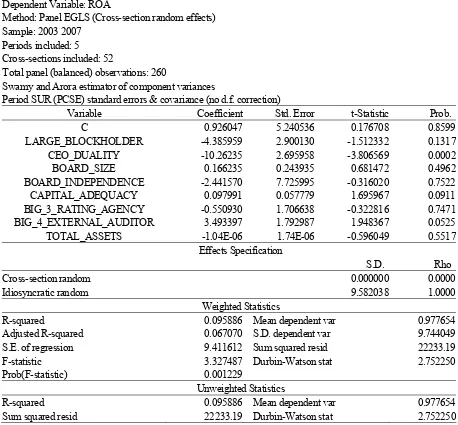
First, we run the regression for model 1, as we stated earlier, which is define the relationship between corporate governance monitoring mechanisms (independent variables), without the government and foreign ownership variables, and corporate performance (dependent variable). We construct model 1 in order to measure whether the corporate governance monitoring mechanisms, particular without the government or foreign intervention, are significantly affect the corporate performance in term on accounting-based measure (represent by ROA). We can observe in detail by the following table 9.
On table 9, we can analyze that only three variables are significantly influence ROA. There are CEO duality, with │t stat│> 2.33, which is 3.806569,
significant at 99% confidence level; Capital Adequacy Ratio, with │t stat│> 1.64, which is
1.695967, significant at 90% confidence level; and Big 4 External Auditor, with │t stat│> 1.64, which is
1.948367, significant at 90% confidence level. In other word, the result is rejecting the null hypothesis, which is no significant difference between those three variables and ROA on each confidence level.
Based on R-squared and adjusted R-squared result which are 0.095886 and 0.067070, we can analyze that the independent variables have little effect on the ROA estimation. Nevertheless, regarding the theory that it is normally of having a small R-squared and adjusted R-squared, when the data sets is contains of cross section data, therefore we can still emphasize on it as well as the other indicators on the regression result.
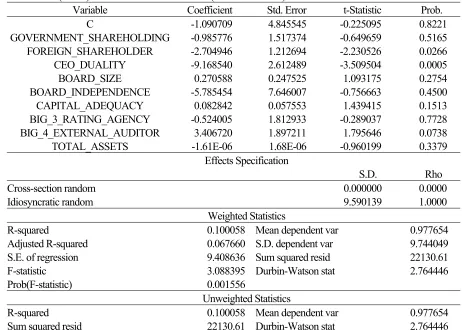
Second, we run the regression for model 2, as we stated earlier, which is define the relationship between corporate governance monitoring mechanisms (independent variables), without the large block holders ownership variables, and corporate performance (dependent variable). We construct model 2 in order to measure whether the corporate governance monitoring mechanisms, particular without the large block holders intervention, are significantly affect the corporate performance in term on accounting-based measure (represent by ROA). We can observe in detail by the following table 10
On table 10, we can analyze that only three variables are significantly influence ROA. There are foreign shareholder, with │t stat│> 1.96, which is
2.230526, significant at 95% confidence level; the CEO duality, with │t stat│> 2.33, which is 3.509504,
significant at 99% confidence level; and Big 4 External Auditor, with │t stat│> 1.64, which is
1.795646, significant at 90% confidence level. In other word, the result is rejecting the null hypothesis, which is no significant difference between those three variables and ROA on each confidence level.
Similar with the earlier explanation, we also measure the R-squared and adjusted R-squared as well. We can point out that on model 2, the R-squared is 0.100058 which is highly than model 1, respectively. As well as the R-squared result, the adjusted R-squared on model 2, which is 0.067660, slightly higher than model 1. We can summarize briefly that model 2 is better than model 1, in terms of the ability of foreign shareholders, CEO duality, and the external auditor in affecting the ROA.
Misspecification Test of the Model
misspecification test using Hausman test. According to the panel data analysis, which is used in this study, therefore we can examine whether the random effect model is appropriate instead of fixed effect models, to be able to support the analysis process precisely.
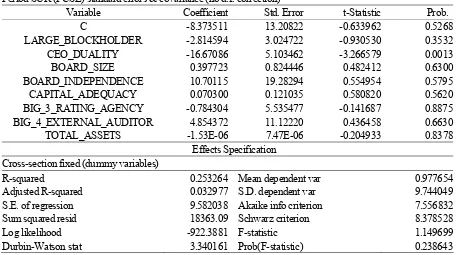
First, we run the Hausman test for model 1. The following table 11 is given in detail. Based on the result given on table 11, we can analyze that under the null hypothesis that is no misspecification on the model against the alternative hypothesis, which is, there is misspecification, the result is no evidence to reject null hypothesis. In other word, with the probability (p-value) is greater than 0.05, which is 1.0000, on 95% confidence level, and remained at 99% or 90% confidence level as well, therefore we can conclude that model 1 is appropriate under the random effect models approach, instead of fixed effect models.
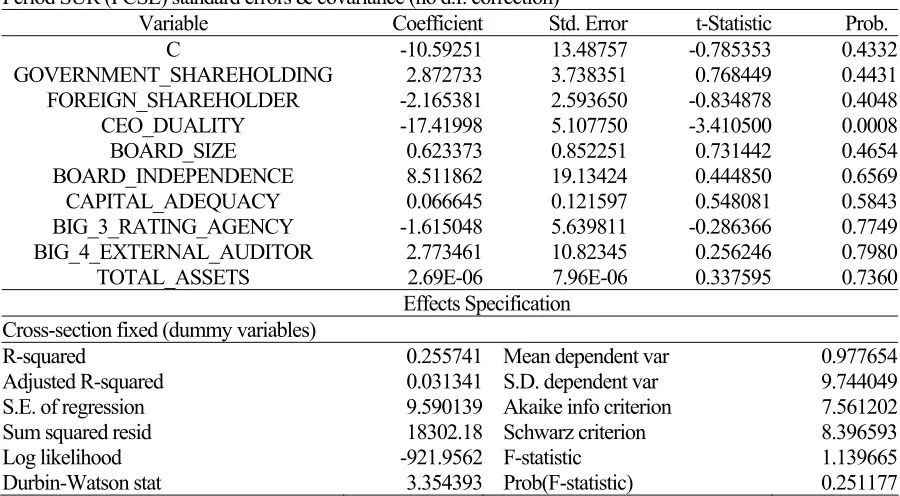
According to the result given on table 12, we can analyze that under the null hypothesis that is no misspecification on the model against the alternative hypothesis, which is, there is misspecification, the result is no evidence, as well as the model 1 result, to reject null hypothesis. In other word, with the probability (p-value) is greater than 0.05, which is 0.3004, on 95% confidence level, and remained at 99% or 90% confidence level as well, therefore we strongly suggest that model 2 is appropriate under the random effect models approach, instead of fixed effect models, as well as model 1.
Ownership Monitoring Mechanism
From the result given on table 9, we can observe that the large block holders, which is represent of the ownership, does not provide a statistically significant
Table 9. Regression Result without Government/Foreign Ownerships (Model 1)
Dependent Variable: ROA
Method: Panel EGLS (Cross-section random effects) Sample: 2003 2007
Periods included: 5 Cross-sections included: 52
Total panel (balanced) observations: 260
Swamy and Arora estimator of component variances
Period SUR (PCSE) standard errors & covariance (no d.f. correction)
Variable Coefficient Std. Error t-Statistic Prob.
C 0.926047 5.240536 0.176708 0.8599
LARGE_BLOCKHOLDER -4.385959 2.900130 -1.512332 0.1317
CEO_DUALITY -10.26235 2.695958 -3.806569 0.0002
BOARD_SIZE 0.166235 0.243935 0.681472 0.4962
BOARD_INDEPENDENCE -2.441570 7.725995 -0.316020 0.7522
CAPITAL_ADEQUACY 0.097991 0.057779 1.695967 0.0911
BIG_3_RATING_AGENCY -0.550930 1.706638 -0.322816 0.7471
BIG_4_EXTERNAL_AUDITOR 3.493397 1.792987 1.948367 0.0525
TOTAL_ASSETS -1.04E-06 1.74E-06 -0.596049 0.5517
Effects Specification
S.D. Rho
Cross-section random 0.000000 0.0000
Idiosyncratic random 9.582038 1.0000
Weighted Statistics
R-squared 0.095886 Mean dependent var 0.977654
Adjusted R-squared 0.067070 S.D. dependent var 9.744049
S.E. of regression 9.411612 Sum squared resid 22233.19
F-statistic 3.327487 Durbin-Watson stat 2.752250
Prob(F-statistic) 0.001229
Unweighted Statistics
R-squared 0.095886 Mean dependent var 0.977654
in measuring the corporate performance through ROA. Meanwhile, when foreign shareholders and government shareholders are included as proxies for ownership, particular in model 2, we found that only foreign shareholders ownership is significant in negative relationship with ROA. However, we can emphasize on whether these results are persistent with changes of time, the composition of the shareholders, in order to have a comprehensive analysis as well. a. Internal Control Monitoring Mechanism
We found that both board size and board independence in model 1 and model 2, are statistically insignificant on ROA as a proxy of corporate performance. Meanwhile, the CEO duality is significant in negative relationship in explaining the ROA, on both model 1 and model 2.
b. Regulatory Monitoring Mechanism: Capital Adequacy Ratio
The regression results showed that there is a statistically positive significant relationship between Capital Adequacy Ratio and ROA, with controlling for firm size, which is present by the total assets variable. However, it is confirmed by model 1 only.
c. Disclosure-Monitoring Mechanism
The interesting result as well as showed by the insignificant relationship between the big 3 rating agency and ROA, both on model 1 and model 2. Nevertheless, the big 4 external auditor found to have statistically significant in positive relationship with ROA. However, the result are confirmed only at 90 % significant level.
Table 10. Regression Result without Shareholders Ownership (Model 2)
Dependent Variable: ROA
Method: Panel EGLS (Cross-section random effects) Sample: 2003 2007
Periods included: 5 Cross-sections included: 52
Total panel (balanced) observations: 260
Swamy and Arora estimator of component variances
Period SUR (PCSE) standard errors & covariance (no d.f. correction)
Variable Coefficient Std. Error t-Statistic Prob.
C -1.090709 4.845545 -0.225095 0.8221
GOVERNMENT_SHAREHOLDING -0.985776 1.517374 -0.649659 0.5165
FOREIGN_SHAREHOLDER -2.704946 1.212694 -2.230526 0.0266
CEO_DUALITY -9.168540 2.612489 -3.509504 0.0005
BOARD_SIZE 0.270588 0.247525 1.093175 0.2754
BOARD_INDEPENDENCE -5.785454 7.646007 -0.756663 0.4500
CAPITAL_ADEQUACY 0.082842 0.057553 1.439415 0.1513
BIG_3_RATING_AGENCY -0.524005 1.812933 -0.289037 0.7728
BIG_4_EXTERNAL_AUDITOR 3.406720 1.897211 1.795646 0.0738
TOTAL_ASSETS -1.61E-06 1.68E-06 -0.960199 0.3379
Effects Specification
S.D. Rho
Cross-section random 0.000000 0.0000
Idiosyncratic random 9.590139 1.0000
Weighted Statistics
R-squared 0.100058 Mean dependent var 0.977654
Adjusted R-squared 0.067660 S.D. dependent var 9.744049
S.E. of regression 9.408636 Sum squared resid 22130.61
F-statistic 3.088395 Durbin-Watson stat 2.764446
Prob(F-statistic) 0.001556
Unweighted Statistics
R-squared 0.100058 Mean dependent var 0.977654
Sum squared resid 22130.61 Durbin-Watson stat 2.764446
Table 11.The Result of Hausman Test for Model 1
Correlated Random Effects - Hausman Test Equation: EQ01
Test cross-section random effects
Test Summary Chi-Sq. Statistic Chi-Sq. d.f. Prob.
Cross-section random 0.000000 8 1.0000
* Cross-section test variance is invalid. Hausman statistic set to zero. ** Warning: robust standard errors may not be consistent with assumptions of Hausman test variance calculation.
** Warning: estimated cross-section random effects variance is zero. Cross-section random effects test comparisons:
Variable Fixed Random Var(Diff.) Prob.
LARGE_BLOCKHOLDER -2.814594 -4.385959 0.738190 0.0674
CEO_DUALITY -16.670862 -10.262350 18.777138 0.1392
BOARD_SIZE 0.397723 0.166235 0.620206 0.7688
BOARD_INDEPENDENCE 10.701148 -2.441570 312.140657 0.4569
CAPITAL_ADEQUACY 0.070300 0.097991 0.011311 0.7946
BIG_3_RATING_AGENCY -0.784304 -0.550930 27.728897 0.9647
BIG_4_EXTERNAL_AUDITOR 4.854372 3.493397 120.488497 0.9013
TOTAL_ASSETS -0.000002 -0.000001 0.000000 0.9460
Cross-section random effects test equation: Dependent Variable: ROA
Method: Panel Least Squares Sample: 2003 2007
Periods included: 5 Cross-sections included: 52
Total panel (balanced) observations: 260
Period SUR (PCSE) standard errors & covariance (no d.f. correction)
Variable Coefficient Std. Error t-Statistic Prob.
C -8.373511 13.20822 -0.633962 0.5268
LARGE_BLOCKHOLDER -2.814594 3.024722 -0.930530 0.3532
CEO_DUALITY -16.67086 5.103462 -3.266579 0.0013
BOARD_SIZE 0.397723 0.824446 0.482412 0.6300
BOARD_INDEPENDENCE 10.70115 19.28294 0.554954 0.5795
CAPITAL_ADEQUACY 0.070300 0.121035 0.580820 0.5620
BIG_3_RATING_AGENCY -0.784304 5.535477 -0.141687 0.8875
BIG_4_EXTERNAL_AUDITOR 4.854372 11.12220 0.436458 0.6630
TOTAL_ASSETS -1.53E-06 7.47E-06 -0.204933 0.8378
Effects Specification
Cross-section fixed (dummy variables)
R-squared 0.253264 Mean dependent var 0.977654
Adjusted R-squared 0.032977 S.D. dependent var 9.744049
S.E. of regression 9.582038 Akaike info criterion 7.556832
Sum squared resid 18363.09 Schwarz criterion 8.378528
Log likelihood -922.3881 F-statistic 1.149699
Table 12. The Result of Hausman Test for Model 2
Correlated Random Effects - Hausman Test Equation: EQ02
Test cross-section random effects
Test Summary Chi-Sq. Statistic Chi-Sq. d.f. Prob.
Cross-section random 10.650237 9 0.3004
** Warning: robust standard errors may not be consistent with assumptions of Hausman test variance calculation.
** Warning: estimated cross-section random effects variance is zero. Cross-section random effects test comparisons:
Variable Fixed Random Var(Diff.) Prob.
GOVERNMENT_SHAREHOLDING 2.872733 -0.985776 11.672844 0.2587
FOREIGN_SHAREHOLDER -2.165381 -2.704946 5.256393 0.8139
CEO_DUALITY -17.419984 -9.168540 19.264015 0.0601
BOARD_SIZE 0.623373 0.270588 0.665064 0.6653
BOARD_INDEPENDENCE 8.511862 -5.785454 307.657869 0.4150
CAPITAL_ADEQUACY 0.066645 0.082842 0.011473 0.8798
BIG_3_RATING_AGENCY -1.615048 -0.524005 28.520746 0.8381
BIG_4_EXTERNAL_AUDITOR 2.773461 3.406720 113.547720 0.9526
TOTAL_ASSETS 0.000003 -0.000002 0.000000 0.5809
Cross-section random effects test equation: Dependent Variable: ROA
Method: Panel Least Squares Sample: 2003 2007
Periods included: 5 Cross-sections included: 52
Total panel (balanced) observations: 260
Period SUR (PCSE) standard errors & covariance (no d.f. correction)
Variable Coefficient Std. Error t-Statistic Prob.
C -10.59251 13.48757 -0.785353 0.4332
GOVERNMENT_SHAREHOLDING 2.872733 3.738351 0.768449 0.4431
FOREIGN_SHAREHOLDER -2.165381 2.593650 -0.834878 0.4048
CEO_DUALITY -17.41998 5.107750 -3.410500 0.0008
BOARD_SIZE 0.623373 0.852251 0.731442 0.4654
BOARD_INDEPENDENCE 8.511862 19.13424 0.444850 0.6569
CAPITAL_ADEQUACY 0.066645 0.121597 0.548081 0.5843
BIG_3_RATING_AGENCY -1.615048 5.639811 -0.286366 0.7749
BIG_4_EXTERNAL_AUDITOR 2.773461 10.82345 0.256246 0.7980
TOTAL_ASSETS 2.69E-06 7.96E-06 0.337595 0.7360
Effects Specification
Cross-section fixed (dummy variables)
R-squared 0.255741 Mean dependent var 0.977654
Adjusted R-squared 0.031341 S.D. dependent var 9.744049
S.E. of regression 9.590139 Akaike info criterion 7.561202
Sum squared resid 18302.18 Schwarz criterion 8.396593
Log likelihood -921.9562 F-statistic 1.139665
Corporate Governance Monitoring Mechanism of Banks and Non-Banks
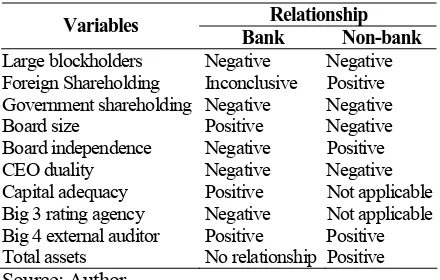
In the last part of this chapter, this study also provide the interesting finding that we are able to identify many similarities as well as differences between the relationship of corporate governance mechanisms and corporate performance, in terms of banking firms and non-banking firms. In the following table, we summarize the comparative result between bank and non-banks in detail:
Table 13. Comparative Results between Banks and Non-banks
Relationship Variables
Bank Non-bank Large blockholders Negative Negative
Foreign Shareholding Inconclusive Positive Government shareholding Negative Negative Board size Positive Negative Board independence Negative Positive CEO duality Negative Negative Capital adequacy Positive Not applicable Big 3 rating agency Negative Not applicable Big 4 external auditor Positive Positive Total assets No relationship Positive Source: Author
Even though some of the independent variables that statistically insignificant in explaining the dependent variable, but we still have a sufficient arguments to describe the relationship between each independent variable and the dependent variable, through the sign of the coefficient of each independent variable.
However, we realize that there is a limitation and less accurate to use only the sign of each coefficient of independent variable, in order to generalize the relationship with dependent variable. Therefore, in further study we strongly suggest to have a better model and analysis methodology as well as to get more information that is valuable in this particular knowledge.
SUMMARY, CONCLUSIONS AND RECOMMENDATIONS
Summary of Findings
According to the discussion in earlier, we can summarize the finding of this study given as follow: a. The large block holders, which is represent of the
ownership, does not provide a statistically significant in measuring the corporate performance through ROA.
b. The foreign shareholders ownership is statistically significant in negative relationship with ROA.
c. The board size and board independence in model 1 and model 2, are statistically insignificant on ROA as a proxy of corporate performance.
d. The CEO duality is significant in negative relationship in explaining the ROA, on both model 1 and model 2.
e. There is a statistically significant in positive relationship between Capital Adequacy Ratio and ROA,
f. There is an insignificant relationship between the big 3 rating agency and ROA, both on model 1 and model 2.
g. The big 4 external auditor found to have statistically significant in positive relationship with ROA.
Conclusions
According to the objectives of this paper, which is to identify whether there exist any differences in the monitoring mechanisms of banking firms and non-banking firms and our findings are emphasizing on a perspective of corporate governance monitoring mechanisms in the banking sectors, particular in emerging markets. In summary, this study found that only the foreign shareholder which is represent of the ownerships monitoring mechanisms are significantly negatively related with corporate performance measures in the banking firms in Asian emerging markets.
Meanwhile, the paper found that the Internal Control Monitoring Mechanisms showed the insignificant relationship with corporate performance, but only one of the internal control monitoring mechanisms which is CEO duality provides evidence in order to explain the relationship better.
The study also confirmed that the disclosure monitoring mechanisms through the big 4 external auditor is significantly related to corporate performance, instead of the big 3 rating agency. The result is a slightly difference with the expectation. However, we can extent the data and add more the information, including a better model construction, in further study.
Recommendations
We strongly suggest in a particular study in further research, that use a larger data set, including the cross-sections and time series data, in order to get more accurate and reliable in data analysis. Regarding the annually data that is used in this paper, we suggest to having a longer period, in order to be able to assess the effectiveness and the implication of the policies related to the corporate governance monitoring mechanisms as well as the corporate performance.
The last important things that should provide in the further research is that using more than one dependent variable in order to represent or as a proxy of corporate performance, instead of using ROA only. Therefore, we can expect more comprehensive and valuable knowledge from that particular study.
REFERENCES
Adams, R., & H. Mehran, 2003, Is Corporate Governance Different for Bank Holding Companies, Federal Reserve Bank of New York Economic Policy Review, Federal Reserve Bank of New York.
Bai, C., Q. Liu, J. Liu., F. Song., & J. Zhang, 2003, Corporate Governance and Market Valuation in China, Working Paper, University of Hongkong
Boubakri, N., J.C. Cosset & O. Guedhami, 2005, Postprivatization Corporate Governance: The Role of Ownership Structure and Investor Protection, Journal of Financial Economics, Vol. 76, p.369-399, Oxford: Elsevier
Brigham, E.F. & M.C. Ehrhardt, 2005, Financial
Management Theory and Practice, 11th
Edition, Ohio: South Western
Cameron & Trivedi, 2005, “Microeconometrics”, Method and Applications, Cambridge University Press
Caprio, G., L. Leuven., R. Levine, 2003, Governance and Bank Valuation, Working Paper No. 10158, National Bureau of Economic Research
Cheng, S., 2008, Board Size and The Variability of Corporate Performance, Journal of Financial Economics, Vol. 87, p. 157-176, Oxford: Elsevier
Dercon, B., 2007, Corporate Governance after the Asian Crisis-Querying the Indonesian environment, Managerial Law, Vol. 49, No. 4, p.129-140,
Eldomiaty, T.L., & C.J. Choi., 2003, Bank’s Orientation and Performance in
Stakeholders-Shareholders Business Systems. Working Paper Series. Available at SSRN: http://ssrn.com/abstract=462600
Eviews 5.1 User’s Guide, 2005, Quantitative Micro Software
Garrat, B. 2003, Why Corporate Governance Matters and How to Measure and Improve Board Performance, London: Nicholas Brealey
Greene, W.H.,2003. “Econometric Analysis”, Fifth Edition, Prentice Hall
Gujarati, D. (2003). “Basic Econometrics”. 4th ed. New York: McGraw Hill
Hausman, J.A., & W.E. Taylor, 1981, Panel Data and Unobservable Individual Effect. Econo-metrica, 49, pp. 1377-1398
Hung, B., 2007, Pooled data- Time series and Cross section Data, from: http://www.hkbu.edu.hk/ ~billhung/eviews/d.html
Lowengrub, P., T. Luedecke, & M. Melvin, 2003, Does Corporate Governance Matter in the Market Response to Merger Announcements. Financial Management Association Annual Meeting
Micco, A., U. Panizza, & M. Yanez, 2004, Bank Ownership and Performance. Working Paper Bank, No. 518. Inter American Development
Mitton, T. 2002, A Cross-firm Analysis of the Impact of Corporate Governance on the East Asian Financial Crisis, Journal of Financial Economics, 65, pp. 215-241
Niinimaki, J.P., 2001, Inter-temporal Diversification in Financial Intermediation. Journal of Banking and Finance, 25, pp 965-991
Samadian, S.M, 2005, “Governance and Risk in Emerging and Global Markets”, Palgrave Macmillan.
Wallace, P. & J. Zinkin 2005, Corporate Governance - Mastering Business in Asia, Singapore: John Wiley & Sons
Wooldridge, J.M., 2000, “Introductory Econome-trics”, South Western College
Yaffe, R, 2006, “A Primer for Panel Data Analysis”, Fifth Edition, Prentice Hall