Doi: 10.21059/buletinpeternak.v42i1.28506
Farmer
’
s Individual Potential in Different Farm Sizes of Local Beef Cattle
Farming in Kebumen Regency, Indonesia
Mochamad Sugiarto1*, Syarifuddin Nur1, Oentoeng Edy Jatmiko1, and Marti Ike Wahyu2
1Faculty of Animal Science, Jenderal Soedirman University, Purwokerto, 53123, Indonesia 2Agriculuture and Food office of Kebumen Regency, Kebumen, 54361, Indonesia
Article history
Submitted: 23 September 2017 Accepted: 25 January 2018
* Corresponding author: Telp. +62 81229142833 E-mail: [email protected]
ABSTRACT
This study aims (1) identify the farmer’s individual potential in different farm sizes and (2) analyze the relationship of basic potential, availability of man power potential, provision of production input potential, and technological mastery potential with the increasing farm size of PO Kebumen cattle. 100 respondents (breeding farmers) from 6 sub-districts known as PO Kebumen beef cattle development centers are selected using a multistage sampling method. The results of Kruskal Wallis Test explain that farmer’s individual potential of PO Kebumen beef cattle farming showed significant difference at different farm size (P<0.01). Based on the Spearman rank correlation test, the availability of technological potential and the provision of production input potential are considered as the important elements regarding to the increasing farm size of PO Kebumen beef cattle (P <0.01). The mastery of technology and the provision of production inputs are the driving factors for increasing the farm size of PO Kebumen cattle.
Keywords: Farm size, Individual potential, Production inputs, Technology
Introduction
One local commodity with highly technical, economic, and strategic potential should be developed in Kebumen Regency is Ongole Crossbred (PO) cattle. Decree of the Minister of Agriculture of the Republic of Indonesia Number 358 / Kpts / PK.040 / 6/2015 mandate to Kebumen District is one source region for local beef cattle of Ongole Crossbred (PO) species in Indonesia. Its natural potential, human resource potential, and local Government political (policies) potential are the important production inputs to encourage the development of beef cattle industry in Kebumen.
Community-based breeding farm of Kebumen PO cattle are still categorized traditional since the farmers keep limited number of cattle, simple management, non-concentrated location and no application of business orientation (Kusuma
et al., 2017). The beef cattle raised by some people is considered as their saving, by only utilizing the traditional cultivation management. The high demand for beef is actually an opportunity for the farmers to develop the local beef cattle breeding that efforts to the development of its population and productivity should be continuously conducted.
To develop Kebumen PO cattle population, the serious, systematic, and continuous handling management is required. In regards to Kebumen
community-based PO cattle breeding farm, farmer’s roles and the quality of resources are important factors for the successful breeding farm. Sofia et al. (2013) states that human capital including education and experience will improve the productivity, additional value, income and consumption. In addition, Bojnec and Latruffe (2013) states that farm size improvement obviously increases the economic efficiency of farms. Thus, farm size enlargement should be supported with the development of farmer’s ability and human resources. The improvement in farm size requires farmer to have more adequate potential. Farmer’s individual potential is theirown ability and the family to develop their own business. Human resource potential is the accumulation of competence, knowledge, and manner related to the ability in developing the economic values (Crook et al., 2011). Efforts to identify farmer’s individual potential may have the farmers of Kebumen PO cattle prepare to improve their business productivity and sustainability. This study aims at (1) identify the farmer’s individual potential in different farm sizes and (2) analyze the relationship of basic potential, availability of man power potential, provision of production input potential, and technological mastery potential with the farmer’s individual potential.
Bulletin of Animal Science
ISSN-0126-4400/E-ISSN-2407-876X Acredited: 36a/E/KPT/2016 http://buletinpeternakan.fapet.ugm.ac.id/
Materials and Methods
The study on farmer’s individual potential in different farm sizes of local beef cattle farming in Kebumen, Indonesia, involves 100 respondents who are selected using a multistage sampling method. First, the research areas are purposively selected within only 6 sub-districts along the south coast of Kebumen (Puring, Petanahan, Klirong, Bulusppesantren, Ambal and Mirit) involving 26 breeding farmer groups and population of 54,000 head of PO Kebumen cattle. The area is classified as Kebumen PO cattle development centers (Dinas Pertanian dan Pangan Kabupaten Kebumen, 2016). Second, 20 percent of the farmer groups from each district are randomly selected (6 farmer groups). 20 percent of the respondents from Kebumen PO cattle development centers are also randomly selected from each selected farmer group. Mahmud (2011) stated that the minimum sample size for a small population in a descriptive study is 20 percent of the population.
The primary data are directly collected from the respondents through observation and interview using questionnaires. The variables observed are (1) farm size (number of cattle owned by farmers in Animal Unit /AU), (2) basic potential (M1) (education, farming experience, social interaction, and non-formal education), (3) availability of man power potential (M2) which calculate number of family members use for operating breeding farm, (4) provision of production input potential (M3) which explains capacity of farmers providing number of cattle, size of housing and working capital, and (5) technological mastery potential (M4) which describe capacity of cattle farmers in providing and selecting feed, health preventing, and bull selection. Score of farmers individual potential was measured by formula 3M1+4.5M2+5M3+4M4. All these variables are measured using structured questionnaire referring to the Guideline for Analyzing Farmer’s Potential (Direktorat Jenderal Bina Produksi Peternakan, 2003). Analysis of the descriptive statistics is used to describe the degree of farmer’s individual potential. Farmer’s potential is measured by accumulating score of basic potential, provision of production input potential, provision of manpower potential, and technological mastery potential. The score of farmer’s individual potential < 436,91 is classified low, it is moderate level when the score 436,91-718,06, and the farmers classified having high individual farmer’s potential when the score is above 718,06.
Kruskal Wallis test is employed to analyze the farmer’s individual potential in different farming size.
H = Kruskal-Wallis test statistic
n = total number of observations in all samples Ti= Sum of the ranks assigned
When H (Kruskal-Wallis test statistic) is greater than Chi Square table 0.05 shows that there is a significant difference in individual farmers potential at different farm size. Meanwhile, a Spearman Correlation Rank Test is conducted to identify elements of the farmer’s individual potential related to different farm sizes.
di = difference in paired ranks and
N = number of cases.
In case, the value of rsis greater than r table
0.05, there is a significant relationship of basic potential, availability of man power potential, provision of production input potential, and technological mastery potential with the increasing farm size.
Results and Discussion
The profile of respondents
Kebumen PO cattle farming business is a combination of business orientation and culture of the people. Beef cattle farming has become a part of people’s life and economically intended to earn living for the family. All the respondents (100 percent) all the respondents make a beef cattle farming as a side business with the main job is mostly rice farmers. Meanwhile 65 percent of respondents doing business (cattle farming) to improve the family income. As raising Kebumen PO cattle has become a way of life from generation to generation, the farmers has already had adequate experience in cattle farming (23,65 years). Beef cattle farming with some technological interventions are conducted in 1-5 Animal Unit of cattle business scale(s) with an average of 1,58 Animal Unit (AU).
Based on Table 1, the business pattern on Kebumen PO beef cattle breeding performed by the farmers in their productive age at the average of 47.14 years old. The age of farmers becoming a competitive advantage to grow and sustaining the breeding cattle farm. Otieno et al. (2014) state that farmer’s age positively influences the business efficiency of beef cattle breeding pattern, the farmers in productive age having more access in tecnological knowledge and mastery.
Kebumen PO cattle farmers have completed the 9-years compulsory education meeting the Government education program (52 percent) and are literate. The average education level of Kebumen PO cattle farmers is graduated from the 9-years compulsory education (Secondary School). Xu et al. (2015) state that people with higher levels of education are better able to obtain information. The more educated the farmers, the easier the access to information, knowledge and skills, and this may stimulate more income and better livelihood.
The weaknesses in the low level of education are covered by the cattle farming experience that have been long enough. Most of
Table 1. Characteristics of respondents
Variable Mean Deviation standard
Age (years) 47.14 8.80
Educational attainment (years) 9.85 3.07
Farming experience (years) 23.65 12.31
Number of cattle (Animal Units) 1.58 0.84
the Kebumen PO cattle farmers have farming experience by the average of 23.65 years. Nwigwe
et al. (2016) state that the more the experience, the farmers may improve their efficiency in utilizing technology and the production outputs
Kebumen PO cattle farmer’s individual potential
The PO Kebumen cattle farming is done independently by the farmers who are members of the breeding farmer groups. Until 2016, PO Kebumen farmers are joined in 29 breeding farmers groups in 6 areas of PO Kebumen cattle development center. Education, farming experience, farm size, number of manpower, working capital, and technology owned by farmers varied considerably.
Efforts to increase population of cattle in Kebumen District become one of the objectives of livestock development in Kebumen. This can be done by increasing the number of PO Kebumen cattle owned by each farmer. However, the increasing number of cattle must be supported by the quality of farmer's resources. Hadrich (2011) states that the development of farmer’s resource quality may become very important due to the efforts in improving the business scale. Farmer’s resource quality may bemeasured through age, education, and business experience approaches. Hailu et al. (2014) add that the improved farm unit of cattlemay encourage farmers to adopt the technology. Farmers may find it easier with adequate age, education and experience to adopt the technology. Thus, improvement of farm size requires farmers with farming potential and capacity.
Farmer’s potential is measuring their ability and resource quality based on their basic potential, provision of production input potential, provision of
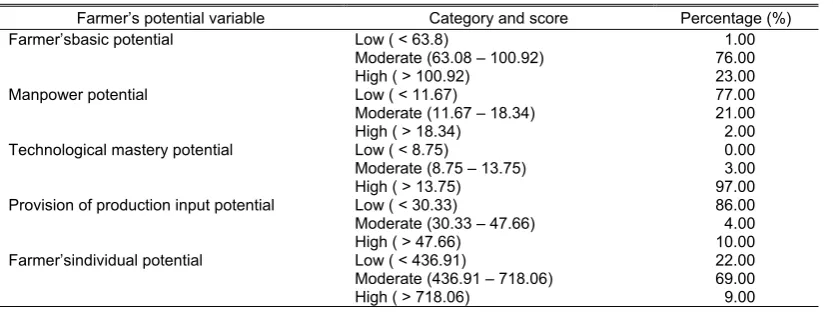
manpower potential, and technological mastery potential. The Direktorat Jenderal Bina Produksi Peternakan (2003) states that farmer’s potential is one important indicator in developing the local cattle farming. Individual farmer’s potential of PO Kebumen cattle farmers are categorized into 3 levels such as low with score of <436.91, moderate 436.91-718.06 and high> 718.06.
Kebumen PO cattle farmers have adequate individual potential which is indicated that majority of farmers (69 percent) has the moderate score of individual potential (436.91 – 718.06). Based on Table 2, in the provision of manpower and production input aspects, majority of Kebumen PO cattle farmers (86 percent) have relatively low potential.
Non-optimized availability of family manpower and non-optimally available production input of Kebumen PO cattle farmers are becoming a challenge for development of Kebumen PO cattle. On the other hand, majority of Kebumen PO cattle farmers (76 percent) have moderate basic potential and high technological mastery potential (97 percent) which may encourage an improvement to Kebumen PO cattle breeding pattern. Suroto and Nurhasan (2014) state that farmer’s basic potential and technological mastery potential may positively influence the development of beef cattle business. Sugiarto and Nur (2013) support the opinion that the development of farmer’s individual potential may improve the efficiency of livestock business.
Farmer’s individual potential in various farm sizes
Kebumen PO cattle farmers take beef cattle business as side-business in limited 1-5 Animal Unit of cattle farm size with average of 2 Animal Unit of cattle per farmer. The development
Table 2. Farmer’s individual potential (score)
Farmer’spotential variable Category and score Percentage (%)
Farmer’sbasic potential Low ( < 63.8) 1.00
Moderate (63.08 –100.92) 76.00
High ( > 100.92) 23.00
Manpower potential Low ( < 11.67) 77.00
Moderate (11.67 –18.34) 21.00
High ( > 18.34) 2.00
Technological mastery potential Low ( < 8.75) 0.00
Moderate (8.75 –13.75) 3.00
High ( > 13.75) 97.00
Provision of production input potential Low ( < 30.33) 86.00 Moderate (30.33 –47.66) 4.00
High ( > 47.66) 10.00
Farmer’sindividual potential Low ( < 436.91) 22.00
Moderate (436.91 –718.06) 69.00
High ( > 718.06) 9.00
Table 3. Farmer’s individual potential on various farm sizes
Farm size Farmers individual potential Kruskall Wallis test < 3 Animal Unit (AU) 498.25
3-4 Animal Unit (AU) 666.19 0.00** (P<0.01)
> 4 Animal Unit (AU) 771.14 ** Significance at 0.01.
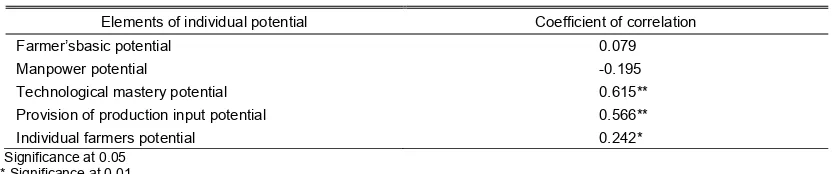
Table 4. Farmer’s individual potential elements related to cattle farm size
Elements of individual potential Coefficient of correlation
Farmer’sbasic potential 0.079
Manpower potential -0.195
Technological mastery potential 0.615**
Provision of production input potential 0.566**
Individual farmers potential 0.242*
* Significance at 0.05 ** Significance at 0.01.
of Kebumen PO cattle may be performed through adding the number of Kebumen PO cattle. Rzepka and Slusarczyk (2017) state improving competitive advantage in small business scale depend on quality of human capital. The PO Kebumen cattle farmers has good enough individual potential indicated by adequate basic farmers capacity, provision of manpower, technology mastering and production input supply.
Developing the farm size, however, may need the improvement of farmer’s ability in providing input, manpower and technology. Table 3 shows enlarging farm size is related to the individual farmers potential (P<0.05).
Improving farm size of PO Kebumen cattle farm need higher ability of farmers in providing manpower, production input and technology mastering. Rapsomanikis (2015) states that production process of small-scale farming requires limited land, financial and human capitals. Smaller size of farmers depend on off-farm unskilled workers with less knowledge and skill. Thus, the increasing farm size may influence the need for additional business capital and human capital.
Based on Kruskal Wallies test, farmer’s individual potential shows significant difference in various farm sizes (P<0.01). Individual farmers potential shows differences on different farm size, the larger farm size of PO Kebumen cattle inhabited by farmers who have better individual potential. The enlargement of farm size of Kebumen PO cattle requires the improvement of technological mastery, provision of production input and provision of manpower abilities. Akimowicz et al. (2013) state that age and experience as the farmer’s individual potential variables influence the development of business scale. In addition, Ndege (2015) state education and training, skill and technology, and capital availability influence the development of small scale business.
Farmer’s individual potential elements related
to cattle farm sizes
Basic potential, provision of production input potential, provision of manpower potential, and technological mastery potential are the primary
variables of the farmer’s individual potential. Based on spearman rank correlation analysis, it is identified that technology availability potential and provision of production input potential are important elements in causing differences in farm size (P<0.01).
Increasing Kebumen PO cattle farm size should be followed with the improved farmer’s potential in technological mastery and provision of production input. Akudugu et al. (2012) describe that farmer’s expectation to gain higher benefit will be obtained through increasing business scale. The increasing farm size should consider farmer’s mastering of available technologies and provision of production input.
Conclusion
The increasing Kebumen PO cattle farm size may be implemented effectively when farmers have adequate individual potential. Based on previous description and explanation, it can be concluded that Kebumen PO cattle farmers have adequate individual potential. The increasing Kebumen PO cattle farm size requires improvement in farmer’s potential and resources quality. The mastery of farming technology and provision of adequate production input become the main key to be taken into consideration in increasing Kebumen PO cattle farm size.
References
Akimowicz, M., M. B. Magrini, A. Ridier, J. E. Bergez, and D. R. Desjardins. 2013. What influences farm size growth? An illustration in Southwestern France. Appl. Econ. Perspect. P. 35: 242-269.
Akudugu, M. A., E. Guo, and S. K. Dadzie. 2012. Adoption of modern agricultural production technologies by farm households in Ghana: What factors influence their decisions? J. Biol. Agric. Health 2: 1-14.
Bojnec, S. and L. Latruffe. 2013. Farm size, agricultural subsidies and farm performance in Slovenia. Land Use Policy 32: 207–217.
Crook, T. R., S. Y. Todd, J. G. Combs, D. J. Woehr, and D. J. Ketchen. 2011. Does human capital matter? Ameta-analysis of the relationship between human capital and firm performance. J. Appl. Psychol. 96: 443-456.
Dinas Pertanian dan Pangan Kabupaten Kebumen. 2016. Statistik Peternakan Kabupaten Kebumen. Kebumen.
Direktorat Jenderal Bina Produksi Peternakan. 2003. Pedoman Analisis Potensi Peternak. Departemen Pertanian, Jakarta.
Hadrich, C. J. 2011. Human capital and its effect on the farm business life cycle. https://ageconsearch.umn.edu/bitstream/1 03481/2/AAEA_Hadrich_2011_13179.pdf. Accessed 28 October 2017.
Hailu, B. K., B. K. Abrha, and K. Weldegiorgis. 2014. Adoption and impact of agricultural technologies on farm income: evidence from Southern Tigray, Northern Ethiopia. Int. J. Food Agric. Econ. 2: 91-106.
Kusuma, B. S., N. Ngadiyono, and Sumadi. 2017. Estimasi dinamika populasi dan penampilan reproduksi sapi Peranakan Ongole di Kabupaten Kebumen Provinsi Jawa Tengah. Buletin Peternakan 41: 230-242. Mahmud. 2011. Metode Penelitian Pendidikan.
Pustaka Setia, Bandung.
Ndege, M. 2015. Factors that affect the growth and development of small, micro and medium-sized business enterprises in the Vaal Triangle Region of Gauteng Province in South Africa. European Journal of Business, Economics and Accountancy. 3: 73-100.
Nwigwe, C., V. Okoruwa, K. Adenegan, and A. Olajide. 2016. Technical efficiency of beef cattle production technologies in Nigeria: A stochastic frontier analysis. Afr. J. Agric. Res. 11: 5152-5161.
Otieno, J. D., L. Hubbard, and E. Ruto. 2014. Assessment of technical efficiency and its determinants in beef cattle production in Kenya. J. Dev. Agric. Econ. 6: 267-278. Rapsomanikis, G. 2015. The economic lives of
smallholder farmers: An analysis based on household data from nine countries. Food and Agriculture Organization of the United Nations, Rome.
Rzepka, A. and B. Slusarczyk. 2017. The importance of human capital in contemporary small and medium-sized companies in the opinion of managers: Pilot research in Podkarpackie Voivodeship in Poland. Jagiellonian Journal of Management 3: 51-63.
Sofia, L. A., S. Muhammad, N. Hanani, and L. Fata. 2013. Simulation model of household economy on production and welfare of catfish farmer in Banjar Minapolitan, South Kalimantan. J. Environ. Sci. Toxicol. Food Technol. 7: 1-8.
Sugiarto, M. and S. Nur. 2013. Pengembangan potensi sumberdaya peternak sebagai upaya peningkatan daya saing peternakan kambing skala mikro di Kabupaten Banyumas. Prosiding Seminar Nasional Sustainable Competitive Advantage (SCA) Fakultas Ekonomi dan Bisnis Unsoed, Purwokerto 3: 262-267.
Suroto, K. S. and Nurhasan. 2014. Pengaruh potensi peternak dalam pengembangan sapi potong di Kecamatan Damsol Kabupaten Donggala. Buana Sains 14: 11-20.
Xu, D., J. Zhang, G. Rasul, S. Liu, F. Xie, M. Cao, and E. Liu. 2015. Household livelihood strategies and dependence on agriculture in the mountainous settlements in the three gorges reservoir area, China. Sustainability 7: 4850-4869.