Does the Rabbit's Foot Actually Work? The Causal Effect of Foreign
Ownership on Firm Productivity in Three ASEAN Countries
Inggrid1*
Abstract: Voluminous studies have examined the relationship between foreign ownership and firm productivity. Two general patterns emerge at the empirical level: they are essentially correlational and results are mixed. This paper estimates the causal effect of foreign presence on a variety of productivity measures. We rely on a selection on observables approach based on the idea that all variables that influence foreign ownership status and firm productivity are fully captured by the available control variables, eliminating the problem of selection bias. Using firm-level data from three ASEAN countries, the study finds that productivity of foreign-owned firms is consistently above that of domestically-owned firms regardless of different productivity measures and types of matching algorithms. This result suggests to a large extent the benefits of foreign participation in the economy.
Keywords: Foreign ownership, productivity, causal effect, selection on observables.
Introduction
The flow of foreign direct investment (FDI), especially to developing countries, has grown in importance in the last three decades. The theoretical literature, however, has highlighted a number of channels through which foreign investment inflows will be beneficial to the recipient country. One strand of the literature focuses on the FDI-growth nexus. The model predicts a robust positive correlation between FDI and the host country's growth. It appears that foreign investments will not only increase capital accumulation but also generate positive externalities and improve the host's country technology which in turn leads to higher rates of aggregate productivity and economic growth. A large number of empirical studies seem to support this endogenous growth hypothesis (Alfaro et al. [1];
Barrell and Pain [2]; Borensztein et al. [3]; Cippolina
et al. [4]; de Mello [5]; Durham [6]).
Apart from macro-economic perspectives, a vast empirical literature which uses a single- developing country study has been devoted to explore the micro-economic effects of foreign ownership. They typically give considerable attention to the differences between domestically and foreign-owned firms in terms of productivity gaps and spillover effects. The general results indicate that the impacts of FDI are not uniform across firms. They certainly depend on industry or/and firm characteristics and types of foreign investments (Blomström and Sjöholm [7]; Jordaan [8]; Kugler [9]; Waldkirch and Ofosu [10]).
1 Faculty of Economics, Business Management Department, Petra
Christian University. Jl. Siwalankerto 121-131, Surabaya 60236. Email: [email protected]
* Corresponding author
Another notable aspect is that the existing empirical evidence does not sufficiently address the endo-geneity of FDI (e.g. foreign investments may flow into more productive industries or firms) and omitted variables (e.g. the presence of particular shocks that directly influences firm productivity). Thus, such studies are unable to convincingly establish a causal relationship between FDI inflows and outcomes of interest.
To fill the above mentioned gaps, recent studies follow the literature on micro-econometric evaluation to offer new insights into the causal effects of foreign investments on firm performance (Alfaro and Chen [11]; Arnold and Javorcik [12]; Girma and Görg [13]; Girma et al. [14]; Xu and Sheng [15]). Despite the methodological merits of the papers, the empirical evidence is still conclusive. There also remains a question whether the findings from these studies can be extrapolated under different contexts.
Given that the available dataset is essentially cross-sectional; our strategy is to control for observables differences between the foreign and domestic firms by employing matching algorithms. These methods allow us to create a missing counterfactual of each foreign-owned firm. In the exercise, we pair up each foreign firm with a domestic firm that has similar observable characteristics and operates in the same country and year. Similarities are identified from firm-level attributes that are able to predict the foreign ownership status of a firm. Finally, the causal effect of foreign ownership is measured by the average difference in productivity between foreign-owned firms and their domestic matches.
The remainder of this paper is organized as follows. The next section provides a detailed description of the dataset and an overview of the empirical strategy. It is followed by the description of the used variable in the main analysis and the discussion of the main findings. The final section concludes
Methods
Data
Our dataset comes from the Enterprise Survey conducted by the World Bank. The main objectives of the survey are to provide comprehensive business environment indicators and identify major obstacles to private sector development and employment creation. The survey collects detailed information on firm characteristics, including ownership structures, dimensions of external business environment (i.e. suppliers, competitors, consumers, infrastructure, crime, and government relations), a wide range of issues in the internal business environment (i.e. physical resources and capabilities, such as land ownership, quality of human resources, labor unions, and firm capacity), and firm performance. The main advantage of the survey is the use of a standardized questionnaire to collect the data which facilitates researchers to conduct a comparable cross-country study. Registered firms are selected through a stratified random sampling procedure. They are stratifies based on size, industrial sector (manufac-turing and services sectors in particular), and geographical location within a country, afterward firms are randomly sampled within these strata.
We restrict our sample to only manufacturing firms in Indonesia, the Philippines, and Vietnam in 2009 because the used dataset is richer for this business sector. After the data cleaning process, it yields 493 observations (32.50%) for Indonesia, 562 obser-vations (37.05%) for the Philippines, and 462 observations (30.45%) for Vietnam, leaving us with a total of 1,157 observations.
Our outcomes of interest are firm productivity which is measured in two different ways. First, it measures as multi-factor productivity or total factor produc-tivity (TFP). To do so, we use a Cobb-Douglas production function with three input factors, that is, labor, capital, and material inputs. We assume that the function has constant returns to scale.
We can express a log-linearized version of the measures of output, wherein the latter is obtained by subtracting the total sales from the total cost of material and intermediate inputs. The measure of labor input is represented by the compensation of labor, including wages, salaries, bonuses, social security payments. We use the net book value of fixed assets after depreciation as the proxy for physical capital. The input of materials is calculated from the total cost of raw and intermediate goods.
The second measure of our firm-level productivity is partial-factor productivity which consists of labor productivity and materials productivity. Labor productivity is measured as the ratio of firm sales to labor, whereas the productivity of materials is calculated as the ratio of firm sales to material inputs. All variables in local currency are converted to U.S. dollars and then deflated with a U.S. GDP deflator by using data from the World Development Indicators database. We also transform our partial productivity measures into the logarithmic form because the two variables are heavily skewed to the right.1
Indeed, the basic question in this current study is that: To what extent firm productivity differentials are explained by foreign presence in an industry. For this purpose, we simply model the participation of foreign firms in the manufacturing sector as a binary treatment variable. It takes a value of one for a firm with foreign owners and zero otherwise.
We also control for firm characteristics, such as firm age (in logs), the number of permanent employees (in logs), the share of sales that is exported, and a series of dummy variables that are supposed to be significant determinants of productivity in the literature. The latter consists of firm size (20-99 employees or medium and more than 99 employees or large), the educational attainment of production workers (secondary and university), the level of capacity utilization (if a firm operates with a minimum of 50% of its capacity), whether a firm imports material inputs, and the use of foreign-licensed technology.
Empirical Strategy: The Propensity Score Matching (PSM)
We are interested in estimating the effect of foreign ownership on firm productivity. The idea is to compare the productivity of firm in country if this firm is foreign-owned ( ) and if the firm is not foreign-owned ( ). Thus, the causal effect of foreign ownership can be stated as:
(2)
The fundamental problem with equation (2) is that we are only able to observe one of these two potential outcomes. The missing outcome is well-known as a counterfactual outcome. The standard approach to solve this problem is to look at the average effect of foreign ownership ( ) instead of the individual effect.
As mentioned earlier, we consider the status of firm ownership as a binary treatment with the treatment indicator equals one if individual firm in country is foreign-owned and zero otherwise. We may define the average treatment effect of foreign ownership as follows (Caliendo and Kopeinig [18]):
|
| | (3)
where the last term of the right-hand side of equation (3) is not directly observed, but we can substitute this part with the mean outcome of domestic firms, | . Nevertheless, in a non-experimental study like us, this substitution method is more likely to lead to the so-called a self-selection bias. Under this setting, the productivity of foreign and domestic firms would be different even without foreign ownership.
The self-selection bias itself is identified on the left-hand side of the following equation:
| |
| | (4) Thus, our challenge is to remove this bias
Matching is one of promising techniques to control for the selection bias. The key identifying assump-tion in the matching method is that outcomes are independent of treatment assignment conditional on a set of observable covariates , or:
| (5)
The above condition refers to the conditional independence assumption (CIA) of Rosenbaum and Rubin [19]. Yet, this exact matching becomes problematic if there are many covariates, especially if they are continuous variables. In spite of this, as long as the CIA assumption continues to hold, we can use the propensity scores of (the probability of being a foreign-owned firm conditional on observable characteristics of ) rather than themselves, when performing the matching (Rosenbaum and Rubin [19]).
Additionally, the propensity score matching (PSM) method requires substantial overlap in the distributions of the observed variables for foreign- and domestically-owned firms, where:
| (6)
According to this common support condition, firms have positive probabilities of being both foreign and domestic firms if they have the same scores.
Finally, the average treatment effect of foreign ownership based on the PSM approach is calculated as the mean difference in outcomes over common support,
| |
| (7)
In fact, aside from the general form of the PSM method in equation (7), there are several types of matching algorithms which are different with regard to the definition of neighborhoods for each treated individual firm, the used approach to identify the common support region, and the weighting procedure for neighborhoods. Because no single PSM estimator can provide a satisfactory answer, we opt to perform four different matching algorithms aiming at checking the sensitivity of our results.
Results and Discussions
observable firm characteristics. We then use the obtained propensity score to estimate the missing counterfactual for each foreign-owned firm and calculate our causal effect of interest.
Descriptive Analysis
Table 1 reports the factor elasticities obtained for each country sample based on the two different measures of output, sales and value added, respectively. We can highlight three distinct aspects from these results. First, as expected, the sum of ,
, and is very close to one for each country.
Second, while the contribution of material inputs to sales are the largest among the two other factors, labor inputs become the most important factor to the value-added output. Third, the manufacturing sector in those countries is considered to be the least capital intensive, where the share of capital is the lowest in the Philippines with a value of 0.0652, meaning that a 10% increase in capital is associated with a 0.65% increase in output (sales).
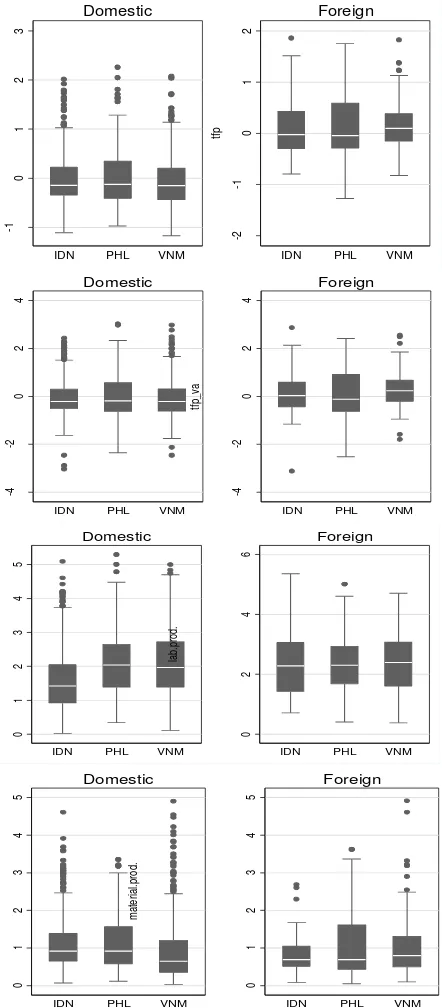
Figure 1 displays the distributions of the productivity variables by country and ownership status. In general, it is suggested that the Philippines exhibits the largest heterogeneity, while the productivity of Indonesian firms is relatively homogenous. This implies that the number of firms with very high or very low productivity in the Philippines is higher than the number in the other two countries. However, it should be noted that this country also becomes the best performing country among Indonesia and Vietnam. Turning to the ownership status, foreign-owned firms in all countries under study show remarkably higher levels of productivity than domestically-owned firms, except for the measure of material productivity in Indonesia.
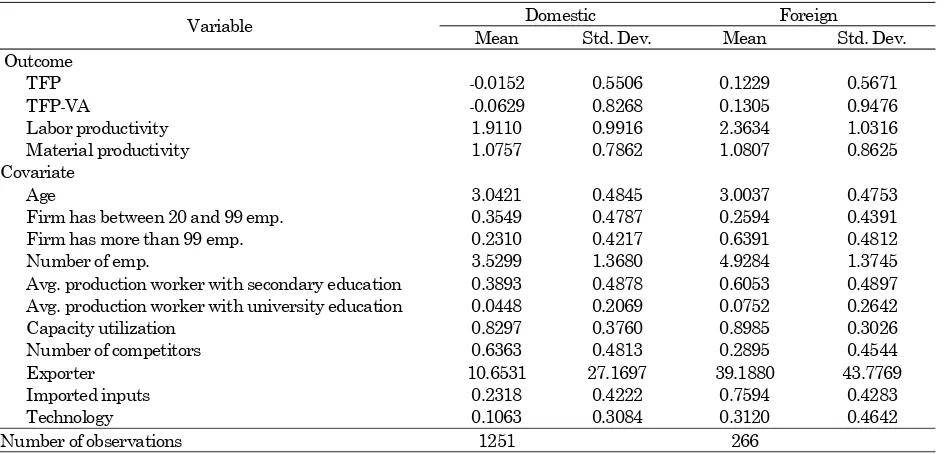
Table 2 gives some summary statistics of the outcomes and the firm characteristics by ownership status. On average, firms with foreign shares experience higher productivity levels compared with domestic firms. It is also revealed a sizeable labor productivity premium of foreign firms. The labor productivity rate of foreign-owned firms is 0.45% higher than domestically-owned firms.
Table 1. Estimated input elasticities
Sales
Indonesia 0.2833 0.0807 0.6110 Philippines 0.3334 0.0652 0.5758
Vietnam 0.3767 0.1074 0.5088
Value Added
Indonesia 0.4513 0.1029 0.3993 Philippines 0.5634 0.0929 0.3031
Vietnam 0.6567 0.1217 0.2061
Figure 1. Distributions of the productivity variables
The table also demonstrates that foreign firms are slightly older and have more permanent employees. When it comes to the firm size, a large number of domestically-owned firms fall under the medium category (35.49%), whereas the majority of foreign-owned firms are large firms (63.91%). Moreover, the exercise confirms that the educational attainment of production workers in foreign firms is relatively higher than their domestic firm counterparts. In contrast to the usual picture of firms in developing countries, a large proportion of foreign and domestic firms in the sample do not underutilize their production capacity. Another striking difference
between the two groups comes from the rivalry among existing firms in which 63.63% domestically-owned firms report that they face intense compe-tition in the industry. Foreign firms largely engage in international trade activities with more than one third of these firms (39.19%) sell their product abroad and roughly 75.94% of them use imported material inputs. Likewise, foreign firms license foreign technology more than domestic firms (31.20% versus 10.63% respectively).
Estimated Propensity Scores and the Quality of Matching
The estimates of the probability of being foreign-owned will help us to determine the covariates that should be included in the model. Table 3 presents
the results from the estimated logit model. It is clearly shown that the coefficients of all variables are statistically significant with the exception of the number of employees, but more importantly, they have the expected signs.
In particular, firms that are young, fall into the category of medium or large-sized, have workers with higher levels of educational attainment, more utilize their production capacity, confront with fewer competitors, export their products, import their material inputs, and license their foreign technology are more likely to be owned by foreigners. Our results suggest that we should take into conside-ration these variables when specifying the propen-sity score function.
Table 2. Summary statistics by ownership status
Variable Domestic Foreign
Mean Std. Dev. Mean Std. Dev. Outcome
TFP -0.0152 0.5506 0.1229 0.5671
TFP-VA -0.0629 0.8268 0.1305 0.9476
Labor productivity 1.9110 0.9916 2.3634 1.0316
Material productivity 1.0757 0.7862 1.0807 0.8625
Covariate
Age 3.0421 0.4845 3.0037 0.4753
Firm has between 20 and 99 emp. 0.3549 0.4787 0.2594 0.4391
Firm has more than 99 emp. 0.2310 0.4217 0.6391 0.4812
Number of emp. 3.5299 1.3680 4.9284 1.3745
Avg. production worker with secondary education 0.3893 0.4878 0.6053 0.4897 Avg. production worker with university education 0.0448 0.2069 0.0752 0.2642
Capacity utilization 0.8297 0.3760 0.8985 0.3026
Number of competitors 0.6363 0.4813 0.2895 0.4544
Exporter 10.6531 27.1697 39.1880 43.7769
Imported inputs 0.2318 0.4222 0.7594 0.4283
Technology 0.1063 0.3084 0.3120 0.4642
Number of observations 1251 266
Table 3. Logistic regression of ownership status on covariates
Variable Coefficient Std. Error. z p-value 95% CI
Constant -2.1378*** 0.6374 -3.3500 0.0010 -3.3871 -0.8884
Age -0.7878*** 0.1807 -4.3600 0.0000 -1.1420 -0.4335
Firm has between 20 and 99 emp. 0.5836** 0.2706 2.1600 0.0310 0.0532 1.1140 Firm has more than 99 emp. 0.8795*** 0.3437 2.5600 0.0100 0.2060 1.5531
Number of emp. 0.1534 0.0973 1.5800 0.1150 -0.0373 0.3441
Avg. production worker with 1.0171*** 0.1819 5.5900 0.0000 0.6606 1.3737 secondary education
Avg. production worker with 0.9207 0.3532 2.6100 0.0090 0.2284 1.6129 university education
Capacity utilization 0.5052* 0.2676 1.8900 0.0590 -0.0193 1.0297 Number of competitors -0.8547*** 0.1960 -4.3600 0.0000 -1.2389 -0.4706
Exporter 0.0083*** 0.0026 3.2200 0.0010 0.0032 0.0133
Imported inputs 1.5771*** 0.1849 8.5300 0.0000 1.2147 1.9396
Technology 0.6877*** 0.1939 3.5500 0.0000 0.3076 1.0678
Number of observations = 1517, LL = -482.829, LR �2(11) = 442.910, Pseudo �2 = 0.314
Figure 2. Common Support Condition
The estimated output shows that the mean of the estimated propensity scores function is 0.1753, and it displays high variability with the value of the standard deviation is 0.2156. We also plot the distribution of the scores of foreign-owned firms and the same distribution of the rest of the sample in the same graph to test whether the common support assumption is consistently fulfilled (Figure 2). The violation of this condition implies that there is high covariate heterogeneity among domestic firms. Consequently, the comparison of this group will be difficult. From the figure, we can clearly see that the region of common support between domestic and foreign firms is sufficiently high, ranging from 0.0143 to 0.8447 (or about 84.47%). Finally, we are
also able to satisfy the balancing property at the 0.01 level with the final number of blocks is 6.
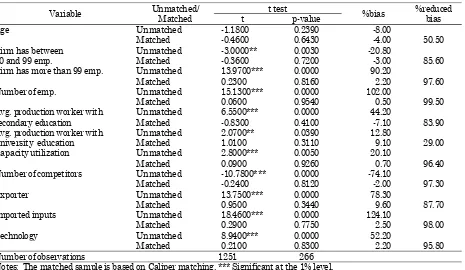
For all covariates in the model, we also test if there are significant differences in means between foreign and domestic firms. Table 4 reprints the results of this exercise. Prior to matching (unmatched), the majority of t-statistics are statistically significant at either 1% or 5% levels with the exception of firm age. These findings indicate that the distribution of the used covariates is clearly unbalanced. However, by the matching procedure (matched), we cannot reject the null hypothesis that the mean values of the two groups of firms do not differ for any variable. The corresponding t-values suggest that the matching is able to noticeably reduce the observable differences between foreign-owned firms and domestically-owned firms. The method also reduces much of the bias attributable to these differences. In other words, the estimated propensity scores successfully balance our covariates in our matched sample.
Estimated the Effects of Foreign Ownership
The final step of our analysis is to estimate the average causal effect of foreign ownership on the measures of productivity. In this paper, we use four different matching algorithms. In addition, we also compare the matching results with those from the OLS analysis. Apart from the dummy for foreign ownership, we regress our outcomes of interest on the same covariates used in the logistic regression above.
0
5
10
15
0
5
10
15
0 .1 .2 .3 .4 .5 .6 .7 .8 .9
Domestic
Foreign
Estimated Propensity Scores
Table 4. Balance in covariates before and after matching: t-statistics for equality of means
Variable Unmatched/
Matched
t test
%bias %reduced bias
t p-value
Age Unmatched -1.1800 0.2390 -8.00
Matched -0.4600 0.6430 -4.00 50.50
Firm has between Unmatched -3.0000** 0.0030 -20.80
20 and 99 emp. Matched -0.3600 0.7200 -3.00 85.60
Firm has more than 99 emp. Unmatched 13.9700*** 0.0000 90.20
Matched 0.2300 0.8160 2.20 97.60
Number of emp. Unmatched 15.1300*** 0.0000 102.00
Matched 0.0600 0.9540 0.50 99.50
Avg. production worker with Unmatched 6.5500*** 0.0000 44.20
secondary education Matched -0.8300 0.4100 -7.10 83.90
Avg. production worker with Unmatched 2.0700** 0.0390 12.80
university education Matched 1.0100 0.3110 9.10 29.00
Capacity utilization Unmatched 2.8000*** 0.0050 20.10
Matched 0.0900 0.9260 0.70 96.40
Number of competitors Unmatched -10.7800*** 0.0000 -74.10
Matched -0.2400 0.8120 -2.00 97.30
Exporter Unmatched 13.7500*** 0.0000 78.30
Matched 0.9500 0.3440 9.60 87.70
Imported inputs Unmatched 18.4600*** 0.0000 124.10
Matched 0.2900 0.7750 2.50 98.00
Technology Unmatched 8.9400*** 0.0000 52.20
Matched 0.2100 0.8300 2.20 95.80
Number of observations 1251 266
Referring to Table 5, we can generally underscore superior performance for foreign-owned firms, especially labor productivity. The obtained point estimates also suggest a downward bias of the OLS estimators. Among the four measures of firm productivity, we find that the estimates of the average treatment effect of foreign ownership on total factor productivity (sales) and labor produc-tivity turn to be statistically and economically signi-ficant, regardless our different analytical methods. On average, foreign firms have higher total factor productivity relative to domestic firms with the effect size is from approximately 10.36% (for local linear matching) to 16.15% (for nearest neighbor matching). The effect on labor productivity is even stronger. Again, the foreign presence increases the productivity of their workers from 23.70% (for local linear matching) to 35.57% (for nearest neighbor matching), whereas the OLS coefficient (21.90%) seems to somewhat underestimate the effect of foreign ownership.
In contrast, the empirical findings indicate that the impact of foreign ownership on the two other productivity measures are not statistically distingui-shable from zero. Yet, we shed light the relatively large effect of foreign ownership on the measure of total factor productivity based on value-added, ranging from 9.22% (for local linear matching) to 18.94% (for nearest neighbor matching), but they are imprecisely estimated.
Conclusion
This paper has provided new insights on the role of foreign ownership in the three ASEAN countries (Indonesia, the Philippines, and Vietnam) on firm productivity. We are able to address the problem of selection bias that may potentially jeopardize the empirical results. Overall, our results demonstrate a positive impact of foreign ownership on firm
productivity. Looking at the measure of multi-factor productivity, foreign-owned firms consistently exhibit higher levels of total factor productivity than domestically-owned firms. However, only the measure of total-factor productivity based on sales is statistically distinguishable from zero. Among the two measures of partial-factor productivity, a larger significant effect of foreign ownership is to be found in the productivity of labor. On the contrary, we reveal that the presence of foreign firms is statistically insignificant and has a marginal effect on the productivity of material inputs. These findings are robust to a number of different matching estimators. At last, given the availability of detailed data on the ownership status, we can extent this current work by allowing for a continuous treatment variable and assessing the impact of varying degrees of foreign ownership on firm performance.
References
1. Alfaro, L., Chanda, A., Kalemli-Ozcan, S., and Sayek, S., FDI and Economic Growth: The Role of Local Financial Markets, Journal of Inter-national Economics, 64(1), 2004, pp. 89–112. 2. Barrell, R., and Pain, N., Foreign Direct
Invest-ment, Technological Change, and Economic Growth within Europe, Economic Journal,
107(445), 1997, pp. 1770-1786.
3. Borensztein, E., De Gregorio, J., and Lee, J.W., How Does Foreign Direct Investment Affect Economic Growth? Journal of International Economics, 45(1), 1998, pp. 115-135.
4. Cippolina, M., Giovannetti, G., Pietrovito, F., and Pozzolo, A.F., FDI and Growth: What Cross-Country Industry Data Say, World Economy, 35(11), 2012, pp. 1599-1629.
5. de Mello, L.R., Foreign Direct Investment-Led Growth: Evidence from Time Series and Panel Data, Oxford Economic Papers, 51(1), 1999, pp. 133-151.
Table 5. Results for the effect of foreign ownership on firm productivity
Outcome TFP TFP-VA Labor
productivity
Material productivity
Regressiona 0.1098** 0.1188 0.2190** 0.0265
(0.0452) (0.0735) (0.0839) (0.0659)
Nearest neighbor 0.1615** 0.1894 0.3557** 0.0761
(0.0714) (0.1138) (0.1371) (0.1029)
Caliper (radius=0.01) 0.1339** 0.1357 0.3134*** 0.0170
(0.0523) (0.0831) (0.0946) (0.0765)
Local linear (bandwidth =0.01) 0.1036** 0.0922 0.2370** -0.0048
(0.0511) (0.0809) (0.0925) (0.0752)
Kernel (bandwidth =0.02) 0.1155** 0.1131 0.2524 0.0085
(0.0496) (0.0787) (0.0897) ** (0.0731) Notes: Number of observations = 1,517. Standard errors in parentheses.
*** Significant at the 1% level. ** Significant at the 5% level. * Significant at the 10% level.
6. Durham, J.B., Absorptive Capacity and the Effects of FDI and Equity Foreign Portfolio Investment on Economic Growth, European Economic Review, 48(2), 2004, pp. 285–306. 7. Blomström, M., and Sjöholm, F., Technology
Transfer and Spillovers: Does Local Partici-pation with Multinationals Matter? European Economic Review, 43(4-6), 1999, pp. 915-923. 8. Jordaan, J.A., Determinants of FDI-Induced
Externalities: New Empirical Evidence for Mexican Manufacturing Industries, World Development, 33(12), 2005, pp. 2103-2118. 9. Kugler, M., Spillovers from Foreign Direct
Investment: Within or Between Industries?
Journal of Development Economics, 80(2), 2006, pp. 444-477.
10. Waldkirch, A., and Ofosu, A., Foreign Presence, Spillovers, and Productivity: Evidence from Ghana, World Development, 38(8), 2010, pp. 1114-1126.
11. Alfaro, L., and Chen, M.X., Surviving the Global Financial Crisis: Foreign Ownership and Esta-blishment Performance, American Economic Journal: Economic Policy, 4(3), 2012, pp. 30-55. 12. Arnold, J.M., and Javorcik, B.S., Gifted Kids or
Pushy Parents? Foreign Direct Investment and Plant Productivity in Indonesia, Journal of International Economics, 79(1), 2009, pp. 42-53.
13. Girma, S., and Görg, H., Multinationals’ Produc -tivity Advantage: Scale or Technology? Eco-nomic Inquiry, 45(2), 2007, pp. 350–362.
14. Girma, S., Gong, Y., Görg, H., and Lancheros, S., Estimating Direct and Indirect Effects of Foreign Direct Investment on Firm Productivity in the Presence of Interactions between Firms,
Journal of International Economics, 95(1), 2015, pp. 157-169.
15. Xu, X., and Sheng, Y., Productivity Spillovers from Foreign Direct Investment: Firm-Level Evidence from China, World Development, 40(1), 2012, pp. 62-74.
16. Uttama, N.P., and Peridy, N., The Impact of Regional Integration and Third-Country Effects on FDI: Evidence from ASEAN, ASEAN Economic Bulletin, 26(3), 2009, pp. 239-252. 17. Findlay, R., Relative Backwardness, Direct
Foreign Investment, and the Transfer of Technology: A Simple Dynamic Model, Quar-terly Journal of Economics, 92(1), 1978, pp. 1-16. 18. Caliendo, M., and Kopeinig, S., Some Practical
Guidance for the Implementation of Propensity Score Matching, Journal of Economic Surveys, 22(1), 2008, pp. 31-72.