The 3rd International Symposium for Sustainable Humanosphere (ISSH)
A Forum of Humanosphere Science School (HSS) Bengkulu, 17 -18 September 2013
COMPARISON OF MONTHLY PRECIPITATION FROM RAIN-GAUGE
AND TRMM SATELLITE OVER PALEMBANG DURING 1998-2008
Muhamad Nur
1* and Iskhaq Iskandar
1,21
Department of Physics, Faculty of Mathematics and Natural Science, University of Sriwijaya
2
Also at Environmental Research Center, University of Sriwijaya
Jl. Raya Palembang-Prabumulih, KM.32, Inderalaya, Ogan Ilir, Sumatra Selatan, INDONESIA
*Corresponding author: [email protected]
Abstract
This study has compared monthly precipitations from in-situ observation in the Palembang city and those derived from Tropical Rainfall Measuring Mission (TRMM) for a period of January 1998 - December 2008. This study used two rain gauges, in the Sultan Mahmud Badaruddin II (SMB) and Kenten station. A statistical analysis, includes a correlation analysis, a Mean Bias Error (MBE) and a regression analysis, was employed in this study. The result shows that the TRMM data significantly correlates with rain gauges data. The coefficient correlation between TRMM data and SMB data and also Kenten data were 0.7366 and 0.6556, respectively. However, the TRMM data underestimate the rain gauges data. The monthly correlation between TRMM data and the rain gauges data also indicates significant correlation (r > 0.5 significant at 95%), except during February when the correlation fall down the significant level (r = 0.1097). In general, the TRMM data can be used to replace the rain gauges data after taking into account the errors.
Keywords: Correlation Coefficient, Kenten Precipitation, Sultan Mahmud Badaruddin II Precipitation, and TRMM Precipitation.
Introduction
Precipitation is one of the major components of the global hydrological cycle that maintains the terrestrial, atmospheric and oceanic water balance. Variations in precipitation may have serious effects on global water cycle, climate changes and societal activities [1]. In Indonesia, rainfall variations have a major impact on the local agriculture and fresh water supply for human consumption. Excess rainfall causes severe flooding, property and lives loss.
A better understanding of the spatial and temporal rainfall distributions would be essential in estimating crop water uses, the water available for direct human consumption and water resource management, assessing efficient irrigation and understanding the ecosystem. Also, accurate monitoring and prediction of rainfall would help reduce property damages and lives loss that may occur from flooding.
The basic rain measuring instruments have been the rain gauges. However, Rain gauges provide only point measurements in limited areas. Remote sensing techniques, such as those using radar or satellites are great complements for monitoring rainfall over large areas.
Accurate temporal knowledge of global precipitation is essential for understanding the multi-scale interactions among weather, climate and ecological systems, as well as for improving our ability to manage freshwater resources and predict high-impact weather events including hurricanes, floods, droughts and landslides [2].
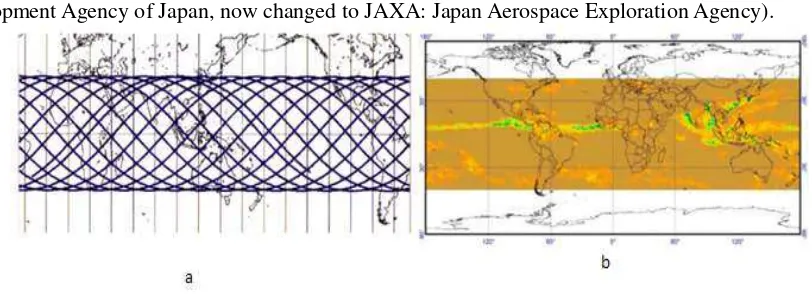
Development Agency of Japan, now changed to JAXA: Japan Aerospace Exploration Agency).
Figure 1 (a) Orbit and (b) TRMM-satellite coverage (Source:http://trmm.gsfc.nasa.gov)
TRMM is designed to measure rainfall (precipitation) in the tropics and its variations from a low inclination orbit, combined with a set of high-tech sensors to overcome the limitations of the use of the previous sensor. Inclination is the angle between the reference plane to the field measured slope. Inclination is commonly used in astronomy to describe the shape and orientation of the orbits of celestial bodies. Natural and artificial satellites inclination measured by the surrounds of celestial bodies. TRMM satellite was launched on 27 November 1997 at 6:27 am and was taken by the Japanese H-II rocket in the center of the rocket launch station owned by JAXA(Japan Aerospace Exploration Agency) in Taneghasima, Japan. TRMM carries five sensor that are PR, TMI, VIRS, CERES (Clouds and the Earth's Radiant Energy System), and LIS (Lightning Imaging Sensor), but that is often used to take only two types of rainfall data are PR and TMI sensors [3].
TRMM is a program for long-term research that is designed for the study of land, sea, air, ice, and a total system of life on earth [4]. TRMM is able to observe the structure of the rain, the amount and distribution in the tropics and sub-tropics area who an important role to determine the mechanisms of global climate change and monitoring the environmental variation.
Precipitation data generated by the TRMM had type and quite diverse shapes starting from level 1 to level 3 [5]. Level 1 is the data that is still in raw form and has been calibrated and geometrically corrected, Level 2 is an overview of the data that has had rain geophysical parameter sat the same spatial resolution but still in original condition when the satellite is the rain pass through the area were recorded, while level 3 is the data that has values of rainfall, monthly rainfall conditions in particular is an amalgamation of rain from a rain to get the data in the form of a millimeter (mm) should use level 3with a spatial resolution of 0.25°x0.25°. Temporal resolution is every three hours.
Materials and Methods / Experimental
The monthly precipitation data were obtained by Tropical Rainfall Measuring Mission (TRMM) and Other satellite monthly 0.25° x 0.25° rainfall data product (3B43 Version 7) and The monthly rain gauges data were obtained from the Indonesian Meteorology, Climatology and Geophysics Agency (BMKG) office for the Palembang region, in the Sultan Mahmud Badaruddin II (SMB) airport and Kenten station cover the period from 1998 to 2008.
Rain gauges data were compared with monthly TRMM data using statistical scores such as RMSE, MBE, MAE, regression, correlation coefficient, and significant values. Monthly rain gauges data and TRMM data were sorted then compared to obtain correlation coefficient.
Linear Correlation
Correlation analysis is an analysis of the relationship between the independent variable, for example x with a variable that is not free, for example y. Strength of the relationship will be indicated by a number called the correlation coefficient. Thus, the linear correlation is a measure of the linear relationship between two variables x and y is denoted by and defined as follows:
When
s
x and sy are the standard deviations for the two data. The value of r ranges between -1 ≤ r ≤ 1.Perfect linear relationship between two variables would be if the value of r = +1 or r = -1. For r = ± 1, the data points (xi, yi) cluster along a straight line and the samples are said to have a perfect correlation( plus (+)for ‘in-phase’) fluctuations and minus (-) for 1800 ‘out-of-phase) fluctuations). For r 0, the points are scattered randomly on the graph and there is little or no relationship between the variables.
Linear Regression
Regression equation is a mathematical equation that can be used to interpret the values of a dependent variable from the independent variable. To find the regression line equation can be used a variety of approaches (formulas), so the value of the constant (a) and regression coefficient (b) can be searched using the following method:
The accuracy of the regression line can be seen if all the distribution points close to the regression line. Development and the deviation of points from the regression line is called the error. There are three standard error, the Mean Bias Error (MBE), The Root Mean Square Error (RMSE) and the Mean Absolute Error (MAE), which were defined as follows [6].
The Mean Bias Error (MBE) is obtained from the total existing errors. Where the positive
The Root Mean Square Error (RMSE) is an alternative method for evaluating a forecasting technique, where each squared residual errors or mistakes which usually results in a smaller but
sensitive to extreme values [7]. If the RMSE is used, then anomalous values could significantly change the evaluation of a TRMM when comparing it with rain gauge data. The MAE uses the absolute difference, thus reducing the sensitivity to extreme differences. In our analysis, the MBE and RMSE were used to ascertain the systematic and random components of the error, respectively, in our product estimates [8].
Results and Discussion
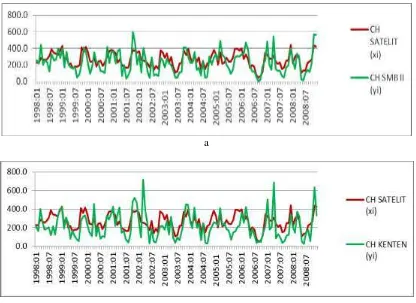
This study has compared monthly precipitations from in-situ observation in the Palembang city and those derived from Tropical Rainfall Measuring Mission (TRMM) for a period of January 1998 - December 2008. Comparison of monthly precipitation from rain-gauge and TRMM satellite are presented in Figure 2.
a
b
Figure 2 Graphs of monthly rainfall measured by 3B43 and gauges, in the a. SMB II and b. Kenten, Palembang
Comparison of monthly precipitation from SMB II station and TRMM satellite showed by Figure 1.a, where rainfall pattern of SMB II station seen relatively higher than rainfall of TRMM satellite. The higher rainfall has recorded by SMB II station on November in 2001 with the rainfall value is 602 mm/hour. Whereas, The higher rainfall of TRMM satellite occured on December in 2007, it is 425 mm/hour. Meanwhile, the lower rainfall has occured on August in 2007 and 2008, it is 0 mm/hour, whereas the lower rainfall has recorded by TRMM satellite on August 2007, it is 50 mm/hour.
a b
c
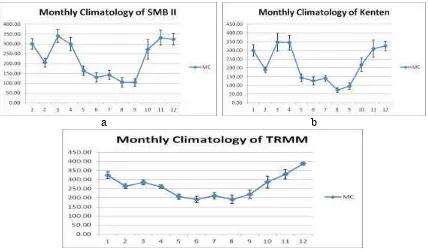
Figure 3 Monthly climatology: a. SMB II station, b. Kenten station, and c. TRMM satellite
Calculation of monthly climatology from monthly precipitation of SMB II station data, and Kenten station data have been relatively showed same rainfall patterns. Meanwhile, monthly climatology of monthly precipitation from TRMM satellite have different pettern. Monthly climatology graph of SMB II have two peak of rainfall, i.e. on March (MC= 340 mm/hour) and November (MC = 342 mm/hour) (Figure 3.a). The lower rainfall has occured on September (MC = 99 mm/hour), meanwhile rainfall decraesing has recorded om February too (MC = 200 mm/hour). Monthly climatology graph Kenten station (Figure 3.b) has relatively similar pattern with SMB II satation. Where, the higher precipitation on March (MC = 350 mm/hour) and December (MC = 325 mm/hour). Meanwhile, rainfall decreasing on February (MC = 195 mm/hour) has relatively lower value than on August (MC = 80 mm/hour). Monthly climatology graph of TRMM satellite (Figure 3.c) relatively different, where one of the higher rainfall has recorded on December (MC = 397 mm/hour). The lower rainfall has occured on August (186 mm/hour).
To determine the correlation of monthly precipitation measurement result of rain-gauge and TRMM satellite, so that the linear correlation calculation using Equation 2.1. whereas to determine the value of deviation of TRMM satellite data to rain-gauge data, then MBE, RMSE, and MAE calculation (Equation 2.4, 2.5, and 2.6). From the calculation results derived correlation data like presented in Table 1.
Table 1. Correlation Coefficient and Error
Satelit
parameter
Stasiun
SMB II Kenten
r (mm/hour) 0.7366 0.6556
MBE (mm/hour) 36.34 44.93
RMSE (mm/hour) 47.54 56.24
MAE (mm/hour) 83.58 92.41
*The correlation coefficient is significant in 95% level, is r = ± 0.5.
The larger systematic error in the comparison of monthly precipitation from rain-gauge and TRMM sattelite is comparison of Kenten station data and TRMM satellite data (MBE = 44.93 mm/hour). Whereas, comparison of montlhy precipitation from SMB II station and TRMM satellite have MBE value as many as 36.34 mm/hour. The RMSE value have same pattern with MBE pattern. Kenten station have the higher value (56.24 mm/hour) and RMSE SMB II station have value as many as 47.54 mm/hour. Comparison of montlhy precipitation Kenten station and TRMM satellite have the higher MAE value, i.e. 92.41 mm/hour, meanwhile SMB II station have the lower MAE value (83.58 mm/hour).
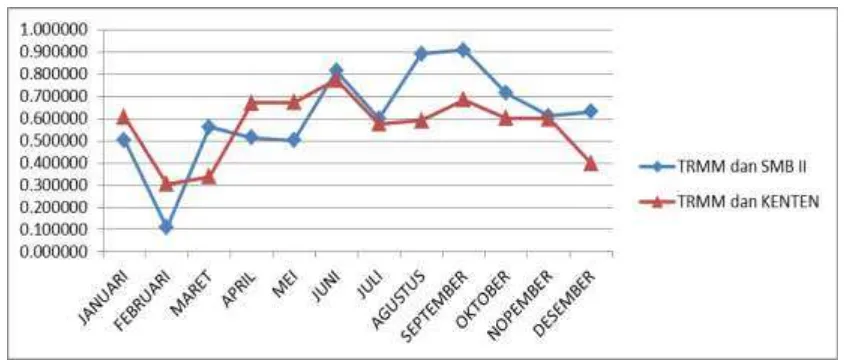
To determine correlation of monthly precipitation from rain-gauge and TRMM satellite, so correlation coeficient calculation was done in every month of observation. The calculation value is presented in Figure 4.
Figure 4 comparison average monthly values of correlation coeficient in every month of observatio Comparison of monthly precipitation data from SMB II station , Kenten station and TRMM satellite is above of significant level (95%), except in some month.
Calculation results of correlation coeficient and error has supported by linear regression analysis. Analysis results is presented in Figure 5.
a b
Figure 5 Scatterplots of monthly 3B43 TRMM product vs monthly rain gauge data in the a. SMB II, and b. Kenten
Figure 5 shows regression graph of monthly precipitation from SMB II station and TRMM satellite. Data points of monthly precipitation from SM II station and TRMM sattelite closed to regression line. It is showed that both of data have strong relationship, where y = 1.1267x-69.675 and determination coefficient R2 = 0.5426.
general, rainfall from the rain gauge data was lower than the rainfall from TRMM satellite data: the average rainfall from the rain gauge in the SMB II and Kenten were 226.3 mm h-1 and 217.9 mm h-1. Whereas the average rainfall from 3B42 was 262.6 mm h-1.
Monthly values of the error statistics showed instability during the dry season. However, the instability did not affect the MBE error, the absolute error or the random error. The TRMM sattelite showed slight improvements when compared with the rain gauges data in terms of its ability to reduce both the random error and the scatter of the estimates.
Conclusion
The compared monthly and average monthly of TRMM data and rain gauges data has good correlation. However, the error values are large. The correlation and monthly climatology was relative stable. In general, the TRMM data can be used to replace the rain gauges data after taking into account the errors.
Acknowledgment
Support for this work was provided by Environmental Research Centre (PPLH). The referees also helped the authors to improve the quality of the manuscript considerably.
References
[1] Roongroj, Chokngamwong, and Chiu, Long S., 2011, Enter for Earth Observing and Space Research, George Mason University, Fairfax, VA 22030.
[2] Hou, A.Y., Skofronick-Jackson, G., Kummerow, C., And Shepherd, M., 2008, Global Precipitation Measurement, In Precipitation, Advances in Measurement, Estimation and Prediction, S.C. Michaelides (Ed.), pp. 131–170 (Berlin: Springer-Verlag).
[3] Levina, Muhammad Fauzi, et al., 2010, Korelasi Data Hujan dari Pos Hujan dengan Citra TRMM, Pusat Penelitian dan Pengembangan Sumber Daya Air, Bandung.
[4] Xie, P., and Arkin, P.A., 1996, Analyses of Global Monthly Precipitation Using Gauge Observations, Satellite Estimates and Numerical Model Predictions, Journal of Climate, 9, pp.840–858.
[5] Feidas, H., 2010, Validation of satellite rainfall products over Greece, Theoretical and Applied Climatology, 99, pp. 193–216.
[6] A. R. As-Syakur , T. Tanaka , R. Prasetia , I. K. Swardika & I. W. Kasa, 2011, Comparison of TRMM Multisatellite Precipitation Analysis (TMPA) Products and Daily-Monthly Gauge Data Over Bali, International Journal of Remote Sensing, 32:24, 8969-8982.
[7] Willmott, C.J., 1982, Some Comments on The Evaluation of Model Performance, Bulletin of the American Meteorological Society, 63, pp. 1309–1313.